2026 11 11
Global Financial Briefing — Wednesday, 11 November 2026
Americas index levels, commodities and day changes reflect the 11 Nov 2026 close. The euro AAA curve is the 10 Nov 2026 observation, the latest the ECB had published. FX is the evening quote; credit and macro figures are dated inline.
Market Overview
US shares rebounded on Wednesday, led by chip makers and other companies tied to artificial intelligence, a day after October's inflation figures had pushed bond yields up and shares down. The S&P 500 closed up 1.31%, the Nasdaq 100 2.28% and the Dow 0.49% (Yahoo Finance). The trigger was CoreWeave, a company that rents out AI computing capacity: after Tuesday's close it reported third-quarter revenue of $3.66 billion against $3.54 billion expected and raised its 2026 revenue forecast (figures as given in Tuesday's briefing), which eased worries about the debt AI companies have taken on, and reports of strong demand for the coming share sale by the AI developer Anthropic added to the mood (Trading Economics). CoreWeave closed up about 25% and the Philadelphia semiconductor index about 5.7% (Yahoo Finance); Nvidia rose about 2.9%, having been up as much as 5.1% during the session (Yahoo Finance; Investopedia), despite a downgrade by the broker Baird (CNBC). Technology led by a wide margin: the S&P 500's technology sector fund (XLK) rose 3.23%, against 1.86% for energy (XLE), the next largest gain, while the health care (XLV) and real estate (XLRE) funds ended almost unchanged and consumer discretionary (XLY) slipped 0.05%. At 7,619.38 the S&P 500 has recovered about 79% of its 4.36% fall of Thursday 5 November.
The US bond market was closed for Veterans Day, so Treasury yields could not react; the latest figures are Tuesday's, when the 10-year settled at 4.98% (US Treasury par curve, 10 November). The pressure for higher US rates did not ease. Chicago Fed President Austan Goolsbee called the October inflation report "borderline disturbing" in a television interview on Tuesday, and futures now treat a Fed rise at the 8 to 9 December meeting as certain, with 15% odds of a half-point move, against 13.6% on Tuesday, and 60% odds that the range reaches 4.25% to 4.50% by the January meeting (CME FedWatch, via CNBC). The dollar rose for a second day after Tuesday's 0.68% gain: the ICE dollar index was up 0.67% at 102.92, its highest since April 2025 (Trading Economics), the euro fell 0.64% to $1.1095, and the Swiss franc fell most among the major currencies, the dollar gaining 1.11% against it. Gold settled down 0.74% at $4,000.50.
Europe rose for a third session this week, after gains of 1.26% on Monday and 0.27% on Tuesday in the STOXX 600. The index closed up 0.72% at 663.05, its highest close on record and 0.05% below the intraday record of 663.41 set on 7 August; the DAX rose 1.20% to 26,662.77, also a record close. Siemens Energy rose more than 10% after record quarterly revenue, higher targets and a larger share buyback, and Infineon about 6.5% (Trading Economics). The CAC 40 rose 0.66% to its highest close since 31 August, in thin trading on France's Armistice Day holiday, when the Paris exchange stays open. European government bonds barely moved, the 10-year Bund and OAT yields each up 1 bp at 3.31% and 4.80%, but Japan's 10-year yield rose 10 bp to 2.79%, catching up with Tuesday's rise in Treasuries (Trading Economics). In Asia the Nikkei 225 rose 1.31% and Korea's Kospi 2.60%, while Hong Kong's Hang Seng fell 0.98%. The January Brent contract (BZF27) settled up 1.39% at $92.76, after Tuesday's 10-week low, as Iran denied that talks with Washington are under way (Trading Economics).
Global Indices Snapshot
Americas
| Index | Level | Day Chg | Day Chg % | Source |
|---|---|---|---|---|
| S&P 500 | 7,619.38 | +98.45 | +1.31% | yfinance ^GSPC |
| Nasdaq 100 | 28,374.25 | +633.46 | +2.28% | yfinance ^NDX |
| Dow Jones | 52,486.50 | +254.60 | +0.49% | yfinance ^DJI |
| Brazil IBOV | 172,060.44 | +723.46 | +0.42% | yfinance ^BVSP |
Americas data reflects the 11 Nov 2026 close.
The S&P 500 closed 0.70% below its 50-day average and 3.93% above its 200-day; the Nasdaq 100, up 2.28% on the day, is still 4.04% below its 50-day average and 1.32% above its 200-day. The Dow, with fewer technology companies, rose only 0.49% and is 0.89% above its 50-day average. The VIX volatility index closed at 17.49 (Yahoo Finance), down from Tuesday's close of 19.46 (FRED VIXCLS), still in the moderate range. Brazil's Ibovespa rose 0.42% and is 8.30% below its 50-day average.
Europe
| Index | Level | Day Chg | Day Chg % | Source |
|---|---|---|---|---|
| Euro STOXX 600 | 663.05 | +4.73 | +0.72% | yfinance ^STOXX |
| CAC 40 | 8,332.87 | +54.28 | +0.66% | yfinance ^FCHI |
| DAX | 26,662.77 | +315.32 | +1.20% | yfinance ^GDAXI |
| FTSE 100 | 10,835.47 | +83.88 | +0.78% | yfinance ^FTSE |
| SMI (Swiss) | 15,053.86 | +15.92 | +0.11% | yfinance ^SSMI |
European data reflects the 11 Nov 2026 close.
The STOXX 600's close of 663.05 is above its previous highest close of 660.51 on 11 August, and the index is 3.42% above its 50-day average. The DAX closed at 26,662.77, above its previous highest close of 26,569.99 on 28 August and within 0.5% of its intraday record, and is 4.30% above its 50-day average; the chemicals distributor Brenntag fell 3.8% after results that fell slightly short on profit, and Rheinmetall fell 6.5% (Trading Economics). In Paris, STMicroelectronics rose more than 4% and Schneider Electric more than 2%, TotalEnergies rose about 1.2% with oil, and EssilorLuxottica fell about 2% (Trading Economics); the CAC 40 is 3.84% above its 50-day average. The FTSE 100 rose 0.78%, with BP up 2.8% and Shell 1.2% as oil recovered, and miners and banks higher (Trading Economics). Switzerland's SMI rose 0.11% to its highest close on record and is within 0.5% of its intraday record.
Asia-Pacific
| Index | Level | Day Chg | Day Chg % | Source |
|---|---|---|---|---|
| Nikkei 225 | 61,248.59 | +789.01 | +1.31% | yfinance ^N225 |
| Hang Seng | 24,315.92 | −241.12 | −0.98% | yfinance ^HSI |
| Shanghai Comp | 3,680.64 | +16.92 | +0.46% | yfinance 000001.SS |
| ASX 200 | 9,153.20 | +24.20 | +0.27% | yfinance ^AXJO |
| Kospi (Korea) | 5,375.36 | +136.23 | +2.60% | yfinance ^KS11 |
Asia-Pacific data reflects the 11 Nov 2026 close.
Asia traded before the US rebound but after CoreWeave's results. The Nikkei 225 rose 1.31%, its third gain this week after 2.33% on Monday and 2.87% on Tuesday, and is still 5.83% below its 50-day average. Chip-related shares led: Advantest rose 5.9%, Kioxia 5.6%, Lasertec 6.3% and Taiyo Yuden 7.3%, while SoftBank fell after reporting its first net loss in almost two years, which included a $3.7 billion writedown on US data-centre projects (Trading Economics). Korea's Kospi rose 2.60% after Tuesday's 4.39% and is 15.03% below its 50-day average; Korean exports in the first ten days of November more than doubled from a year earlier to $33.5 billion, with chip shipments up 331.2% (Trading Economics). Hong Kong's Hang Seng fell 0.98%, with Alibaba down 2.87%, Tencent 2.0% and Xiaomi 1.6%, on profit-taking, worry about higher US rates and uncertainty before the meeting of Presidents Trump and Xi expected on 18 to 19 November (Trading Economics). Shanghai rose 0.46% and Australia's ASX 200 0.27%. China's vehicle sales fell 9.2% on the year in October, more than the 6.7% fall expected (Trading Economics).
Emerging Markets
| Index | Level | Day Chg % | Source |
|---|---|---|---|
| MSCI EM (EEM) | 62.04 | +2.43% | yfinance EEM |
| India Nifty 50 | 25,255.05 | +0.84% | yfinance ^NSEI |
| South Africa | 66.86 | −1.37% | yfinance EZA |
Emerging-market data reflects the 11 Nov 2026 close.
EEM's 2.43% rise is New York's valuation of emerging markets during the US chip rally, not what its markets did today: the fund trades in US hours, after its Asian markets had closed with smaller moves, the Kospi up 2.60%, the Nifty 50 up 0.84% and the Hang Seng down 0.98%. Thursday's Asian session will show whether local markets follow. The fund rose even though the dollar gained 0.67%, which lowers the dollar value of shares priced in local currencies. India's Nifty 50 rose for a ninth session in a row, from 22,698.85 on 28 October to 25,255.05 (Yahoo Finance); its 0.84% day change is against Monday's close, because Indian markets were closed on Tuesday for Diwali-Balipratipada, as Tuesday's briefing recorded. South Africa's fund (EZA) fell 1.37%.
Index Valuations & Investment Risk
Valuation Table
| Index | Trailing P/E (live) | 50-day avg | 100-day avg | 200-day avg |
|---|---|---|---|---|
| S&P 500 | 24.2x | 24.6x | 25.5x | — |
| Nasdaq 100 | 28.4x | 28.8x | 30.1x | — |
| Euro STOXX 600 | 18.0x | 17.7x | 18.0x | — |
| CAC 40 | 16.7x | 16.6x | 17.1x | — |
| DAX | 18.3x | 18.1x | 18.4x | — |
| FTSE 100 | 16.7x | 16.2x | 17.1x | — |
| Nikkei 225 | 17.7x | 19.4x | 20.9x | — |
| MSCI EM | 14.6x | 14.1x | 15.7x | — |
Averages of the daily trailing P/E readings recorded since 1 May 2026; shown for reference only. Trailing P/E is Yahoo Finance's trailing P/E for the ETF proxies SPY, QQQ, EXSA.DE, CAC.PA, EXS1.DE, ISF.L, 1321.T and EEM, taken 18:43 CET. SPY, QQQ and EEM are priced off the 11 Nov 2026 close; the other proxies were at their close when captured.
The S&P 500 and Nasdaq 100 readings rose with Wednesday's prices, from 23.9x and 27.8x at Tuesday's close.
Investment Risk Assessment for ETF Investors
United States (S&P 500 / Nasdaq ETFs)
The S&P 500's trailing P/E of 24.2x gives an earnings yield of 4.14% (1÷24.17). Against the settled 10-year Treasury yield of 4.98% (US Treasury par curve, 10 Nov) the earnings yield gap is −0.84 pp: a 10-year government bond pays more income than the index's earnings come to per dollar invested. The gap was −0.79 pp at Tuesday's close; the change comes only from higher share prices, because the bond market was closed. Against the real 10-year yield of 2.78% (US Treasury real curve, 10 Nov) the gap is +1.36 pp; the 2.20 pp difference is the correction for company earnings growing with inflation while a bond coupon is fixed. Only the part of earnings paid out as dividends and buybacks reaches a holder as cash. The Nasdaq 100 at 28.4x has an earnings yield of 3.52%, 1.46 pp below the 10-year Treasury. The S&P 500 is 3.93% above its 200-day average and 0.70% below its 50-day. The VIX was 19.46 on 10 November (FRED VIXCLS), moderate. The past week shows how much the index depends on one group of companies: the 4.36% fall of 5 November and today's 1.31% rise both came mainly from AI-related shares, with the technology sector fund (XLK) up 3.23% today against 0.49% for the Dow. A Fed expected to raise rates in December makes higher bond yields the other main risk to valuations, and Treasuries have not yet traded since today's rally.
Europe (STOXX 600 / CAC 40 / DAX ETFs)
The STOXX 600 at 18.0x gives an earnings yield of 5.55% (1÷18.01); against the euro AAA 10-year yield of 3.33% (ECB YC API, 10 Nov) the euro earnings yield gap is +2.22 pp, and against today's 10-year Bund quote of 3.31% (Trading Economics) it is +2.24 pp. Against the euro-area real 10-year yield of 1.31% (AAA nominal less long-term HICP expectations, ECB SPF 2026 Q4) it is +4.24 pp. The US trades at a 34.2% premium to the STOXX 600 on trailing earnings. Part of the gap between the US and euro figures reflects different inflation and policy paths rather than different compensation for risk, although on the figures for 10 November only 18 bp of the 165 bp difference in 10-year yields is expected inflation and 147 bp is real yield. In France the CAC 40 at 16.7x yields 5.99% in earnings, 1.20 pp above the 10-year OAT at 4.80%, because French government debt pays 148 bp more than German debt. The DAX at 18.3x gives 5.47%, 2.16 pp above the Bund. The STOXX 600 and the DAX closed at their highest levels on record, which leaves less room for disappointment. German inflation was confirmed at 2.8% for October, down from 3.3%, but ECB chief economist Philip Lane has said a further rate rise may be needed in December (Trading Economics), after the 10 September move to 2.50%. For a euro investor in euro-quoted funds the quoted value carries no exchange-rate effect, but the earnings do: many STOXX 600 companies earn in dollars, and a euro 0.64% weaker today makes those earnings worth slightly more in euros.
Japan (Nikkei / TOPIX ETFs)
The Nikkei fund (1321.T) trades at 17.7x trailing earnings, an earnings yield of 5.66% (1÷17.67), 2.87 pp above the 10-year JGB at 2.79%. Today's 1.31% rise leaves the index 5.83% below its 50-day average and 1.25% below its 200-day. The Bank of Japan raised its rate to 1.25% on 18 September and held it on 30 October; its published summary of that meeting's discussion showed broad agreement that rates should keep rising, and the 10-year JGB yield rose 10 bp today (Trading Economics). The yen weakened to 159.84 per dollar, the dollar gaining 0.72%; for a euro investor an unhedged Nikkei fund carries the yen exposure in full, while a hedged share class removes it but pays the difference between euro and yen short-term rates.
Emerging Markets (MSCI EM ETFs)
EEM trades at 14.6x trailing earnings, an earnings yield of 6.87% (1÷14.57) and a 39.7% discount to the S&P 500. The fund is 4.82% below its 50-day average, and Korea's Kospi, a large weight, is 15.03% below its own after two days of gains. Higher US yields and a stronger dollar, as this week, raise the cost of dollar debt for emerging economies and the pressure on their central banks to keep rates high, effects that weigh on local share prices whatever the investor's home currency; the currency conversion itself largely cancels for a euro holder, since the euro also fell against the dollar today.
Overall Risk Score: - United States: High valuation risk / low margin of safety. A negative nominal earnings yield gap of −0.84 pp, an index whose daily moves depend on AI-related shares, and a Fed expected to raise rates in December. - Europe: Moderate. Positive earnings yield gaps on both measures and a P/E well below the US, but the STOXX 600 and the DAX are at record closing levels and the ECB may raise rates in December. - Japan: Moderate. A P/E of 17.7x, a 10-year yield up 10 bp today and a Bank of Japan whose board broadly favours further rises. - Emerging markets: Moderate. The cheapest of the four on trailing earnings, with higher US yields and a dollar at its highest since April 2025 (Trading Economics) the main pressure.
US Economic Indicators (FRED - authoritative)
| Indicator | Current | Prior | Delta | Reference Date | FRED Series |
|---|---|---|---|---|---|
| CPI YoY % | 3.72% | 3.35% | +0.36 pp | Sep 2026 (prior Aug) | CPIAUCSL |
| Core CPI YoY % | 2.57% | 2.45% | +0.12 pp | Sep 2026 (prior Aug) | CPILFESL |
| Unemployment Rate | 4.1% | 4.2% | −0.10 pp | Oct 2026 (prior Sep) | UNRATE |
| Nonfarm Payrolls | +165k | +60k | +105k | Oct 2026 (prior Sep), monthly chg | PAYEMS |
| 10Y TIPS Real Yield | 2.78% | 2.66% | +12 bp | 10 Nov 2026 (prior 9 Nov) | DFII10 (US Treasury real curve) |
The CPI rows are September's, the latest FRED holds. October's report, published on Tuesday, gave monthly changes only (headline +0.4%, core +0.3%), because October 2025 prices were not collected during last year's government shutdown and no year-on-year rate could be calculated (CNBC). The real-yield row is Tuesday's close: the US bond market was closed today.
Other economic releases today (web search)
| Release | Actual | Consensus | Prior | Note |
|---|---|---|---|---|
| Germany CPI YoY, final (Oct) | 2.8% | 2.8% | 3.3% | in line, confirming the first estimate; the EU-harmonised rate was also 2.8%, from 3.3% (Trading Economics) |
| Italy industrial production MoM (Sep) | 1.2% | 0.7% | −1.2% | above consensus; down 0.1% on a year earlier (Trading Economics) |
| China vehicle sales YoY (Oct) | −9.2% | −6.7% | −8.4% | below consensus (Trading Economics) |
| Japan machine tool orders YoY (Oct) | 42.5% | — | 60.4% | slower than September (Trading Economics) |
| US MBA mortgage applications WoW (week to 6 Nov) | 6.2% | — | −1.2% | the average 30-year mortgage rate fell to 7.21% from 7.30% (Trading Economics) |
Today's calendar was light and none of these releases moved markets. Germany's final figure confirmed that inflation fell to 2.8% in October from 3.3% in September. Italian industrial output rose 1.2% in September after a 1.2% fall in August, more than the 0.7% expected, though it was still 0.1% lower than a year earlier. In the US, mortgage applications rose 6.2% in the week to 6 November as the average 30-year mortgage rate eased to 7.21%; that week ended before Tuesday's rise in Treasury yields.
Fixed Income & Bond Analysis
Policy Rates
| Central Bank | Rate | Source |
|---|---|---|
| Fed Funds (upper) | 4.00% | FRED DFEDTARU (11 Nov 2026) |
| Fed Funds (lower) | 3.75% | FRED DFEDTARL (11 Nov 2026) |
| Effective FFR | 3.88% | FRED DFF (9 Nov 2026) |
| ECB Deposit Rate | 2.50% | FRED ECBDFR (11 Nov 2026) |
| BOJ Policy Rate | 1.25% | web search (raised to 1.25% on 18 Sep 2026, held on 30 Oct 2026) |
| BOE Bank Rate | 4.00% (SONIA 3.98%) | FRED IUDSOIA (9 Nov 2026); web search (Trading Economics: raised 25 bp to 4.00% on 5 Nov 2026) |
The Fed's range is 3.75% to 4.00%, reached with a quarter-point rise on 16 September and held in October by a 10 to 2 vote, as earlier briefings recorded. Chicago Fed President Goolsbee, who does not vote this year, said tariff-driven price rises have not faded as he had hoped and that the Fed has "a real inflation issue" to address, but declined to say whether he favours a December rise; Philadelphia Fed President Anna Paulson, who votes in December, said further gradual tightening seems appropriate (CNBC). Goldman Sachs now expects rises in December and March (CNBC). The Bank of England raised Bank Rate to 4.00% on 5 November and SONIA was 3.98% on 9 November; markets increasingly expect a further rise by December after Deputy Governor Clare Lombardelli said back-to-back increases remain possible (Trading Economics).
Government Bond Yields
| Country | 2Y Yield | 10Y Yield | 30Y Yield | Day Chg (10Y) | Source |
|---|---|---|---|---|---|
| USA | 4.73% | 4.98% | 5.35% | +10 bp | US Treasury par curve (10 Nov 2026) |
| Germany | 3.13% | 3.31% | 3.67% | +1 bp | web (Trading Economics, 11 Nov 2026 intraday) |
| France | 3.59% | 4.80% | 5.32% | +1 bp | web (Trading Economics, 11 Nov 2026 intraday) |
| UK | 4.92% | 5.23% | 5.64% | +2 bp | web (Trading Economics, 11 Nov 2026 intraday) |
| Japan | 1.85% | 2.79% | 3.94% | +10 bp | web (Trading Economics, 11 Nov 2026 intraday) |
| Italy | — | 4.35% | — | −3 bp | web (Trading Economics, 11 Nov 2026 intraday) |
The USA day change is against the 9 Nov 2026 curve from the same feed.
Yield Curve Spreads (US Treasury par curve, 10 Nov 2026): - 10Y-2Y spread: +25 bp, flat (within the ±25 bp flat band), −7 bp on the day. - 10Y-3M spread: +68 bp, positive, no recession signal, +4 bp on the day.
OAT-Bund Spread: 148 bp (10-year OAT 4.80% against Bund 3.31%, Trading Economics, 11 Nov 2026 intraday).
The US rows are Tuesday's close and the US day changes are Tuesday's against Monday: the bond market was closed today for Veterans Day. On that close the 2-year stands at 4.73% and the 10-year at 4.98%, a gap of 25 bp, the edge of the flat band.
European bonds had a quiet day after Tuesday's jump. The 2-year Bund rose 4 bp to 3.13% and the 10-year 1 bp to 3.31%; Germany sold 30-year debt at an average yield of 3.66%, against 3.67% at the previous sale (Trading Economics). The 10-year OAT also rose 1 bp, to 4.80%, leaving the OAT-Bund spread at 148 bp. Italy's 10-year fell 3 bp to 4.35%, 103 bp above the Bund. In the UK the 2-year gilt rose 3 bp to 4.92% and the 10-year 2 bp to 5.23%, while the 30-year fell 3 bp to 5.64%; third-quarter GDP on Thursday is the next test for gilts (Trading Economics).
Japan had the day's largest move. Tokyo had closed on Tuesday before the US inflation figures, so Japanese bonds reacted today: the 10-year yield rose 10 bp to 2.79%, a one-week high, and the 2-year 7 bp to 1.85%, helped by the Bank of Japan's summary showing support for further rate rises (Trading Economics).
Yield Curve Charts
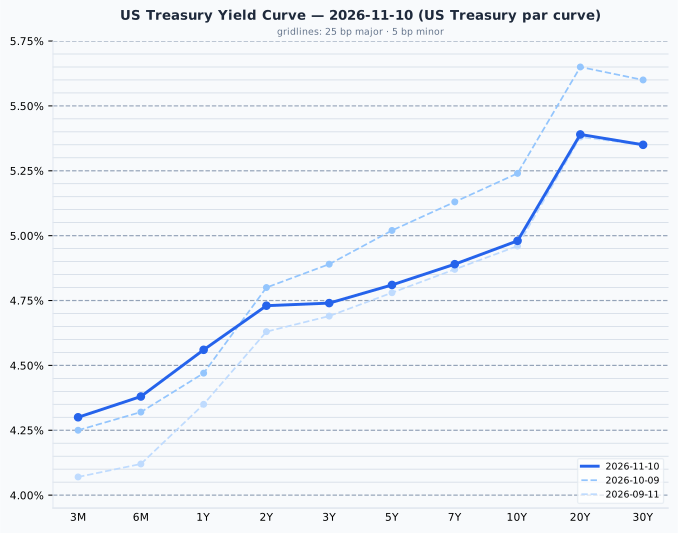
US Treasury par curve, 10 Nov 2026: 3M 4.30%, 6M 4.38%, 1Y 4.56%, 2Y 4.73%, 3Y 4.74%, 5Y 4.81%, 7Y 4.89%, 10Y 4.98%, 20Y 5.39%, 30Y 5.35%; 2-to-10 slope +25 bp. Day change against the 9 Nov 2026 curve: 3M +6 bp, 6M +12 bp, 1Y +18 bp, 2Y +17 bp, 3Y +16 bp, 5Y +14 bp, 7Y +13 bp, 10Y +10 bp, 20Y +10 bp, 30Y +9 bp. The 3-month bill at 4.30% is 42.5 bp above the Fed Funds midpoint of 3.875%.
This is the same 10 November curve as in Tuesday's briefing, since no new curve was struck today. It rises from 4.30% at three months to 5.39% at 20 years, with the 30-year slightly lower at 5.35%. Since the 9 October curve it has fallen by 7 bp at the 2-year and 26 bp at the 10-year, while the 3-month bill is 5 bp higher, so the curve is lower and flatter than a month ago. Against the 11 September curve the 10-year is only 2 bp higher but the 3-month bill is 23 bp higher and the 2-year 10 bp, the mark of two months in which expected Fed rises were added at the short end.
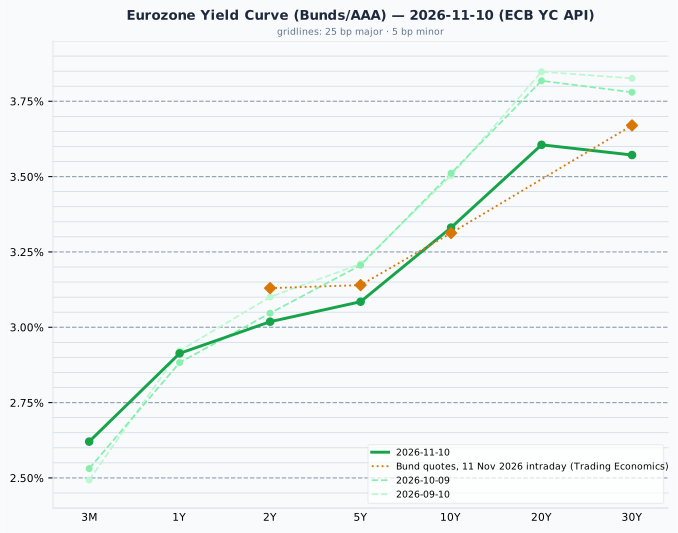
Euro area AAA government curve, 10 Nov 2026 (ECB YC API): 3M 2.62%, 1Y 2.91%, 2Y 3.02%, 5Y 3.08%, 10Y 3.33%, 20Y 3.61%, 30Y 3.57%; 2-to-10 slope +31 bp. Today's Bund quotes (Trading Economics, 11 Nov 2026), overlaid, differ from the plotted 10 Nov 2026 curve by at most 11 bp, at the 2Y (3.13% against 3.02%); the curve is the ECB's fitted AAA euro-area composite and the quotes are on-the-run Bunds, which sit a few basis points apart by construction, so only a gap well beyond that is a day move.
The 10 November euro AAA curve, which includes Tuesday's rise in yields, runs from 2.62% at three months to 3.61% at 20 years. Since the 9 October curve the 10-year has fallen 18 bp and the 2-year 3 bp while the 3-month rate rose 9 bp, so the euro curve has flattened over the month. Today's Bund quotes, plotted above it, sit 11 bp higher at the 2-year and 10 bp higher at the 30-year, and 2 bp lower at the 10-year.
Credit Markets (from FRED - authoritative)
| Market | OAS | Obs. date | vs prior obs | Series ID |
|---|---|---|---|---|
| US Investment Grade | 91 bp | 9 Nov 2026 | −2 bp | BAMLC0A0CM |
| US High Yield | 334 bp | 9 Nov 2026 | −8 bp | BAMLH0A0HYM2 |
| Euro High Yield | 340 bp | 9 Nov 2026 | −9 bp | BAMLHE00EHYIOAS |
Change is 9 Nov 2026 vs 6 Nov 2026. Credit spreads are the 9 November close; today's session is not in them yet.
US high yield at 334 bp and investment grade at 91 bp are both in their normal ranges (300 to 500 bp and 80 to 150 bp); euro high yield is 340 bp. These are the same 9 November observations as in Tuesday's briefing, because no newer figure has been published: they show Monday's rally and neither Tuesday's inflation report nor today's rebound.
Real Yields (US and Euro Area)
| Region | Nominal 10Y | Expected inflation | Real 10Y | How the real yield is obtained |
|---|---|---|---|---|
| United States | 4.98% (US Treasury par curve, 10 Nov 2026) | 2.20% (residual: nominal − real) | 2.78% (US Treasury real curve, 10 Nov 2026) | Measured. TIPS trade, so the market quotes a real yield directly; expected inflation is the residual (the breakeven) |
| Euro area | 3.33% (ECB YC API, 10 Nov) | 2.02% (ECB SPF, 2026 Q4, measured) | 1.31% (residual: nominal − expected) | Constructed. No euro inflation-linked benchmark is published, so a survey expectation is subtracted from the nominal yield |
The US real yield of 2.78% is a market price, quoted on inflation-protected Treasuries, and the 2.20% expected inflation is derived from it; the euro figure works the other way, subtracting a survey's 2.02% expected inflation from the AAA yield, so the euro real yield of 1.31% is the softer of the two. Two mismatches apply: the US breakeven includes a premium investors demand for inflation risk, which a survey does not, and the survey's five-year horizon is shorter than the bond's ten years. With both legs dated 10 November, the 165 bp gap between US and euro 10-year yields is 18 bp of expected inflation and 147 bp of real yield. The US real yield rose 12 bp from 2.66% on 9 November, while the breakeven fell 2 bp; no US real yield was struck today because the bond market was closed.
The US–euro real rate gap is not an investment opportunity
The US real yield has exceeded the euro one in every quarter since 2014, by 1.52 pp on average, and today's 147 bp is under that mean. It is a structural feature (US trend growth, euro-area savings, Bund scarcity, US fiscal supply), not a trade a EUR-based reader can capture: hedging the currency removes it, because the forward rate is set from the same interest differential, and holding Treasuries unhedged is a dollar bet rather than a bond decision. A real yield is real in its own currency; a US real yield of 2.78% is that much above US inflation, which is not a real return for someone who spends euros. The gap is stated here as a description of relative policy stance and growth expectations, and no portfolio conclusion is drawn from it.
Bond Portfolio Implications
A 10 bp rise in yields is an ordinary day's move. At the 10 Nov 2026 par yields it costs:
| Maturity | Yield | Modified duration | Loss for a 10 bp rise | Months of coupon lost |
|---|---|---|---|---|
| 2-year | 4.73% | 1.89 | 0.19% | 0.5 |
| 10-year | 4.98% | 7.80 | 0.78% | 1.9 |
| 30-year | 5.35% | 14.86 | 1.47% | 3.3 |
Months of coupon lost is the loss divided by one month of coupon (yield ÷ 12) on a par bond.
Tuesday's 10 bp rise at the 10-year cost a holder about 0.8%, or 1.9 months of coupon.
The 10 bp rise priced above is Tuesday's, the latest session, since Treasuries did not trade today. The settled 10-year Treasury at 4.98% pays 0.84 pp more than the S&P 500's earnings yield of 4.14%, and the 2-year at 4.73% pays 0.59 pp more; a bond buyer can lock in that income today, while an equity holder accepts the index's earnings yield, of which only the dividend and buyback part arrives as cash. On a real basis the comparison reverses (earnings yield 1.36 pp above the 2.78% real yield), because company earnings rise with inflation and a coupon does not. Tuesday's 17 bp rise at the 2-year cost a holder about 0.3%, less than half the 10-year's 0.8% loss on a 10 bp rise, because the 2-year's duration of 1.89 is about a quarter of the 10-year's 7.80. With futures on Wednesday 11 November treating a December Fed rise as certain and giving 15% odds of a half-point move (CME FedWatch, via CNBC), short maturities keep most of the income with far less exposure to a further surprise; the long end pays 62 bp more at 30 years for nearly eight times the 2-year's loss on a 10 bp rise. In Germany the choice is similar: the 10-year Bund at 3.31% pays only 18 bp more than the 2-year at 3.13%.
Currencies & Commodities
Currencies (Yahoo Finance live quotes)
| Pair | Rate | Day chg % | Source |
|---|---|---|---|
| EUR/USD | 1.1095 | −0.64% | yfinance (18:42 CET) |
| USD Index (DXY, ICE) | 102.92 | +0.67% | yfinance (18:33 CET) |
| USD/JPY | 159.84 | +0.72% | yfinance (18:43 CET) |
| GBP/USD | 1.3275 | −0.53% | yfinance (18:42 CET) |
| USD/CHF | 0.8336 | +1.11% | yfinance (18:43 CET) |
FX quotes as of 18:43 CET; day change vs the previous 17:00 ET close.
The dollar gained against every currency in the table for a second day, after Tuesday's 0.68% rise in the ICE dollar index, as markets priced faster Fed rate rises; the index's 102.92 is its highest since April 2025 (Trading Economics). The Swiss franc fell most: with the Swiss policy rate at 0.00%, the franc is widely borrowed to buy higher-yielding assets elsewhere, and a wider gap with US rates adds to that selling (Trading Economics). The yen weakened to 159.84 per dollar even though Japanese bond yields rose. For a euro investor, the euro's 0.64% fall raises the euro value of unhedged dollar assets by about as much.
Commodities (Yahoo Finance front-month futures)
| Commodity | Price | Day Chg % | Ticker | Source |
|---|---|---|---|---|
| Brent Crude ($/bbl) | 92.76 | +1.39% | BZ=F | yfinance (BZF27, Jan) |
| WTI Crude ($/bbl) | 86.53 | +0.57% | CL=F | yfinance (CLZ26, Dec) |
| Gold ($/oz) | 4,000.50 | −0.74% | GC=F | yfinance (GCZ26, Dec) |
| Silver ($/oz) | 52.002 | +1.52% | SI=F | yfinance (SIZ26, Dec) |
| Copper ($/lb) | 6.2900 | +0.89% | HG=F | yfinance (HGZ26, Dec) |
| Nat Gas ($/MMBtu) | 3.215 | −2.46% | NG=F | yfinance (NGZ26, Dec) |
Day changes are settlement-to-settlement: 11 Nov 2026 settlement vs 10 Nov 2026 settlement. Prices are the 11 November settlements of the contracts named.
Brent's January contract (BZF27), the same contract as in Tuesday's table, settled at $92.76, up 1.39% on Tuesday's settlement of $91.49, a 10-week low, and near the middle of its 52-week range of $58.72 to $126.10. Iran's security chief said no enriched nuclear material would leave the country and denied that talks with Washington are under way; 37 vessels were attacked near the Strait of Hormuz in October, the most in any month since the war began, and a tanker was struck off Oman (Trading Economics). Against that, Saudi output rose 26% in October to 10.56 million barrels a day and an industry report showed US crude stocks up 9 million barrels (Trading Economics). WTI's December contract (CLZ26) settled up 0.57% at $86.53, within a 52-week range of $54.98 to $119.48. Gold gave up early gains as the dollar rose (Trading Economics) and settled down 0.74% at $4,000.50, 28.4% below its all-time high of $5,586.20 set on 29 January 2026 and $121.20 above its 52-week low of $3,879.30. Silver settled up 1.52% at $52.002, 57.1% below its all-time high of $121.30 from the same day. Copper settled up 0.89% at $6.2900 per pound, 7.9% below its all-time high of $6.83 set on 22 September. Natural gas settled down 2.46% at $3.215, near the low end of its 52-week range of $2.483 to $7.827.
Sector & Theme Highlights
US sectors (Select Sector SPDR funds): technology (XLK) rose 3.23%, by far the largest move among the eleven sector funds, followed by energy (XLE) at 1.86%, industrials (XLI) at 1.33%, communication services (XLC) at 0.78% and financials (XLF) at 0.58%. Consumer staples (XLP), materials (XLB) and utilities (XLU) rose between 0.2% and 0.5%, health care (XLV) and real estate (XLRE) ended almost unchanged (up 0.04% and 0.02%), and consumer discretionary (XLY) was the only fund to fall, by 0.05%.
AI and chips: CoreWeave's results turned the mood on AI-related shares in Japan, Europe and the US within a day. Japan's chip-related shares rose first, then Europe's Infineon, ASML (about 3%) and STMicroelectronics (Trading Economics), then the Philadelphia semiconductor index, which closed up about 5.7% (Yahoo Finance). Siemens Energy's rise of more than 10% came from its own results, record quarterly revenue, higher targets and a larger share buyback, with data-centre demand for power equipment lifting its margins (Trading Economics). Nvidia rose about 2.9% even as Baird cut its rating to neutral and its price target to $200 from $500, citing a possible slowdown in spending by the largest cloud companies, uncertainty over whether chief executive Jensen Huang stays in his post during the board's inquiry, and a possible ban on exports of its H200 chips to China (CNBC).
Who is buying: Bank of America's client data show institutions bought more than $6.1 billion of US shares last week while retail clients sold about $2 billion, their fourth week of net selling in a row (CNBC), so the rebound from the 5 November fall has so far been led by professional investors.
Rates and the dollar: shares rose on a day when Treasuries could not trade. Rate expectations kept moving up in futures and in the dollar, so Thursday's bond session will show whether yields rise further and whether shares hold their gains if they do.
Top Stories (Global)
- AI shares rebound after CoreWeave. The Nasdaq 100 closed up 2.28% and the S&P 500 1.31%; CoreWeave rose about 25% after reporting revenue above forecasts and raising its 2026 outlook, and the Philadelphia semiconductor index about 5.7% (Yahoo Finance; Trading Economics).
- US bond market closed. Treasuries did not trade on Veterans Day; the 10-year stays at Tuesday's 4.98% (US Treasury par curve). On Wednesday, futures priced a December Fed rise as certain, with 15% odds of a half-point move, up from 13.6% on Tuesday (CME FedWatch, via CNBC).
- Goolsbee on inflation. The Chicago Fed president called October's inflation report "borderline disturbing" and said the Fed has a real inflation problem to address; Goldman Sachs now expects rises in December and March (CNBC).
- Record closes in Europe. The STOXX 600 closed at 663.05 and the DAX at 26,662.77, both their highest closes on record; Siemens Energy rose more than 10% on record quarterly revenue and a larger buyback (Yahoo Finance; Trading Economics).
- Baird downgrades Nvidia. The broker cut its rating to neutral and its price target to $200 from $500, citing AI spending, uncertainty over the chief executive and possible export limits; the shares still rose about 2.9% (CNBC; Yahoo Finance).
- Dollar at its highest since April 2025. The ICE dollar index rose 0.67% to 102.92 and the euro fell to $1.1095; the Swiss franc lost 1.11% against the dollar (Yahoo Finance; Trading Economics).
- Oil recovers from a 10-week low. Brent settled up 1.39% at $92.76 as Iran denied talks with Washington; 37 vessels were attacked near the Strait of Hormuz in October (Trading Economics).
- Iran threats and US-China talks. Treasury Secretary Scott Bessent has moved to a military base after threats from Iran, and three Iranian nationals were indicted in the US on terrorism charges; separately, Bessent said the US and China have set up a dialogue on the risks of advanced AI ahead of the Trump-Xi meeting expected at the APEC summit on 18 to 19 November (CNBC).
Looking Ahead
- Thursday 12 November: the US bond market reopens, the first chance for Treasury yields to react to Wednesday's share rally and the latest Fed comments; UK third-quarter GDP (Trading Economics); US weekly jobless claims; Asia's session will show whether chip shares there follow New York.
- Friday 13 November: the second estimate of euro-area third-quarter GDP and US producer prices for October (Trading Economics calendar).
- This week: results from Cisco and Applied Materials (CNBC, as cited in the 9 November briefing).
- Tuesday 17 November: UK labour market figures, US retail sales for October and Germany's ZEW survey (Trading Economics calendar).
- 18 to 19 November: the APEC leaders' meeting, where Presidents Trump and Xi are expected to meet (CNBC); Anthropic's shares could begin trading as early as next week (Trading Economics).
- Further out: the Fed decides on 8 to 9 December; Christine Lagarde leaves the ECB on 7 February 2027.
Market closures - Closed today: the US bond market, not stocks (Veterans Day). - None in the next five days (12 Nov to 16 Nov 2026). - Further out: Brazil 20 Nov 2026 (Black Awareness Day); Japan 23 Nov 2026 (Labour Thanksgiving Day). - No Indian holiday data is available here, so Indian closures are not checked.
Data sources: US Treasury par and real curves (10 Nov 2026) and FRED (policy rates, VIX, credit spreads, macro); ECB YC API (AAA curve, 10 Nov 2026) and ECB SPF (2026 Q4); equity indices, ETF P/E proxies, commodity futures, live yields and FX via Yahoo Finance (taken 18:43 CET, with the Americas indices, EEM, EZA and the commodity settlements at the 11 Nov 2026 close); European, UK and Japanese bond yields, economic releases and news via web search (Trading Economics, CNBC).