2026 09 08
Global Financial Briefing — Tuesday, 8 September 2026
Americas index levels, commodities, the US-listed ETF rows and day changes reflect the 8 September closing print; US Treasury figures, the curve spreads and the US yield curve chart use Treasury's settled 8 September par curve. FX and macro figures are dated inline.
US and Brazilian markets were shut yesterday (Labor Day, Independence Day), so all Americas day changes are measured against Friday 4 September.
Market Overview
The reflation trade that has been building for a fortnight got two more pushes today, and equities finally started to notice. Saudi Arabia halted operations at energy facilities after Houthi attacks, Iran warned it would act pre-emptively against threats, and Brent settled up 1.70% at $97.92 with WTI 1.69% higher at $93.03. Goldman Sachs raised its targets on both benchmarks. At the same time Canada's counter-tariffs took effect: 15% to 50% duties on more than 700 US product lines covering roughly C$27.6bn of imports, with the steel rate doubled to 50%, in retaliation for Washington's 50% levy on about $20bn of Canadian goods. Copper did what copper does when you combine an energy shock, a tariff scramble and a structural supply deficit, and printed an all-time high: the COMEX front month settled at $6.8235/lb, up 2.11% and above its previous record close of $6.75 set on 26 August, while LME three-month futures touched $14,533 a tonne. The metal is up around 17% over the year on mine supply failing to keep pace with data centre, grid and renewables demand.
Underneath the index level, this was a rotation rather than a broad selloff, though the afternoon took the shine off it. The Dow closed down 1.18% and the S&P 500 down 0.58%, while the Nasdaq 100 gave up a midday gain of 0.16% to finish 0.12% lower, held close to flat by Qualcomm (+8% on a multi-generational custom AI data centre chip deal with Amazon), Intel (+5% on reported price increases) and Oracle (+5% ahead of Thursday's earnings). The AI complex did not end the day higher, but it lost a tenth of a point on a day the Dow lost more than a point, and that 105 bp spread in a single session is the story: the cyclical, tariff-exposed, rate-sensitive half of the US market is being marked down while the AI capex complex absorbs almost none of it. Europe was almost inert by comparison, the STOXX 600 closing at 649.60 (-0.05%) with the CAC 40 up 0.14% and the DAX unchanged on the day, though the Swiss SMI fell 1.55%, the worst showing among the majors. Asia gave back Monday's semiconductor melt-up: the Nikkei 225 lost 1.70% to 65,269.33, unwinding most of yesterday's 2.12% gain, and the Kospi slipped 0.58% after Monday's 4.61% surge.
The bond market, for once, did very little, and that is itself worth noting. The US curve settled the session with the 10-year at 4.80%, up 2 bp, the 2-year at 4.39%, also up 2 bp, and the 30-year at 5.25%, up 1 bp. So an oil spike, a tariff escalation and a record copper settlement moved US long rates by two basis points, which suggests the rates market had already priced this in during last week's selloff. Europe is where the pressure sits: the AAA 10-year is at 3.39%, near a 15-year high, ahead of Thursday's ECB decision at which consensus expects a 25 bp rise to 2.50%, and the German curve carries an added political premium after the AfD's strong showing in Saxony-Anhalt. The OAT-Bund spread widened 1.1 bp to 85.3 bp. Three central banks are being pushed the same way by the same barrel of crude: futures put roughly 65% on a Fed hike on 16 September and about 63% on a BOJ move on 18 September. Meanwhile the VIX sits at 15.30 (FRED VIXCLS, 7 September), only just into the moderate 15 to 20 band and a whisker above outright complacency, with US high yield at 265 bp and investment grade at 81 bp, both historically tight. The gap between what the rates market is pricing and what equity and credit are pricing remains the most interesting feature of this market.
Global Indices Snapshot
Americas
| Index | Level | Day Chg | Day Chg % | Source |
|---|---|---|---|---|
| S&P 500 | 7,673.52 | -45.08 | -0.58% | yfinance ^GSPC |
| Nasdaq 100 | 29,507.70 | -36.45 | -0.12% | yfinance ^NDX |
| Dow Jones | 52,786.07 | -628.13 | -1.18% | yfinance ^DJI |
| Brazil IBOV | 187,366.84 | +2,219.68 | +1.20% | yfinance ^BVSP |
Americas data reflects the 8 Sep close. Both markets were closed yesterday, so day changes are measured against the Friday 4 September close. FRED series SP500 records the same 7,673.52 close for 8 September, confirming the S&P 500 level against an independent source.
Europe
| Index | Level | Day Chg | Day Chg % | Source |
|---|---|---|---|---|
| Euro STOXX 600 | 649.60 | -0.30 | -0.05% | yfinance ^STOXX |
| CAC 40 | 8,317.98 | +11.83 | +0.14% | yfinance ^FCHI |
| DAX | 26,007.63 | +1.13 | +0.00% | yfinance ^GDAXI |
| FTSE 100 | 10,811.66 | -10.44 | -0.10% | yfinance ^FTSE |
| SMI (Swiss) | 14,057.61 | -221.79 | -1.55% | yfinance ^SSMI |
European data reflects the 8 September cash close, including the closing auction. The Euro STOXX 50 closed at 6,413.17, up 0.14%.
Asia-Pacific
| Index | Level | Day Chg | Day Chg % | Source |
|---|---|---|---|---|
| Nikkei 225 | 65,269.33 | -1,130.52 | -1.70% | yfinance ^N225 |
| Hang Seng | 25,317.18 | -95.94 | -0.38% | yfinance ^HSI |
| Shanghai Comp | 3,940.55 | +7.85 | +0.20% | yfinance 000001.SS |
| ASX 200 | 8,920.80 | -90.10 | -1.00% | yfinance ^AXJO |
| Kospi (Korea) | 6,954.52 | -40.87 | -0.58% | yfinance ^KS11 |
Asia-Pacific data reflects the 8 September close. Tokyo, Sydney and Seoul had all rolled past local midnight into 9 September by the time European markets closed, which does not indicate stale data.
Emerging Markets
| Index | Level | Day Chg % | Source |
|---|---|---|---|
| MSCI EM (EEM) | 68.83 | +0.19% | yfinance EEM |
| India Nifty 50 | 23,635.10 | -0.61% | yfinance ^NSEI |
| South Africa | 71.30 | -0.47% | yfinance EZA |
EEM and EZA are US-listed ETFs at their 8 September closes; the Nifty is the Indian close.
India is the weak spot in this table and the only major index in the briefing trading below both its 50-day and 200-day moving averages, at 23,635 against 24,201 and 24,595 respectively, and 10.4% below its record. Hang Seng and Shanghai are also below their 200-day lines. EEM's small gain is a dollar-denominated ETF effect as much as a local one, and South Africa is the day's reversal in this table, giving up a midday gain to close 0.47% lower.
Index Valuations & Investment Risk
Valuation Table
| Index | Trailing P/E (live) | Hist avg trailing P/E (†) | Premium to hist mid |
|---|---|---|---|
| S&P 500 | 24.82x | ~16-18x | +46.0% |
| Nasdaq 100 | 29.35x | ~25-30x | +6.7% |
| Euro STOXX 600 | 17.91x | ~15-17x | +11.9% |
| CAC 40 | 17.04x | ~14-16x | +13.6% |
| DAX | 18.81x | ~15-17x | +17.6% |
| FTSE 100 | 18.19x | ~13-15x | +30.0% |
| Nikkei 225 | 21.96x | ~20-22x | +4.6% |
| MSCI EM | 14.68x | ~13-15x | +4.9% |
(†) Static long-run reference constants embedded in the skill. Live trailing P/E from yfinance
trailingPE on ETF proxies (SPY, QQQ, EXSA.DE, CAC.PA, EXS1.DE, ISF.L, 1321.T, EEM). Premium is
computed against the midpoint of the historical range.
Two indices clear the 20% threshold. The S&P 500 at 24.82x against a ~17x long-run midpoint is 46% above it, past the 40% mark this framework calls historically stretched. The FTSE 100 at 18.19x is the surprise: a 30% premium to its own ~14x history, which is a large number for an index that spent a decade being described as perpetually cheap. Note that the FTSE's premium is partly an earnings-denominator story, since its heavy energy and mining weights have seen trailing profits compress, and today's oil and copper moves work in the opposite direction from here. Continental Europe is unremarkable at 12% to 18% over, the Nikkei is close to its own average, and emerging markets remain the cheapest thing in the table at 14.68x.
Investment Risk Assessment for ETF Investors
United States (S&P 500 / Nasdaq ETFs)
The S&P 500 earnings yield is 4.03% (1÷24.82). Against the 10-year Treasury at 4.80% (US Treasury par curve, 8 September), the earnings yield gap is -0.77 pp: on current income alone, the government bond pays more than the index. The Nasdaq 100 is further behind at a -1.39 pp gap. On a real basis the picture reverses, because the bond coupon is fixed while earnings grow roughly with prices: against the 10-year TIPS real yield of 2.43% (US Treasury real curve, 8 September), the gap is +1.60 pp. That 2.37 pp swing is the size of the inflation correction, and it is large enough to flip the sign, which is exactly why the nominal version should never be read on its own. Neither number forecasts anything about forward returns; both describe today's trade-off between two income streams.
The index sits 1.83% below its record of 7,816.70, above both its 50-day (7,591.71) and 200-day (7,141.77) averages, in a 52-week range of 6,316.91 to 7,816.70. The specific risk today is visible in the Dow-versus-Nasdaq dispersion: valuation support in this market is heavily concentrated in the AI capex complex, and the cyclical half is already discounting tariffs and higher rates. Rate sensitivity is the live exposure, with a Fed hike roughly a coin-flip-and-a-half at 65% for 16 September and a real yield of 2.43% already at the high end of the post-2008 era.
Europe (STOXX 600 / CAC 40 / DAX ETFs)
The STOXX 600 earnings yield is 5.59% (1÷17.91). Against the euro area AAA 10-year at 3.39% (ECB YC API, 7 September), the euro earnings yield gap is +2.20 pp, and on the constructed real yield of 1.35% it is +4.23 pp. Both are comfortably wider than the US equivalents, and Europe trades at a 28% P/E discount to the S&P 500.
That comparison needs a caveat, because part of the difference is simply the gap between US and euro-area inflation and policy paths rather than a difference in risk compensation. The real-yield version, cited above, is the check on that, and here it still favours Europe by a wide margin. The composition of the nominal rate gap is set out in the Real Yields section below, and it is mostly a real-rate story rather than an inflation one.
Geopolitical and political risk is concentrated rather than diffuse. France carries an 85.3 bp OAT-Bund spread, Germany has an AfD result in Saxony-Anhalt feeding into a Bund market already near 15-year highs, and Thursday's ECB meeting is a live hike. On currency: a euro-based investor holding EUR-quoted European funds has no FX effect on the quoted value of the holding, but real exposure remains inside the earnings, since CAC 40 and STOXX 600 constituents are multinationals earning abroad. That exposure is smaller, slower and partly hedged by foreign cost bases, not absent.
Japan (Nikkei / TOPIX ETFs)
At 21.96x the Nikkei is close to its long-run average, and today's 1.70% fall unwound most of Monday's chip-led surge, leaving the index below its 50-day average but comfortably above the 200-day. The policy risk is immediate: Governor Ueda has signalled a rise is likely at the 17-18 September meeting, market-implied probability around 63%, from a policy rate of 1.00% that is already the highest since September 1995. For a euro-based investor the currency decision is likely to matter more than the equity call, with USD/JPY at 154.09 and a hiking BOJ arguing for at least partial hedging.
Emerging Markets (MSCI EM ETFs)
At 14.68x, EM trades at a 41% discount to the S&P 500 and a 5% premium to its own long-run average, with the highest earnings yield in the table at 6.81%. China remains the dominant weight and the dominant risk: both Shanghai and Hang Seng sit below their 200-day averages, and Shanghai is 35.7% below a 2007 peak that says more about that bubble than about today. India is the near-term drag, below both moving averages.
Overall Risk Score (qualitative, not financial advice): Moderate, with a wide regional split. US large-cap sits in the high-valuation, low-margin-of-safety band, with a negative nominal earnings yield gap and a 46% premium to historical trailing P/E. Europe and emerging markets look closer to fair value on the same measures, with Europe carrying identifiable political and policy event risk this week rather than valuation risk.
Disclaimer: This is financial information, not personalised investment advice. Past valuations do not guarantee future returns. Consult a financial advisor before investing.
US Economic Indicators (FRED - authoritative)
| Indicator | Current | Prior | Delta | Reference Date | FRED Series |
|---|---|---|---|---|---|
| CPI YoY % | 3.30% | — | — | Jul 2026 | CPIAUCSL |
| Core CPI YoY % | 2.47% | — | — | Jul 2026 | CPILFESL |
| Unemployment Rate | 4.1% | — | — | Aug 2026 | UNRATE |
| Nonfarm Payrolls | +162k m/m | — | — | Aug 2026 | PAYEMS |
| 10Y TIPS Real Yield | 2.43% | — | — | 8 Sep 2026 | DFII10 |
Prior and delta columns are blank because the fetch returns the current year-on-year transformation only, not the preceding month's.
Headline CPI at 3.30% year on year (FRED CPIAUCSL, July 2026) sits well above core at 2.47% (FRED CPILFESL, July 2026), an 83 bp wedge that is almost entirely energy and is about to widen further given where crude has gone since. That is the mechanism by which today's oil move becomes tomorrow's central bank problem. The labour market is not helping the doves: unemployment at 4.1% (FRED UNRATE, August 2026) with 162,000 jobs added in August (FRED PAYEMS) is the strong print that markets have been referencing since Friday. The 10-year TIPS real yield at 2.43% is sourced from the US Treasury real curve, not FRED's DFII10 publication, and is the settled value for 8 September, unchanged from 4 September.
Other economic releases today: the NFIB small business optimism index for August, published on 8 September, fell 1.1 points to 98.7, holding just above its 52-year average of 98.0. The uncertainty index fell 2 points to 89, the net share of owners expecting the economy to improve dropped 5 points to 10%, and reported earnings trends deteriorated 3 points to -19%. It is a second-tier release and did not move the market, but it is the softest small-business read of the summer. Otherwise the day's scheduled event was policy rather than statistics: Canadian counter-tariffs of 15% to 50% took effect across more than 700 US product lines covering roughly C$27.6bn of imports, concentrated in steel (doubled to 50%), dairy, appliances, agricultural equipment, pulp and paper, and electronics.
Fixed Income & Bond Analysis
Policy Rates
| Central Bank | Rate | Source |
|---|---|---|
| Fed Funds (upper) | 3.75% | FRED DFEDTARU |
| Fed Funds (lower) | 3.50% | FRED DFEDTARL |
| Effective FFR | 3.63% | FRED DFF |
| ECB Deposit Rate | 2.25% | FRED ECBDFR |
| BOJ Policy Rate | 1.00% | web search (TradingEconomics) |
| BOE Bank Rate | ~3.73% | FRED IUDSOIA (SONIA proxy, 4 Sep 2026) |
Government Bond Yields
| Country | 2Y Yield | 10Y Yield | 30Y Yield | Day Chg (10Y) | Source |
|---|---|---|---|---|---|
| USA | 4.39% | 4.80% | 5.25% | +2.0 bp | US Treasury par curve (8 Sep 2026) |
| Germany | 2.91% | 3.39% | 3.78% | — | ECB YC API AAA curve (7 Sep 2026) |
| France | — | 4.24% | — | — | web (8 Sep 2026) |
| UK | 4.53% | 5.15% | — | — | web (2Y 4 Sep, 10Y 7 Sep) |
| Japan | — | 2.90% | — | -4 bp | web (8 Sep 2026) |
| Italy | — | (not retrieved) | — | — | web |
The USA row is the US Treasury par curve, all three maturities and the day change sharing 8 September, computed against the 4 September session (10-year 4.78%). This is settled data for the session being reported, so it agrees with the two basis point move described above. The German row uses the ECB AAA curve rather than a Bund quote, which is a close proxy and is dated 7 September; a web-sourced Bund quote for 8 September puts the 10-year at 3.39%, the same figure to two decimals. Italy's 10-year and the 30-year points for Germany, France, the UK and Japan could not be retrieved.
The UK remains the outlier: a 10-year gilt at 5.15% is 35 bp above the equivalent Treasury, which is a striking place for a G7 sovereign to trade, and it is near a 19-year high. Japan at 2.90%, down 4 bp today, is the only major market where yields fell.
Yield Curve Spreads:
- 10Y-2Y spread: +41 bp (US Treasury par curve, 8 September): positively sloped, but well short of the ~75 bp that would count as historically steep. The curve normalised out of inversion and has stalled in a moderate positive slope.
- 10Y-3M spread: +86 bp (US Treasury par curve, 8 September): clearly positive, no recession signal from this indicator.
The shape is telling a coherent story: the front end is anchored by a Fed that markets think is more likely to hike than cut, while the long end carries the energy and fiscal premium. Note that the 3-month bill at 3.94% sits 31.5 bp above the Fed funds target midpoint of 3.625%, more than the usual few basis points. That is the hike probability showing up directly in the bill.
OAT-Bund Spread: 85.3 bp (8 September), 1.1 bp wider on the day, with the French 10-year OAT at 4.24% against a 3.39% Bund. The spread has been elevated for months on French fiscal and political risk and is not reacting to this week's events specifically.
Yield Curve Charts
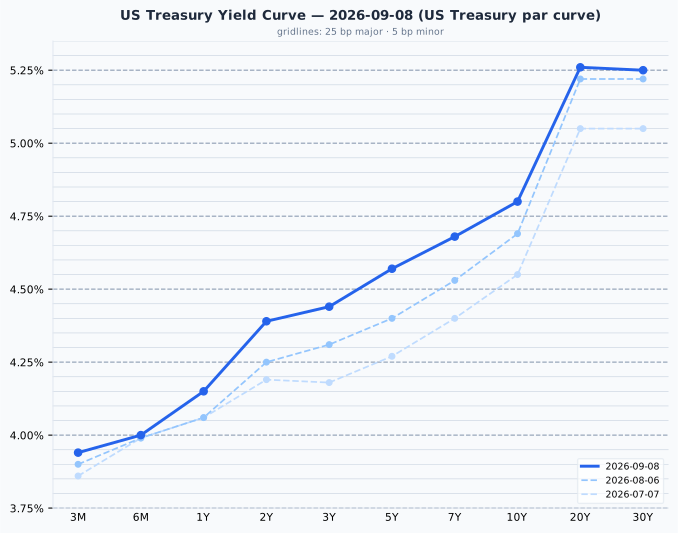
The US curve is positively sloped throughout with a pronounced steepening between 10 and 20 years, from 4.80% to 5.26%, and a marginal inversion at the very long end where the 30-year at 5.25% sits 1 bp below the 20-year. Against a month ago the whole curve has shifted up, and unevenly: the 3-month has added 4 bp to 3.94% while the 2-year has added 14 bp and the 10-year 11 bp, a bear flattening of the belly that is consistent with the market pricing a nearer-term hike without changing its terminal view much.
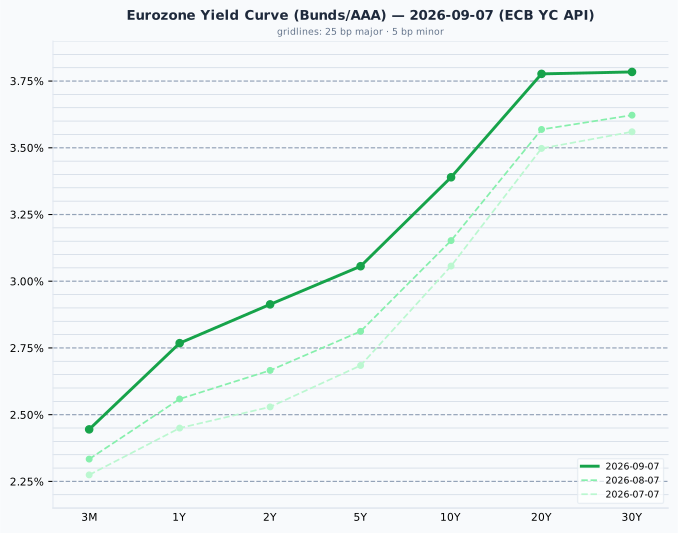
The euro AAA curve is positively sloped and much steeper in relative terms than the US one, running from 2.44% at 3 months to 3.39% at 10 years and flattening to 3.78% at the long end. The shift since early August is larger than the US move at every point: the 10-year has added 24 bp, the 2-year 25 bp and the 3-month 11 bp, a parallel repricing of the entire euro curve ahead of Thursday's ECB decision. Over two months the 10-year is up 33 bp.
Credit Markets (from FRED - authoritative)
| Market | OAS Spread | Series ID |
|---|---|---|
| US Investment Grade | 81 bp | BAMLC0A0CM |
| US High Yield | 265 bp | BAMLH0A0HYM2 |
| Euro High Yield | 265 bp | BAMLHE00EHYIOAS |
All three observations are dated 3 September 2026. US investment grade at 81 bp sits at the very tight end of its 80-150 bp normal range, and US high yield at 265 bp is inside the 300-500 bp normal band, which is historically tight rather than merely comfortable. Euro high yield at the same 265 bp is unusual: European credit does not often trade level with US high yield, and it points to a European market with a shorter duration and higher quality mix being bid alongside a US market that is simply expensive. Credit is not corroborating any of the risk being priced in rates.
Real Yields (US and Euro Area)
| Region | Nominal 10Y | Expected inflation | Real 10Y | How the real yield is obtained |
|---|---|---|---|---|
| United States | 4.80% | 2.37% (residual) | 2.43% | Measured. TIPS trade, so the market quotes a real yield directly; expected inflation is the residual, the breakeven |
| Euro area | 3.39% | 2.04% (measured) | 1.35% (residual) | Constructed. No euro inflation-linked benchmark is published, so the ECB SPF survey expectation is subtracted from the nominal yield |
The two rows are built in opposite directions, and only the US real yield is a price anyone actually trades. The euro figure is the softer of the two: it subtracts a survey number (ECB Survey of Professional Forecasters, 2026 Q3, 2.037%) from a fitted curve point. Two mismatches follow when comparing them. The US breakeven carries an inflation risk premium that a survey does not, and the SPF horizon is 5 calendar years ahead against the bond's 10.
Decomposing the 141 bp nominal gap between the two 10-year yields: only 33 bp is expected inflation (2.37% against 2.04%) and 108 bp is real (2.43% against 1.35%). This is overwhelmingly a real-rate story, not an inflation story, which is the same conclusion as a month ago but with the inflation component having roughly doubled from 18 bp as US energy pass-through builds.
A note on the US-euro real rate gap
The US real yield has exceeded the euro one in every quarter since 2014. It is a structural feature reflecting higher US trend growth, euro-area excess savings, Bund scarcity and US fiscal supply, and it is not a trade a euro-based reader can capture. Hedging the currency cancels it almost exactly, because the forward rate is set to remove the interest differential; unhedged, it is a currency bet rather than a bond decision. A real yield is real in its own currency, so 2.43% means 2.43% above US inflation, which is not a real return for someone who spends euros. The gap is stated here as a macro fact about relative policy stance and growth expectations, and no portfolio conclusion is drawn from it.
Bond Portfolio Implications
On current income alone, US government bonds beat US equities: the S&P 500 earnings yield of 4.03% (1÷24.82) is 77 bp below the 10-year at 4.80%. In Europe the reverse holds by a wide margin, with a STOXX 600 earnings yield of 5.59% (1÷17.91) standing 220 bp above the AAA 10-year at 3.39%. Two structural biases attach to both figures. First, they ignore growth: a bond coupon is fixed for a decade while the earnings behind an equity yield grow roughly with prices, so the gap understates equities by approximately expected inflation, and the real-yield versions above (+1.60 pp US, +4.23 pp euro) are the cleaner statement. Second, an equity holder does not receive the full earnings yield in cash; only the dividend and buyback portion arrives, and the rest is retained. Neither figure is a forecast of relative returns.
Duration is the question of the week. If yields rise 100 bp, a 10-year bond loses roughly 8% to 9% of its price, and there are three central bank meetings inside eleven days (ECB Thursday, Fed on the 16th, BOJ on the 18th) with hike probabilities of high conviction, 65% and 63% respectively. That argues for keeping duration short of benchmark into the meetings, particularly in euros where the entire curve has repriced 25 bp higher in a month and Thursday's decision is not yet fully in the price. The counter-argument is that at 4.80% and 5.25%, the US 10-year and 30-year already offer a real yield of 2.43%, which is a genuinely attractive starting point for a buyer whose horizon is longer than the next three meetings.
Currencies & Commodities
Currencies:
| Pair | Rate | Source |
|---|---|---|
| EUR/USD | 1.1598 ‡ | FRED DEXUSEU |
| USD Index | 118.75 ‡ | FRED DTWEXBGS |
| USD/JPY | 154.09 | web search |
| GBP/USD | 1.3545 | web search |
| USD/CHF | 0.8093 | web search |
‡ Both FRED series carry an observation date of 28 August 2026, eleven days stale. FRED's weekly-lagging publication schedule is the cause, not a fetch failure. Treat the euro and dollar index levels as a reference point rather than today's rate.
USD/JPY at 154.09 is down 0.16% on the day, holding a level that a hiking BOJ has so far failed to move, and it remains the main hedging consideration for any euro-based holder of Japanese equity. Sterling at 1.3545 is essentially unchanged despite gilts at 19-year highs.
Commodities:
| Commodity | Price | Day Chg % | Ticker | Source |
|---|---|---|---|---|
| Brent Crude | $97.92 | +1.70% | BZ=F | yfinance |
| WTI Crude | $93.03 | +1.69% | CL=F | yfinance |
| Gold ($/oz) | $4,439.00 | -0.84% | GC=F | yfinance |
| Silver ($/oz) | $67.00 | +0.38% | SI=F | yfinance |
| Copper ($/lb) | $6.8235 | +2.11% | HG=F | yfinance |
| Nat Gas ($/MMBtu) | $2.916 | -1.98% | NG=F | yfinance |
Prices are the 8 September exchange settlements, and day changes are settlement to settlement against the prior session's settlement on 4 September, Friday being the prior reference because Monday was a US holiday. These are the figures the wires print for a completed session. All six contracts are comfortably clear of expiry, the nearest being October WTI on 22 September, and none has rolled, so no roll distortion is present.
Copper is the day's outlier and set a record settlement, with the COMEX front month settling at $6.8235/lb, 1.09% above its previous record close of $6.75 set on 26 August. It traded higher still during the session, but the settlement is the figure that stands as the record. The LME benchmark set a matching record at $14,533 a tonne. The move is a tariff scramble layered on top of a genuine supply deficit, and it is one of the few commodity records in this table that reflects present-day market structure rather than a distant peak.
Gold is 20.5% below its all-time high of $5,586.20, set on 29 January 2026, settling at $4,439.00 and down 0.84% on the day. Silver is 44.8% below its all-time high of $121.30, also set on 29 January 2026, settling at $67.00 and up 0.38%. Both records are inside the last twelve months and coincide with their 52-week highs, so these are real drawdowns from a recent peak rather than arithmetic against ancient history. That precious metals are this far below January while copper prints a record is the sharpest divergence in the commodity complex: the industrial metal is trading the physical shortage, the monetary metals unwound a speculative peak and have not recovered it.
Crude is best read through its 52-week range. Brent at $97.92 sits in a band of $58.72 to $126.10 and WTI at $93.03 in one of $54.98 to $119.48, both in the upper half after a fortnight in which Brent has gained sharply on Middle East supply risk. Natural gas is the mirror image, down 1.98% to $2.916 against a 52-week range of $2.483 to $7.827, close to the bottom of it, which is a reminder that the energy shock is a crude and geopolitics story rather than a broad energy one.
Crypto: no notable moves retrieved.
Sector & Theme Highlights
Best performing: industrial metals and miners, on copper's record; energy, on the crude move; US semiconductors and AI infrastructure, with Qualcomm up 8% on the Amazon custom-silicon deal, Intel up 5% and Oracle up 5%. Brazil's 1.20% gain is a commodity-complex trade in equity form.
Worst performing: Swiss large-cap defensives (SMI -1.55%), the most rate-sensitive part of the European market; US cyclicals and tariff-exposed industrials, visible in the Dow's 1.18% fall; Japanese chipmakers unwinding Monday's surge; natural gas producers.
Cross-market themes. The dominant one is the AI capex complex as a rate-insensitive asset class. On a day when oil rose, tariffs escalated and the Dow fell 1.18%, the Nasdaq 100 lost only 0.12%. That decoupling has held for weeks and is either evidence of genuinely secular demand or of an increasingly narrow market, and today does not settle which. The second is the electrification supply squeeze, of which copper's record is the purest expression: data centre, grid and renewables demand against an ageing mine fleet, now with a tariff premium layered on top. The third is trade fragmentation as a persistent inflation input rather than a one-off shock, with the Canada round taking effect today. The fourth is the great central bank turn, with the Fed, the ECB and the BOJ all being pushed toward tightening by the same energy shock inside a two-week window, which is a genuinely unusual synchronisation.
Top Stories (Global)
- Saudi energy facilities halted after Houthi attacks; Iran signals pre-emptive action. Brent settled at $97.92 and WTI at $93.03, with Goldman Sachs raising targets on both benchmarks. This is the second weekend in a row that Middle East supply risk has repriced crude.
- Copper hit an all-time high. LME three-month futures reached $14,533 a tonne, beating January's record, and the COMEX front month settled at $6.8235/lb, above its own record close. Up roughly 17% over the year on a structural mismatch between mine supply and data centre, grid and renewables demand.
- Canadian counter-tariffs took effect. Duties of 15% to 50% on more than 700 US product lines covering roughly C$27.6bn of imports, retaliating for Washington's 50% levy on about $20bn of Canadian goods after talks collapsed. Steel doubled to 50%; dairy, appliances, agricultural equipment, pulp and paper and electronics also hit.
- Qualcomm gained about 8% on a multi-generational collaboration with Amazon for custom AI data centre chips, the largest single-stock move behind the Nasdaq 100's near-flat close. Intel rose about 5% on reported price increases and Oracle about 5% ahead of its earnings on Thursday.
- Bund yields sit near a 15-year high into Thursday's ECB decision, with the AfD's strong showing in Saxony-Anhalt adding a political premium. The OAT-Bund spread widened 1.1 bp to 85.3 bp, with the French 10-year at 4.24%.
- BOJ Governor Ueda signalled a rise is likely at the 17-18 September meeting. Market-implied probability is around 63%, from a policy rate of 1.00% that is already the highest since September 1995. Japan was the only major bond market to rally today, the 10-year down 4 bp to 2.90%.
- Asia unwound Monday's semiconductor melt-up. The Nikkei fell 1.70% and the Kospi 0.58%, giving back most of gains of 2.12% and 4.61% respectively booked while Wall Street was shut.
Looking Ahead
Central banks - Thursday 10 September: ECB decision. Consensus expects a 25 bp rise in the deposit rate to 2.50%, the first move of this cycle. The euro curve has already repriced 25 bp higher over a month, but the decision is not fully in the price and the press conference guidance matters more than the move. - Wednesday 16 September: FOMC. Futures imply roughly 65% for a 25 bp hike, supported by August payrolls of +162,000, unemployment at 4.1% and headline CPI at 3.30%. - Thursday 17 to Friday 18 September: BOJ. About 63% priced for 25 bp, with Governor Ueda having signalled the direction on 2 September.
Economic releases - Friday 11 September: US CPI for August, the key print before the FOMC, carrying the first substantial energy pass-through from the crude move. Consensus is +0.4% m/m and 3.4% y/y headline, with core at +0.2% m/m and 2.4% y/y. Watch the wedge between headline at 3.30% and core at 2.47%. - Euro area final HICP follows the ECB decision, with August having accelerated to 3.3%.
Earnings - Thursday 10 September: Oracle reports first-quarter fiscal 2027 results after the US close, the same day as the ECB. Consensus is around $19.1bn of revenue and $1.30 of EPS. The stock rose about 5% on 8 September ahead of it, and the read-across to AI infrastructure spending is the reason the whole complex is watching.
Geopolitical - Middle East supply risk is the dominant variable for crude, with Saudi facility outages and Iran-US exchanges both live. - The US-Canada tariff round is now in effect, and the question is whether it broadens further. - German politics after the Saxony-Anhalt result, and French fiscal risk, both feed the European rate story.
Market closures - No closures in the next five trading days across the US, UK, Germany, France, Japan, Australia, Switzerland, Canada, Korea or Brazil. - Looking slightly further out: Japan 21 September (Respect for the Aged Day) and 23 September (Autumnal Equinox Day); Canada 30 September (National Day for Truth and Reconciliation); Korea 24 to 26 September (Chuseok). Note that the Japanese closure on 21 September falls three days after the BOJ decision.