2026 08 20
Global Financial Briefing — Thursday, 20 August 2026
Americas index levels, commodities, US Treasury yields and day changes reflect the 20 August closing print. Euro area bond rows, FX, credit, VIX and macro figures are dated inline.
Market Overview
Today was the day the market decided that the US Treasury cannot buy its way out of a term-premium problem. Wednesday's surprise announcement — a doubling of long-dated buyback operations to $4bn or more per issue from September — produced exactly the relief rally it was designed to produce: the settled par curve fell 6 bp at the 10-year to 4.65% and 9 bp at the 30-year to 5.19% on 19 August (US Treasury par curve), and Asia opened this morning treating it as an all-clear. By the time New York was trading, the trade had unwound. Thursday's settled curve put the 10-year at 4.69%, +4.0 bp on the day, and the 30-year at 5.23%, also +4.0 bp (US Treasury par curve, 20 August) — retracing two-thirds of Wednesday's rally at the 10-year and under half of it at the 30-year. Treasury Secretary Bessent spent the session saying the buybacks could get bigger still; the bond market's answer was that a buyback changes the maturity mix of the debt, not its quantity, and the recent push of the 30-year to its highest level since 2007 was never about liquidity.
Two things then made the inflation side of the argument worse rather than better. President Trump threatened what he called an "economic D-Day" of sanctions against Iran, and crude went with it: Brent settled at $93.78/bbl and WTI at $86.83, +2.9% on the day. And Walmart, having beaten on earnings, fell more than 9% because US same-store sales grew 2.6% against a 3.7% forecast, with management attributing the shortfall to customers making "trade-offs" in the face of high fuel prices. That is an unusually clean illustration of the loop the long end is worried about — energy costs feeding inflation, inflation squeezing the consumer, and neither of those being fixed by the Treasury's issuance calendar. US indices closed lower across the board, and the selling accelerated into the bell: the Dow ended −1.32%, its worst day since 29 July, against the −0.99% it was showing mid-afternoon, dragged by the consumer complex.
The geographic split is stark and it is a matter of timing rather than disagreement. Asia traded the buyback headline and closed before the reversal: the Kospi surged 5.89% — its mirror image of Wednesday's 5.8% collapse — on SK Hynix's ₩40tn buyback-and-cancellation announcement, with SK Hynix +14.1% and Samsung Electronics +9.7%, and the Nikkei added 1.36%. Europe closed marginally lower and largely sideways. Only the Americas were still open when the reversal came, and they took the full force of it. The other European story is sovereign: France's 10-year OAT is above 4.10%, the highest since October 2008, and at 4.13% it is now yielding more than Italy's BTP at 4.07% — an inversion of the historic ordering that says more about a French debt stock near 118% of GDP than about any improvement in Rome. UK 10-year gilts are above 5.0% on the same oil-inflation logic. The long end is under pressure in every major jurisdiction simultaneously, which is the tell that this is a global term-premium repricing and not a domestic funding story anywhere.
Global Indices Snapshot
Americas
| Index | Level | Day Chg | Day Chg % | Source |
|---|---|---|---|---|
| S&P 500 | 7,641.16 | −66.82 | −0.87% | yfinance ^GSPC |
| Nasdaq 100 | 29,213.16 | −212.86 | −0.72% | yfinance ^NDX |
| Dow Jones | 52,759.21 | −703.84 | −1.32% | yfinance ^DJI |
| Brazil IBOV | 167,927.16 | +96.89 | +0.06% | yfinance ^BVSP |
Americas data reflects the 20 Aug close.
Cross-check: FRED SP500 for 20 August prints 7,641.16, matching the ^GSPC close to the cent.
Note Brazil reversed late: the IBOV was −0.24% mid-afternoon and settled
+0.06%, the only Americas index to finish higher.
Europe
| Index | Level | Day Chg | Day Chg % | Source |
|---|---|---|---|---|
| Euro STOXX 600 | 650.35 | −0.81 | −0.12% | yfinance ^STOXX |
| Euro STOXX 50 | 6,422.06 | −22.40 | −0.35% | yfinance ^STOXX50E |
| CAC 40 | 8,453.09 | −48.82 | −0.57% | yfinance ^FCHI |
| DAX | 25,983.04 | −108.29 | −0.42% | yfinance ^GDAXI |
| FTSE 100 | 10,748.16 | +4.81 | +0.04% | yfinance ^FTSE |
| SMI (Swiss) | 14,368.16 | −18.42 | −0.13% | yfinance ^SSMI |
European data reflects today's close (20 Aug).
Asia-Pacific
| Index | Level | Day Chg | Day Chg % | Source |
|---|---|---|---|---|
| Nikkei 225 | 66,216.79 | +890.37 | +1.36% | yfinance ^N225 |
| Hang Seng | 25,698.49 | +203.42 | +0.80% | yfinance ^HSI |
| Shanghai Comp | 3,903.72 | +9.30 | +0.24% | yfinance 000001.SS |
| ASX 200 | 9,083.80 | +30.00 | +0.33% | yfinance ^AXJO |
| Kospi (Korea) | 6,852.58 | +381.41 | +5.89% | yfinance ^KS11 |
Asia-Pacific data reflects today's close (20 Aug).
The Kospi's +5.89% was cross-checked against the price history (19 Aug close 6,471.17) and corroborated by press reports. Its 52-week low field returned 0.0 — a data error — and has been omitted.
Emerging Markets
| Index | Level | Day Chg % | Source |
|---|---|---|---|
| MSCI EM (EEM) | 66.62 | +0.77% | yfinance EEM |
| India Nifty 50 | 24,231.85 | +0.64% | yfinance ^NSEI |
| South Africa | 70.47 | +0.26% | yfinance EZA |
EEM and EZA are US-listed ETFs and reflect the 20 Aug close; the Nifty reflects the same day's Indian close. EZA also reversed into the close, from −0.13% intraday to +0.26%.
Trend position. The S&P 500 remains above both its 50-day (7,532.90) and 200-day (7,091.61) averages; the Nasdaq 100 has slipped just below its 50-day (29,308.88). Asia is weaker beneath the day's bounce — the Nikkei (ma50 67,305.72) and Kospi (ma50 7,362.18) are both below their 50-day averages despite today's gains, the Kospi some 27% below its 52-week high of 9,385.59. The Hang Seng at 25,698.49 is sitting almost exactly on its 200-day (25,704.74), and Shanghai is below both. Brazil is below both its averages and 16% off its 52-week high. No major index is close enough to its record to warrant record-high language.
Index Valuations & Investment Risk
Valuation Table
| Index | Trailing P/E (live) | Hist avg trailing P/E (†) | Premium/discount |
|---|---|---|---|
| S&P 500 | 25.76x | ~16-18x | +51.5% |
| Nasdaq 100 | 30.39x | ~25-30x | +10.5% |
| Euro STOXX 600 | 17.92x | ~15-17x | +12.0% |
| CAC 40 | 17.33x | ~14-16x | +15.6% |
| DAX | 18.80x | ~15-17x | +17.5% |
| FTSE 100 | 18.05x | ~13-15x | +28.9% |
| Nikkei 225 | 22.30x | ~20-22x | +6.2% |
| MSCI EM | 17.23x | ~13-15x | +23.1% |
(†) Hist avg trailing P/E: static long-run reference constants — the only
non-live figures in this briefing. Live trailing P/E from yfinance trailingPE on ETF proxies
(SPY, QQQ, EXSA.DE, CAC.PA, EXS1.DE, ISF.L, 1321.T, EEM). Premium computed against the midpoint
of the historical range; bolded where above +20%.
The S&P 500 at 25.8x trailing is 51.5% above its long-run midpoint — past the 40% threshold that counts as historically stretched, and the standout on this table by a wide margin. Note the Nasdaq 100 is not the outlier here: at 30.4x it is only 10.5% above its own (much higher) historical range. The expensive part of the US market on this measure is the broad index, not the tech concentration within it. The FTSE 100 at 18.05x is the more surprising entry — nearly 29% above a historical range built on an index long treated as structurally cheap.
Investment Risk Assessment for ETF Investors
United States (S&P 500 / Nasdaq ETFs). Earnings yield is (1÷25.76) = 3.88% against a 10-year Treasury at 4.69% (US Treasury par curve, 20 Aug), so the earnings yield gap is −0.81 pp: on the day's closing prices the government bond pays more current yield than the index does. Against the real yield the picture inverts — 3.88% − 2.35% (DFII10, US Treasury real curve, 20 Aug) = +1.53 pp — and the size of that correction, 2.34 pp, is the point worth taking away: the entire sign of the comparison depends on whether you charge equities for inflation that their earnings will partly grow through. Neither number forecasts anything about which asset wins from here. Real yields at 2.35% remain the harder constraint on the multiple: at 25.8x trailing the index is discounting future earnings against a real risk-free rate that has been at or above 2% for most of the past two years, and the day's move back up in the long end is a direct headwind to that multiple. The Walmart reaction is a reminder that the earnings side is not immune either.
Europe (STOXX 600 / CAC 40 / DAX ETFs). STOXX 600 earnings yield is (1÷17.92) = 5.58% against a euro AAA 10-year of 3.28% (ECB YC API, 19 Aug), a euro earnings yield gap of +2.30 pp; on the real-yield basis, 5.58% − 1.24% = +4.34 pp. Both are far wider than the US equivalents, but part of that difference is simply the gap between US and euro-area inflation and policy paths rather than a difference in risk compensation — see the decomposition in Real Yields below, which finds the split is mostly real rather than inflationary today. European valuations remain the more comfortable starting point in absolute terms (17-19x against 25.8x), and the CAC 40 at 8,453 is sitting right on its 50-day average. The specific European risk on show today is sovereign rather than corporate: OAT yields at an 18-year high with French debt near 118% of GDP, and OATs now trading wide of BTPs. A EUR-based investor holding EUR-quoted European funds has no FX effect on the quoted value of the holding, but real currency exposure remains inside the earnings — CAC 40 and STOXX 600 constituents are multinationals with large foreign revenue.
Japan (Nikkei / TOPIX ETFs). 22.30x trailing, only 6.2% above its historical range — the cheapest entry on this table relative to its own history. The active risk is policy: the BOJ is at 1.00% having hiked in June (highest since 1995) and held on 31 July with one dissent for 1.25%, while warning that core inflation will run clearly above 2% from the second half of the fiscal year. The 10-year JGB touched 2.95% earlier this week, a level last seen in the 1990s. With USD/JPY at 159.26, an unhedged euro or dollar investor is carrying a yen that is both weak and exposed to a hawkish repricing — the hedge decision here is as consequential as the equity call.
Emerging Markets (MSCI EM ETFs). At 17.23x, EM's traditional valuation discount to developed markets has largely closed against its own history (+23.1%), though it still sits well below the S&P 500. The +0.77% close understates the internal dispersion: Korea +5.89% on a single company's buyback, China roughly flat and below both moving averages. The Korea weighting means EM index returns are increasingly a memory-semiconductor trade.
Overall Risk Score: High valuation risk in the US, moderate in Europe and Japan. The US combination — 25.8x trailing, a negative nominal earnings yield gap, real yields at 2.35% and a long end selling off — offers little margin of safety. Europe and Japan are nearer fair value on their own histories but carry live sovereign and policy risks respectively. EM is no longer the clear relative-value case it was.
Disclaimer: This is financial information, not personalised investment advice. Past valuations do not guarantee future returns. Consult a financial advisor before investing.
US Economic Indicators (FRED — authoritative)
| Indicator | Current | Prior | Delta | Reference Date | FRED Series |
|---|---|---|---|---|---|
| CPI YoY % | 3.30% | 3.46% | −0.16pp | Jul 2026 | CPIAUCSL |
| Core CPI YoY % | 2.47% | 2.57% | −0.10pp | Jul 2026 | CPILFESL |
| Unemployment Rate | 4.1% | 4.2% | −0.1pp | Jul 2026 | UNRATE |
| Nonfarm Payrolls | −23k | +20k | −43k | Jul 2026 (m/m) | PAYEMS |
| 10Y TIPS Real Yield | 2.35% | 2.35% | 0bp | 20 Aug 2026 | DFII10 * |
* DFII10 is overlaid from the US Treasury real curve (sources: treasury_real), one business day
ahead of FRED's own series. All other rows are FRED.
Note: FRED macro data is monthly and lags 4-6 weeks. The July print is a genuinely odd pairing — headline and core inflation both decelerated, but payrolls contracted by 23k after a +20k June, while the unemployment rate still fell to 4.1%. A falling jobless rate alongside negative payrolls usually means the labour force is shrinking rather than the labour market tightening, and it sits awkwardly against a bond market currently pricing more tightening, not less.
Other releases today: US initial jobless claims for the week ending 15 August came in at 206,000, down 6,000 and below the 210,000 consensus — a stable-labour-market print that argues against reading too much into the negative July payroll figure. The week's flash PMIs for the US, euro area, Germany, France, UK and Japan land tomorrow.
Fixed Income & Bond Analysis
Policy Rates
| Central Bank | Rate | Source |
|---|---|---|
| Fed Funds (upper) | 3.75% | FRED DFEDTARU (20 Aug) |
| Fed Funds (lower) | 3.50% | FRED DFEDTARL (20 Aug) |
| Effective FFR | 3.63% | FRED DFF (18 Aug) |
| ECB Deposit Rate | 2.25% | FRED ECBDFR (20 Aug) |
| BOJ Policy Rate | 1.00% | web search (held 31 Jul, 8-1) |
| BOE Bank Rate | ~3.73% | FRED IUDSOIA (SONIA proxy, 18 Aug) |
Government Bond Yields
| Country | 2Y Yield | 10Y Yield | 30Y Yield | Day Chg (10Y) | Source |
|---|---|---|---|---|---|
| USA | 4.19% | 4.69% | 5.23% | +4.0 bp | US Treasury par curve (20 Aug, vs 19 Aug) |
| Germany | 2.78% | 3.28% | 3.71% | — | ECB AAA euro area curve (19 Aug) |
| France | 3.04% | 4.13% | 4.91% | higher | web (Trading Economics, 20 Aug) |
| UK | 4.38% | 5.07% | 5.81% | higher | web (Trading Economics, 20 Aug) |
| Japan | 1.68% | 2.85% | 4.01% | −4.4 bp | web (Trading Economics, 20 Aug) |
| Italy | 3.05% | 4.07% | 4.88% | ~unchanged | web (Trading Economics, 20 Aug) |
The USA row is settled data for 20 August throughout — the session's own close, revised in from the following day's Treasury publication, so it now shows the selloff rather than lagging it. The Germany row is the ECB's fitted AAA euro-area curve rather than Bunds specifically; the live Bund 10-year was quoted around 3.26% today, consistent with it. France, UK, Italy and Japan day changes are directional only — Trading Economics gave precise session deltas for Japan alone, so no basis-point figure is invented for the others.
Yield Curve Spreads (US Treasury par curve, 20 Aug, recomputed from the levels above):
- 10Y-2Y spread: +50 bps — positively sloped, neither inverted nor steep. Wednesday's buyback-driven bull flattening to +46 bp partly reversed on Thursday: the 2-year held at 4.19% for a third consecutive session while the 10-year backed up 4 bp, re-steepening the curve toward the +52 bp it showed on Tuesday.
- 10Y-3M spread: +82 bps — comfortably positive, back up from Wednesday's +79 bp. No recession signal from either measure. Both spreads normalised out of inversion some time ago; the current shape says the market expects policy to stay roughly where it is at the front while demanding more term premium further out.
Note the 3-month bill at 3.87% sits 24.5 bp above the Fed Funds target midpoint of 3.625%. That is within tolerance but at the top of it, and it points the same way as the rest of the curve: bills are pricing a non-trivial chance the next Fed move is a hike.
OAT-Bund Spread: approximately 85 bps (OAT 4.13% vs Bund ~3.26%, 20 Aug). The more informative number today is the France-Italy relationship: at 4.13% versus 4.07%, French debt now costs more to service than Italian debt at the 10-year point. The BTP-Bund spread is roughly 81 bp. Whatever premium the market once attached to Italian fiscal risk it is now attaching, and then some, to French.
Yield Curve Charts
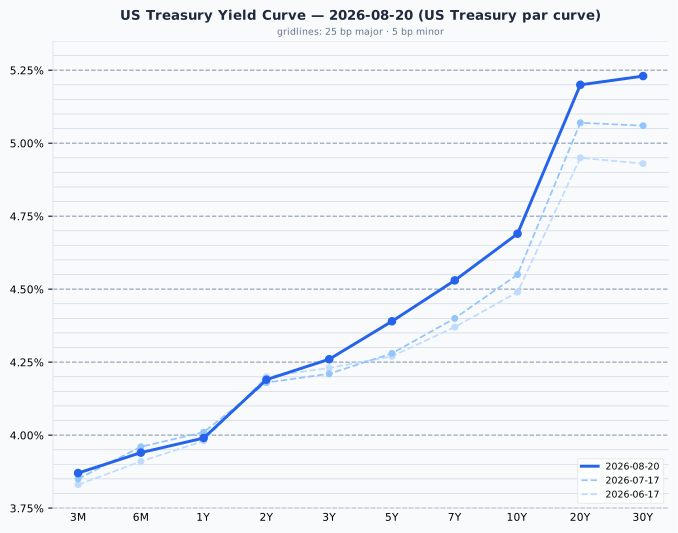
The US curve is upward-sloping throughout with the steepest segment beyond 10 years — the 10s30s gap alone is 54 bp, against 50 bp for the entire 2s10s. Since the 21 July curve the whole structure has shifted up and steepened at the back: the 3-month is essentially unchanged (+2 bp) while the 10-year is 14 bp higher and the 20- and 30-year points are 13 and 17 bp higher. This is term premium being rebuilt at the long end, not a repricing of policy.
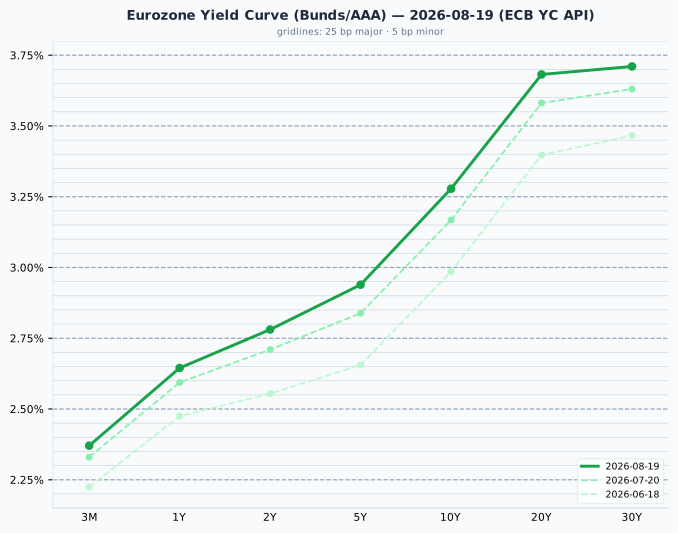
The euro AAA curve is smoothly upward-sloping from 2.37% at 3 months to 3.71% at 30 years, with none of the US curve's back-end kink. It too has shifted up since 20 July — roughly 4 bp at the front and 11 bp at the 10-year — and up substantially more since June (+29 bp at the 10-year), so the same global long-end pressure is present, simply from a much lower base and without the supply overhang.
Credit Markets (from FRED — authoritative, 19 Aug 2026)
| Market | OAS Spread | Series ID |
|---|---|---|
| US Investment Grade | 81 bps | BAMLC0A0CM |
| US High Yield | 273 bps | BAMLH0A0HYM2 |
| Euro High Yield | 255 bps | BAMLHE00EHYIOAS |
All three are historically tight. US IG at 81 bp is at the very floor of its 80-150 bp normal range; US HY at 273 bp is below the 300-500 bp normal band entirely, and Euro HY tighter still at 255 bp. Each narrowed a basis point or two from Wednesday. This is the most striking divergence in the briefing: credit is pricing no stress whatsoever while the sovereign long end sells off in every major market and equities give ground. Tight spreads of this order leave essentially no cushion — a credit investor is being paid very little to be wrong, and spread markets have historically been the last to acknowledge a rates-driven repricing rather than the first.
Equity volatility tells the same story. The VIX closed at 14.89 on 19 August (FRED VIXCLS), down from 15.84 the day before and back below the 15 threshold that marks a low, complacent reading. Between a VIX under 15, IG at the floor of its normal range and HY through the bottom of its band, three separate risk markets are simultaneously priced for nothing much to happen — while the long end of four sovereign curves is doing the opposite. That gap between the risk markets and the rates market is the thing to keep watching.
Real Yields (US and Euro Area)
| Region | Nominal 10Y | Expected inflation | Real 10Y | How the real yield is obtained |
|---|---|---|---|---|
| United States | 4.69% | 2.34% (residual) | 2.35% | Measured. TIPS trade, so the market quotes a real yield directly; expected inflation is the residual (the breakeven) |
| Euro area | 3.28% | 2.04% (measured) | 1.24% | Constructed. No euro inflation-linked benchmark is published, so the ECB SPF long-term HICP expectation (2026 Q3) is subtracted from the nominal yield |
These two rows are built in opposite directions and only one of them is a traded price. DFII10 is what TIPS actually change hands at, with inflation expectations inferred from it; the euro figure takes a survey of forecasters and subtracts it from a nominal yield, so nobody trades 1.24%. Treat the euro number as the softer of the two. Two mismatches follow from the construction: the US breakeven carries an inflation risk premium that a survey by definition does not, and the SPF horizon is five years against the bond's ten.
Decomposing the 141 bp nominal gap (4.69% − 3.28%): only 30 bp is a difference in expected inflation (2.34% vs 2.04%), while 111 bp is a difference in real rates (2.35% vs 1.24%). This is overwhelmingly a real-rate story, not an inflation story — recomputed today rather than assumed, and pointing the same way as the 7 August reading (148 bp nominal = 18 bp inflation + 130 bp real), though the real component has narrowed by ~19 bp since.
⚠️ The US-euro real rate gap is not an investment opportunity
The US real yield has exceeded the euro one in every quarter since 2014. It is a structural feature — higher US trend growth, euro-area excess savings, Bund scarcity, US fiscal supply — and not something a EUR-based reader can capture. Hedging the currency cancels it exactly, because the forward rate is set to remove the interest differential; unhedged, buying Treasuries for the yield pickup is a bet on the dollar, not a bond decision. A real yield is real in its own currency: 2.35% means 2.35% above US inflation, which is not a real return for someone who spends euros. Read the 111 bp as a statement about relative growth expectations and policy stance, and draw no portfolio conclusion from it.
Bond Portfolio Implications
At 4.69% settled on 20 August, the 10-year Treasury pays more current income than the S&P 500's 3.88% earnings yield, a −0.81 pp earnings yield gap. Two things must be said about that before it is used for anything.
What it is good for. It compares the income the two instruments offer today using nothing but quoted prices — no growth forecast, no assumptions. An investor really can lock in the coupon or accept equity risk at that earnings yield, and right now the bond wins on current income alone.
What it cannot do. It does not forecast which asset will deliver better returns. Adding the bond yield to the earnings yield empirically makes the equity forecast worse than the earnings yield alone, so nothing here should be read as a signal about forward equity returns. Two structural biases matter when the number carries weight: the gap ignores growth — a coupon is fixed for a decade while the earnings behind the equity yield grow roughly with inflation, which is why the real-yield version (3.88% − 2.35% = +1.53 pp) is the cleaner statement, and why the 2.34 pp correction is large enough to flip the sign. And an equity holder does not receive the full earnings yield in cash: only the dividend and buyback portion arrives, the rest is retained.
The euro comparison — +2.30 pp nominal, +4.34 pp real — looks decisively better for European equities, but a cross-country comparison of this kind partly measures the difference between the two currencies rather than relative risk compensation, which is why both versions are shown. For the forward-looking valuation case, the more reliable measure is each index's earnings yield against its own history, not against bonds.
Duration risk. A 100 bp rise in yields costs roughly 8-9% on a 10-year bond, and considerably more at the long end — the 30-year has already moved from 4.93% in mid-June to 5.23% settled on 20 August, which is a double-digit price loss for anyone who bought the long bond two months ago. Given a curve that is steepening at the back on term-premium grounds rather than policy grounds, and given that the Treasury's buyback is a maturity-mix intervention rather than a supply reduction, the front-to-intermediate part of the curve looks the better risk-adjusted place to take duration: 4.19% at two years and 4.39% at five capture most of the yield with a fraction of the convexity exposure.
Currencies & Commodities
Currencies:
| Pair | Rate | Source |
|---|---|---|
| EUR/USD | 1.1581 | FRED DEXUSEU (14 Aug) ‡ |
| USD Index | 118.90 | FRED DTWEXBGS (14 Aug) ‡ |
| USD/JPY | 159.26 | web search (20 Aug) |
| GBP/USD | 1.3503 | web search (20 Aug) |
| USD/CHF | 0.8136 | web search (20 Aug) |
‡ FRED's FX series are running four business days behind today's date; treat both as stale reference levels rather than current quotes.
Commodities (all front-month futures):
| Commodity | Price | Day Chg % | Ticker | Source |
|---|---|---|---|---|
| Brent Crude | $93.78 | +2.36% | BZ=F | yfinance |
| WTI Crude | $86.83 | +2.89% | CL=F | yfinance |
| Gold ($/oz) | $4,571.40 | +0.57% | GC=F | yfinance |
| Silver ($/oz) | $68.11 | +3.46% | SI=F | yfinance |
| Copper ($/lb) | $6.469 | −0.42% | HG=F | yfinance |
| Nat Gas ($/MMBtu) | $2.733 | −2.88% | NG=F | yfinance |
Prices are the 20 Aug exchange settlements, and day changes are settlement-to-settlement against the 19 Aug settlements — the market convention for a completed session. Both crudes settled higher than their intraday last trade.
Contract note: CL=F now points at CLV26.NYM, the October contract — the generic has just rolled
off September, so today's WTI level is not directly comparable with quotes from earlier in the
week. No other contract is near expiry.
Energy was the day's driver. Both crudes settled sharply higher on the Iran sanctions threat, WTI at $86.83 within a 52-week range of $54.98-$119.48 and Brent at $93.78 against a range of $58.72-$126.10. Both futures' all-time highs date from July 2008 and are omitted here as uninformative about a market rebuilt several times over since. Natural gas moved the other way, −2.88% to $2.733, sitting just 10% above its 52-week low of $2.483 — a reminder that the crude move is a geopolitical risk premium rather than a broad energy-complex bid.
Precious metals rose on the day but remain deep in drawdown from January's peak. Gold settled at $4,571.40, 18.2% below its all-time high of $5,586.20 (set 29 January 2026) — that is not "near highs" by any reading. Silver settled at $68.11, 43.9% below its all-time high of $121.30, also from 29 January, and its +3.46% is a bounce within a severe decline rather than a recovery. Both records fall inside the last twelve months and coincide with their 52-week highs, so the distances are meaningful rather than historical artefacts.
Copper settled at $6.469/lb, slightly below its all-time high of $6.728 (set 6 August 2026, two weeks ago), down 3.8%, and is the one commodity here still trading near its record. Its −0.42% is consistent with the growth-scepticism the equity tape is showing rather than with the inflation scare in energy.
Crypto: Bitcoin traded above $70,000 for the first time since June, reportedly triggering around $1bn in short liquidations (web search, 20 Aug). The only notable digital-asset move of the session.
Sector & Theme Highlights
Best performing: Asian memory semiconductors, decisively. SK Hynix +14.1% and Samsung Electronics +9.7% on SK Hynix's ₩40tn buyback-and-cancellation programme — an explicit management statement that the shares are undervalued, arriving after a violent two-day sector selloff. Kioxia and SoftBank also rebounded more than 5% in Tokyo. Energy producers globally followed crude higher.
Worst performing: US consumer and retail, on Walmart's 9%-plus fall. The specific mechanism — strong earnings undone by soft same-store volumes attributed to fuel costs — makes this a read-across to the whole discretionary complex rather than a single-company disappointment. That read-across looked less clean after the bell, when Ross Stores reported comparable sales up 10% on customer traffic and raised guidance: the off-price end of the consumer is doing well out of the same trade-offs that hurt Walmart, which argues for trade-down rather than retrenchment. Long-duration bond proxies and rate-sensitive equities also gave ground as the long end reversed.
Cross-market themes: - Term premium, everywhere at once. France at an 18-year high, the UK above 5%, the US 30-year near 2007 levels, JGBs at levels last seen in the 1990s. When the long end sells off simultaneously across four unrelated fiscal jurisdictions, the common factor is the price of duration itself, not any one government's borrowing. - The limits of technical intervention. The buyback expansion bought roughly 24 hours. That is useful information about how the market is framing the problem. - Energy as the inflation transmission channel. Iran sanctions → crude → both the CPI outlook and, per Walmart, the consumer's wallet. This is the link that makes the bond and equity stories one story. - Credit's silence. IG at 81 bp and HY at 273 bp are not participating in any of the above. - Buybacks as a valuation floor in Asia. SK Hynix's programme, following Japanese governance reform, put a floor under a sector selloff that macro news alone was not going to stop.
Top Stories (Global)
- Treasury doubles long-dated buybacks; the bond rally lasts a day. Bessent confirmed operations of "$4bn or more per issue" from September, up from $2bn, and hinted at more. The 10-year nevertheless settled +4.0 bp at 4.69% and the 30-year +4.0 bp at 5.23% (US Treasury par curve, 20 Aug), giving back the bulk of Wednesday's move on the view that changing the maturity mix does not change the supply.
- Trump threatens "economic D-Day" sanctions on Iran. Brent settled at $93.78/bbl and WTI at $86.83 (+2.9%). The inflation implication is what the bond market reacted to.
- Walmart falls over 9% despite beating earnings. Revenue +5.9% to $187.9bn and adjusted EPS of $0.81, but US same-store sales grew 2.6% against 3.7% expected, with management citing customer "trade-offs" on high fuel prices. Dragged the Dow to −1.32%, its worst session since 29 July.
- Ross Stores beats after the close and raises guidance. Second-quarter comparable sales rose 10% on customer traffic and EPS came in at $2.66 — including roughly $0.60 from tariff refunds — against guidance of $1.85-$1.93, with the third- and fourth-quarter comp outlook raised. Shares rose in after-hours trade. Reported after the US close, and a direct counterpoint to the Walmart read on the US consumer.
- SK Hynix announces ₩40tn buyback-and-cancellation; Kospi surges 5.89%. SK Hynix +14.1%, Samsung +9.7%. The Kospi's largest one-day gain since 31 July, and an almost exact reversal of Wednesday's 5.8% fall — though on a 2026 record of fifteen separate 5%-plus up days, a move of this size is less exceptional for this index than it would be anywhere else.
- French OATs yield more than Italian BTPs. France's 10-year at 4.13% is the highest since October 2008, against Italy at 4.07%, with French public debt near 118% of GDP. OAT-Bund spread ~85 bp.
- UK 10-year gilts above 5.0%, the highest since 23 July, with traders pricing further BoE tightening into early 2027 despite signs of a softening labour market.
- US jobless claims fall to 206,000, below the 210,000 consensus — a steadier labour reading than July's negative payroll print implied.
- Bitcoin tops $70,000 for the first time since June, with roughly $1bn of shorts liquidated.
Looking Ahead
Friday 21 August - Flash August PMIs for the US, euro area, Germany, France, UK and Japan — the single most important release of the week. July's composite readings were the strongest since the start of the year in both the US and the euro area despite the Iran energy shock, and it is that resilience that has underwritten the market's pricing of further rate hikes. A downside surprise would complicate the hawkish narrative considerably; an upside one would add to the long-end pressure.
Next week - Jackson Hole Economic Policy Symposium, 27-29 August, hosted by the Kansas City Fed on the theme "Financial Innovation: Implications for Payments and Policy." Per press reports, Fed Chair Kevin Warsh delivers his first symposium keynote as chair on Friday 28 August; the KC Fed typically publishes the full agenda the evening before the symposium opens, so the exact timing is not yet confirmed. In a week where the market is questioning whether the Treasury can contain long yields, remarks from the Fed on the same subject will carry unusual weight. - Continuation of the Treasury's expanded buyback programme is scheduled to begin in September — watch for operational detail before then.
Market closures (from the Nager.Date holiday calendar): - UK — Monday 31 August: Summer Bank Holiday. London closed. - No closures in the US, Germany, France, Japan, Australia, Switzerland, Canada, Korea or Brazil within the next two weeks. (The holiday calendar holds no data for India; Indian closures could not be checked from it and are not asserted here.)