Global Financial Briefing — Tuesday, 11 August 2026
Americas index levels, commodities and day changes reflect the 11 August closing print. Fixed income, FX and macro figures are dated inline.
Market Overview
The Strait of Hormuz remains the only story that matters. Oil held a four-day advance after President Trump attached sweeping new conditions to any reopening deal — including compensation for victims' families — in response to Tehran's demand for war-damage reparations. Brent settled at $88.91 and WTI at $83.20, both up roughly 1.3% on the day and both extending a run that has repriced the entire inflation-and-rates complex over the past week. Qatar's foreign ministry said Oman–Iran talks on the future of Strait shipping have reached an advanced stage, which is what kept the move to a grind rather than a spike. Markets are trading the negotiation, not the outcome.
The regional split was sharp. US equities closed lower, but the session's rotation washed out in the final hours — S&P 500 −0.32%, Nasdaq 100 −0.33%, Dow −0.34%, a near-uniform decline with no dispersion between the three benchmarks. That reversal is itself the story: through the afternoon the Nasdaq 100 was down 0.58% against the Dow's 0.27%, the familiar pattern of long-duration growth taking the hit from the higher-for-longer rates path an oil shock implies. By the bell it had gone — technology recovered while the Dow slipped further. Europe closed essentially flat to firm: the DAX added 0.26% and the Euro STOXX 50 0.24%, both finishing within a whisker of record territory, while the CAC 40 slipped 0.13% and the FTSE 100 0.17%. Europe's index composition is heavier in energy, financials and industrials and lighter in the AI-capex names, so an oil-led tape flatters it. Brazil was the day's outlier, the IBOV shedding 2.50% to close 15.8% below its record, and South African equity (EZA) fell 1.63%.
Underneath, the risk signals are strikingly calm for a live geopolitical standoff. The VIX at 15.46 is at the low end of moderate, US high-yield spreads at 270 bps are inside the 300–500 bps long-run normal range, and investment-grade at 78 bps is below the 80–150 bps norm — credit is not pricing stress at all. Bond markets did the adjusting instead: the US 10-year at 4.65% is up roughly 11 bps over the past month, gilts eased slightly across the curve on the same reopening-hope headlines that dented oil during the session, and the JGB 10-year pushed above 2.8% for a second session as higher crude compounds Japan's inflation problem ahead of a BoJ meeting the governor has already flagged as live. Tokyo itself was shut for Mountain Day. Tomorrow's US July CPI print is the week's hinge, and it lands with oil having risen into it.
Global Indices Snapshot
Americas
| Index | Level | Day Chg | Day Chg % | Source |
|---|---|---|---|---|
| S&P 500 | 7,728.20 | −24.91 | −0.32% | yfinance ^GSPC |
| Nasdaq 100 | 29,525.48 | −96.33 | −0.33% | yfinance ^NDX |
| Dow Jones | 53,791.85 | −184.13 | −0.34% | yfinance ^DJI |
| Brazil IBOV | 167,874.64 | −4,305.30 | −2.50% | yfinance ^BVSP |
Americas data reflects the 11 Aug close.
Cross-check: FRED SP500 for 2026-08-11 reports 7,728.20, matching the yfinance ^GSPC close to
the cent.
Europe
| Index | Level | Day Chg | Day Chg % | Source |
|---|---|---|---|---|
| Euro STOXX 600 | 660.51 | +0.06 | +0.01% | yfinance ^STOXX |
| Euro STOXX 50 | 6,551.22 | +15.60 | +0.24% | yfinance ^STOXX50E |
| CAC 40 | 8,714.94 | −11.09 | −0.13% | yfinance ^FCHI |
| DAX | 26,391.42 | +67.54 | +0.26% | yfinance ^GDAXI |
| FTSE 100 | 10,844.19 | −18.31 | −0.17% | yfinance ^FTSE |
| SMI (Swiss) | 14,575.25 | −58.45 | −0.40% | yfinance ^SSMI |
European data reflects today's close (11 Aug).
Asia-Pacific
| Index | Level | Day Chg | Day Chg % | Source |
|---|---|---|---|---|
| Nikkei 225 | 66,970.22 † | — | — | yfinance ^N225 |
| Hang Seng | 25,652.82 | −284.67 | −1.10% | yfinance ^HSI |
| Shanghai Comp | 3,934.09 | −32.50 | −0.82% | yfinance 000001.SS |
| ASX 200 | 9,250.60 | +18.00 | +0.19% | yfinance ^AXJO |
| Kospi (Korea) | 6,345.53 | +45.87 | +0.73% | yfinance ^KS11 |
† Nikkei 225: 11 August 2026 is Mountain Day (山の日) — Tokyo closed today. Level reflects the 10 August close.
Asia-Pacific data (ex-Japan) reflects today's close (11 Aug).
Kospi note: yfinance reports a 52-week low of exactly 0.0 for ^KS11, which is a data error; the 52-week range for this index is unreliable today and has been omitted. The level and day change are unaffected.
Emerging Markets
| Index | Level | Day Chg % | Source |
|---|---|---|---|
| MSCI EM (EEM) | 65.43 | +0.40% | yfinance EEM |
| India Nifty 50 | 24,471.70 | −0.46% | yfinance ^NSEI |
| South Africa | 68.59 | −1.63% | yfinance EZA |
EEM and EZA are US-listed USD ETFs and reflect the 11 Aug NYSE close; Nifty reflects the 11 Aug Mumbai close.
Index Valuations & Investment Risk
Valuation Table
| Index | Trailing P/E (live) | Hist avg trailing P/E (†) | Premium to hist avg |
|---|---|---|---|
| S&P 500 | 25.94x | ~16-18x | +52.6% |
| Nasdaq 100 | 30.64x | ~25-30x | +11.4% |
| Euro STOXX 600 | 19.13x | ~15-17x | +19.5% |
| CAC 40 | 18.33x | ~14-16x | +22.2% |
| DAX | 19.29x | ~15-17x | +20.6% |
| FTSE 100 | 18.14x | ~13-15x | +29.6% |
| Nikkei 225 | 21.75x | ~20-22x | +3.6% |
| MSCI EM | 16.94x | ~13-15x | +21.0% |
(†) Hist avg trailing P/E: static long-run reference constants — the only
non-live figures in this briefing. Live trailing P/E from yfinance trailingPE on ETF proxies
(SPY, QQQ, EXSA.DE, CAC.PA, EXS1.DE, ISF.L, 1321.T, EEM). Premium computed against the midpoint of
the historical range; bold marks >20%.
Reference benchmarks: S&P 500 long-run avg trailing P/E ~16-18x, Shiller CAPE long-run avg ~17x; Euro STOXX 600 ~15-17x; MSCI EM ~13-15x. A >20% premium is elevated; >40% is historically stretched.
The striking feature is how broad the premium is. Every market in the table trades above its own long-run average, and six of the eight by more than 19%. Only the Nasdaq 100 — which is measured against an already-high historical bar of 25-30x — and the Nikkei sit close to their own norms. The S&P 500 at 25.94x, some 52.6% above the midpoint of its historical range, is the single most stretched entry and the only one in genuinely stretched territory by the >40% threshold.
Investment Risk Assessment for ETF Investors
United States (S&P 500 / Nasdaq ETFs)
At 25.94x trailing, the S&P 500 earnings yield is (1÷25.94) = 3.86%, against a 10-year Treasury at 4.65% (FRED DGS10, 2026-08-07). The earnings yield gap is therefore −0.79 pp — negative, meaning a Treasury pays more current yield today than the index earns. Against the TIPS real yield of 2.40% (FRED DFII10, 2026-08-07) the same comparison is +1.46 pp. See the Bond Portfolio Implications section for what this measure can and cannot tell you; the short version is that it describes today's income trade-off and forecasts nothing.
The index closed 0.8% below its all-time high of 7,793.68, 3.0% above its 50-day moving average and 9.5% above its 200-day — an uptrend intact but no longer accelerating. The Nasdaq 100 closed 4.0% below its record and only 0.6% above its 50-day, still the flattest of the US benchmarks against its own trend even after recovering most of the day's underperformance into the bell. Concentration risk in the AI-capex complex remains the dominant single-name exposure, and Intel's decision to upsize its equity raise from $15bn to $20bn is a reminder that the buildout is increasingly being funded by dilution rather than cash flow. Real yields at 2.40% keep the discount-rate pressure on long-duration equity firmly in place.
Europe (STOXX 600 / CAC 40 / DAX ETFs)
The STOXX 600 at 19.13x yields (1÷19.13) = 5.23%, against a German 10-year Bund at 3.20% — a +2.03 pp euro earnings yield gap. On the euro real yield of 1.16% (derived below) the gap is +4.07 pp.
Europe therefore offers a materially wider gap than the US on both nominal and real measures. Part of that difference is genuine — European indices carry more cyclical and financial weight and less of the growth premium — but part is simply the difference between US and euro-area inflation and policy paths rather than a difference in risk compensation. The decomposition in the Real Yields section below shows how that splits today, and the answer is not the obvious one.
European valuations are historically elevated in their own right: the CAC at +22.2%, the DAX at +20.6% and the FTSE at +29.6% above their long-run averages are not cheap in absolute terms, only cheaper than the US. The STOXX 600 closed 0.4% from its record and the DAX 0.2% from its own, with both comfortably above their 50- and 200-day averages.
Specific European risks: the OAT-Bund spread widened 3.4 bps today to 79.1 bps, keeping French fiscal credibility a live issue, and the region's energy import dependence makes a sustained Hormuz disruption a direct terms-of-trade hit rather than the mixed blessing it is for the US.
On currency: a euro-based investor holding EUR-quoted European funds has no FX effect on the quoted value of the holding, but retains real FX exposure inside the earnings — CAC 40 and STOXX 600 constituents are multinationals earning substantially abroad. The exposure is smaller, slower and partly hedged by foreign cost bases, not absent.
Japan (Nikkei / TOPIX ETFs)
Tokyo was closed today for Mountain Day; the 66,970.22 level is Monday's close, when the index rose 2.08%. At 21.75x trailing the Nikkei is the closest of any major market to its own historical average (+3.6%), which after a multi-year re-rating is a genuinely notable outcome — earnings have broadly kept pace with price. The index sits 8.0% below its record and just below its 50-day average, but 16.5% above its 200-day.
The dominant risk is policy. The BoJ held at 1.00% by an 8-1 vote after June's 25 bp hike, and the governor has signalled a possible September move with the bank assessing that underlying inflation could overshoot target. Rising crude feeds directly into that assessment. JGB 10-year yields above 2.8% and USD/JPY at 159.27 frame the tension: a hike would support the yen and pressure the exporter-heavy index, so the currency hedge decision is effectively a bet on BoJ timing rather than a technical detail. Corporate governance reform continues to provide a structural bid independent of the macro.
Emerging Markets (MSCI EM ETFs)
At 16.94x, EM trades at a 35% discount to the S&P 500's 25.94x — but at +21.0% above its own long-run average of 13-15x, so the discount is relative rather than absolute. EEM closed 8.6% below its record and 1.2% under its 50-day average. China remains the swing factor: the Hang Seng fell 1.10% and sits 23.4% below its record, while the Shanghai Composite is 35.8% below its own — a reminder that the EM index's largest weight is still working through a very long drawdown. Today's EM weakness was concentrated in commodity-linked and higher-beta markets (Brazil −2.50%, South Africa −1.63%), which is the usual pattern when an oil shock arrives without a growth impulse behind it.
Overall Risk Score: High valuation risk / low margin of safety in the US; moderate — fair value on relative measures, elevated on absolute ones — in Europe and Japan; moderate in EM. No major market in this briefing is cheap against its own history. The distinguishing feature of today's tape is that valuations are stretched while credit spreads are tight and volatility is low, which is a combination that offers little cushion if the Hormuz negotiation turns.
Disclaimer: This is financial information, not personalised investment advice. Past valuations do not guarantee future returns. Consult a financial advisor before investing.
US Economic Indicators (FRED — authoritative)
| Indicator | Current | Prior | Delta | Reference Date | FRED Series |
|---|---|---|---|---|---|
| CPI YoY % | 3.46% | 4.17% | −0.70 pp | Jun 2026 | CPIAUCSL |
| Core CPI YoY % | 2.57% | 2.82% | −0.26 pp | Jun 2026 | CPILFESL |
| Unemployment Rate | 4.1% | 4.2% | −0.1 pp | Jul 2026 | UNRATE |
| Nonfarm Payrolls | −23k | +20k | −43k | Jul 2026 | PAYEMS |
| 10Y TIPS Real Yield | 2.40% | 2.43% | −3 bps | 2026-08-07 | DFII10 |
Note: FRED macro data is monthly and lags 4-6 weeks; reference months shown above. NFP is the month-over-month change in total nonfarm employment.
The July payrolls print is the number to sit with: −23k, the first outright monthly decline after +20k in June and +63k in May, a clear three-month deceleration. The unemployment rate fell to 4.1% over the same month, which usually signals labour force exit rather than strength when it accompanies negative payrolls. Headline CPI decelerated sharply to 3.46% from 4.17% and core to 2.57% from 2.82% — but that is June data, gathered before the current oil move. A softening labour market against still-above-target inflation, with crude now rising into the next print, is an uncomfortable configuration for the Fed.
Other economic releases today: no major US macro release was scheduled for 11 August. The week's calendar is back-loaded — July CPI Wednesday 12 August at 08:30 ET, PPI and weekly jobless claims later in the week, and retail sales Friday 14 August.
Fixed Income & Bond Analysis
US Treasury yields from FRED; European and Japanese yields from web sources.
Policy Rates
| Central Bank | Rate | Source |
|---|---|---|
| Fed Funds (upper) | 3.75% | FRED DFEDTARU (2026-08-11) |
| Fed Funds (lower) | 3.50% | FRED DFEDTARL (2026-08-11) |
| Effective FFR | 3.63% | FRED DFF (2026-08-07) |
| ECB Deposit Rate | 2.25% | FRED ECBDFR (2026-08-11) |
| BOJ Policy Rate | 1.00% | web search (held 8-1; +25 bp in June 2026) |
| BOE Bank Rate | ~3.73% | FRED IUDSOIA (SONIA proxy, 2026-08-07) |
Government Bond Yields
| Country | 2Y Yield | 10Y Yield | 30Y Yield | Day Chg (10Y) | Source |
|---|---|---|---|---|---|
| USA | 4.19% | 4.65% | 5.19% | −4 bps | FRED (2026-08-07) |
| Germany | 2.72% * | 3.20% | 3.65% * | (not found) | ECB YC API * / web |
| France | — | 3.99% | — | (not found) | web (2026-08-11) |
| UK | 4.32% | 4.98% | 5.71% | −2.4 bps | web (2026-08-11) |
| Japan | — | ~2.80% | — | (not found) | web (2026-08-10) |
| Italy | — | 3.90% | — | (not found) | web (2026-08-06) — stale |
* German 2Y and 30Y are the ECB AAA-rated euro area composite curve (2026-08-10), not Bunds specifically; the composite is dominated by Bunds but is not identical. The 10Y figure of 3.20% is a direct Bund quote for 2026-08-11 and cross-checks closely against the ECB AAA 10Y of 3.199%. Italy's 10Y is from 6 August and is older than the other rows — treat with caution.
Yield Curve Spreads (FRED pre-computed, 2026-08-10):
- 10Y-2Y spread: +47 bps — positively sloped and normal. Not inverted, and not steep either; a steep curve would be north of ~75 bps.
- 10Y-3M spread: +83 bps — comfortably positive, no recession signal from this indicator.
Both spreads have normalised well clear of the inversion that persisted through the tightening cycle. The curve now says the market expects policy to sit roughly where it is, with a modest term premium restored at the long end — the 30Y at 5.19% is actually a touch below the 20Y at 5.20%, a small kink but not a meaningful inversion.
OAT-Bund Spread: 79.1 bps as of 11 August, wider by 3.4 bps on the session (OAT 10Y 3.99% vs Bund 10Y 3.20%). This remains a moderate level by the standards of the past two years, but the direction is the point — French fiscal risk is being repriced upward again, not fading. Notably, French and Italian 10-year yields have now converged to nearly the same level (3.99% vs 3.90%), which inverts the historical ordering and is a more telling signal about France than the Bund spread alone.
Yield Curve Charts
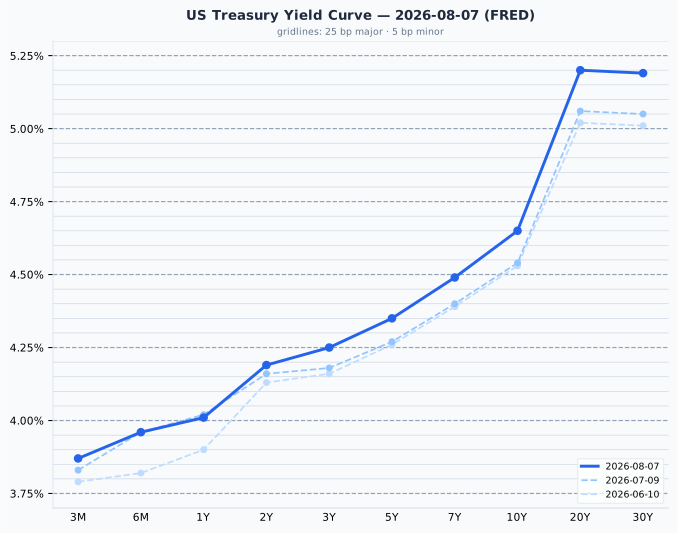
The US curve is normally sloped throughout, rising from 3.87% at 3 months to 5.20% at 20 years with only a marginal flattening into the 30-year. Against a month ago the whole curve has shifted up — the 10-year is 11 bps higher at 4.65% and the 20-year 14 bps higher at 5.20% — with the long end moving more than the front, a bear steepening consistent with an oil-driven inflation repricing rather than a change in expected policy.
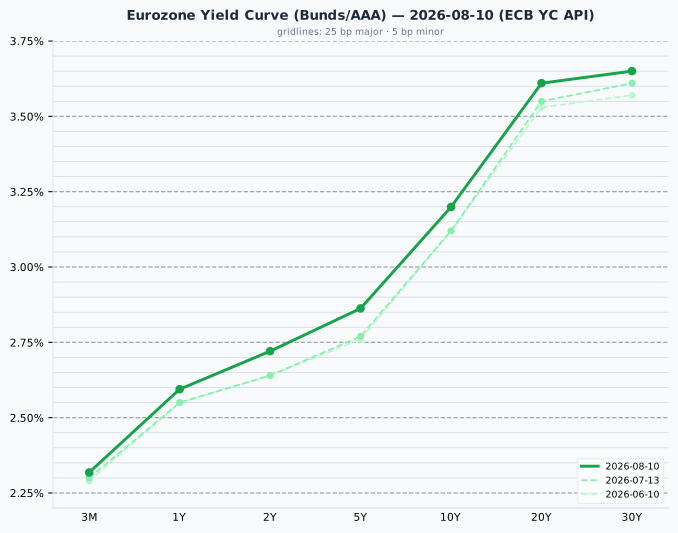
The euro AAA curve is likewise upward-sloping and considerably flatter in absolute terms, running from 2.32% at 3 months to 3.65% at 30 years. Compared with a month ago (13 July) it has moved up almost uniformly by 6-8 bps across maturities — the 10-year from 3.12% to 3.20%, the 20-year from 3.55% to 3.61% — a parallel shift rather than the steepening seen in Treasuries.
Credit Markets (FRED — authoritative, 2026-08-10)
| Market | OAS Spread | Series ID |
|---|---|---|
| US Investment Grade | 78 bps | BAMLC0A0CM |
| US High Yield | 270 bps | BAMLH0A0HYM2 |
| Euro High Yield | 256 bps | BAMLHE00EHYIOAS |
All three are historically tight. US high yield at 270 bps sits below the 300-500 bps long-run normal range, and investment grade at 78 bps is below the 80-150 bps norm. Euro high yield at 256 bps is tighter still than its US counterpart. Credit markets are pricing essentially no default risk premium above the cycle norm, which sits awkwardly against a live geopolitical standoff, a negative payrolls print and equity valuations at 50%+ premiums. Tight spreads of this order signal either genuine confidence in corporate fundamentals or complacency; they leave very little room to compensate holders if either assumption is tested.
Real Yields (US and Euro Area)
| Region | Nominal 10Y | Expected inflation | Real 10Y | How the real yield is obtained |
|---|---|---|---|---|
| United States | 4.65% | 2.25% (residual) | 2.40% | Measured. TIPS trade, so the market quotes a real yield directly; expected inflation is the residual (the breakeven) |
| Euro area | 3.20% | 2.04% (measured) | 1.16% | Constructed. No euro inflation-linked benchmark is published, so a survey expectation is subtracted from the nominal yield |
Sources: FRED DGS10 and DFII10 (2026-08-07); ECB YC API AAA 10Y 3.199% (2026-08-10); ECB Survey of Professional Forecasters long-term HICP expectation 2.04% (2026 Q3 round).
The two rows are built in opposite directions and are not two readings of one instrument. The US real yield is a traded market price with expected inflation backed out as the residual; the euro real yield is a residual itself, obtained by subtracting a survey expectation from a nominal yield. Only the US figure is something anyone actually trades, so treat the euro number as the softer of the two. Two mismatches follow from this: the US breakeven carries an inflation risk premium that a survey does not, and the SPF horizon is five calendar years ahead against the bond's ten.
Decomposing the 145 bp nominal gap between the US 10Y (4.65%) and the euro AAA 10Y (3.20%): only 21 bps is a difference in expected inflation (2.25% vs 2.04%), while 124 bps is a difference in real rates (2.40% vs 1.16%). This is overwhelmingly a real-rate story, not an inflation story — the two regions' inflation expectations are nearly converged. The split moves with the cycle and is recomputed each day; today it is more lopsided toward the real component than the headline gap would suggest.
⚠️ The US–euro real rate gap is not an investment opportunity
The 124 bp US real yield advantage is a structural feature — higher US trend growth, euro-area excess savings, Bund scarcity and US fiscal supply — and not something a EUR-based reader can capture. Hedging the currency cancels it almost exactly, because the forward rate is set to remove the interest differential; unhedged, buying Treasuries for the higher real yield is a currency bet rather than a bond decision. A real yield is real in its own currency: 2.40% means 2.40% above US inflation, which is not a real return for someone who spends euros. The gap belongs in this briefing as a macro fact about relative policy stance and growth expectations, and no portfolio conclusion should be drawn from it.
Bond Portfolio Implications
The earnings yield gap — what it is good for, and what it is not. The figures below compare the income the two instruments offer today, using nothing but quoted prices — no growth forecast, no assumptions. That is the measure's real virtue: it tells an investor honestly that right now they can lock in this bond yield, or accept equity risk at this earnings yield. It is not the equity risk premium, which is expected total return minus the risk-free rate and requires a growth estimate this measure omits. And it does not forecast whether equities will beat bonds over any horizon.
- S&P 500 gap = (1÷25.94) − 4.65% = 3.86% − 4.65% = −0.79 pp. Negative: Treasuries pay more current yield than the index earns.
- Euro (STOXX 600) gap = (1÷19.13) − 3.20% = 5.23% − 3.20% = +2.03 pp.
Two structural biases to keep in view. First, the measure ignores growth: a bond coupon is fixed for a decade while the earnings behind the equity yield grow roughly with inflation, so the gap understates equities by approximately expected inflation. The real-yield version corrects for this — the S&P gap against DFII10 is +1.46 pp and the euro gap against the 1.16% euro real yield is +4.07 pp. The size of that correction is the interesting part: roughly 2.25 pp for the US, more than enough to flip the sign of the gap from negative to positive. Second, an equity holder does not receive the full earnings yield — only the dividend and buyback portion arrives as cash, and the remainder is retained.
The cross-country comparison needs the caveat above: Europe's wider gap on both measures partly reflects the difference between the two currencies' rate environments, though today's decomposition shows that difference is real-rate driven rather than inflation-driven, which makes the comparison more meaningful than it often is. For a forward-looking valuation view, the more reliable measure is each index's earnings yield against its own history, which is what the premium column in the valuation table captures.
Are bonds attractive? On a nominal basis, a 4.65% 10-year Treasury against a 3.86% S&P earnings yield is the most bond-favourable current-income comparison in years. On a real basis the picture reverses. For a EUR-based investor the relevant comparison is the euro curve, where a 3.20% AAA 10-year against a 1.16% real yield offers a thinner but positive real return with no currency risk.
Duration risk: a 100 bp rise in yields implies roughly an 8-9% price loss on a 10-year bond, and considerably more at the 30-year point. With the curve normally sloped at +47 bps 10Y-2Y, the term premium for extending duration is modest — an investor is paid only about 47 bps for taking eight additional years of duration risk. In an environment where an oil shock could plausibly push long-end yields higher, the front-to-belly of the curve offers most of the yield with a fraction of the price sensitivity.
Currencies & Commodities
Currencies:
| Pair | Rate | Source |
|---|---|---|
| EUR/USD | 1.1559 | FRED DEXUSEU (2026-08-07) |
| USD Index | 119.06 | FRED DTWEXBGS (2026-08-07) |
| USD/JPY | 159.27 | web search (2026-08-11) |
| GBP/USD | 1.3502 | web search (2026-08-11) |
| USD/CHF | 0.8105 | web search (2026-08-11) |
The yen at 159.27 remains the pressure point — weak enough to keep imported energy costs elevated just as crude rises, which is precisely the combination that has the BoJ signalling September. The Swiss franc below 0.81 per dollar reflects continued haven demand.
Commodities (yfinance front-month futures):
| Commodity | Price | Day Chg % | Ticker | Source |
|---|---|---|---|---|
| Brent Crude | $88.91 | +1.36% | BZ=F | yfinance |
| WTI Crude | $83.20 | +1.30% | CL=F | yfinance |
| Gold ($/oz) | $4,441.10 | +0.48% | GC=F | yfinance |
| Silver ($/oz) | $64.94 | −0.52% | SI=F | yfinance |
| Copper ($/lb) | $6.6340 | +0.27% | HG=F | yfinance |
| Nat Gas ($/MMBtu) | $2.767 | −0.97% | NG=F | yfinance |
Gold settled at $4,441.10, 20.5% below its all-time high of $5,586.20, and the day's +0.48% is a modest gain rather than a haven bid — notable given a live Middle East standoff, and a sign that the metal's earlier spike has substantially unwound. Silver settled at $64.94, 46.5% below its all-time high of $121.30, having also traded as low as $37.21 over the past year; the peak-to-present drawdown in silver is among the most severe in the complex and the 52-week range alone spans more than a threefold move. Neither metal is anywhere near record territory despite the geopolitical backdrop.
Copper at $6.6340 is the outlier in the other direction, sitting just 1.4% below its all-time high of $6.728 — effectively at all-time highs, and the clearest commodity expression of the electrification and grid-buildout theme. Crude sits well below its records (WTI 43.5% and Brent 39.7% below their 2008 peaks) despite the current run, which is worth remembering when the tape frames $89 Brent as extreme: it is high relative to the past year, not historically. Natural gas at $2.767 is 82.5% below its all-time high and near the bottom of its 52-week range ($2.483 low), entirely disconnected from the crude move.
Crypto: no moves above the 3% threshold were retrieved for today; omitted.
Sector & Theme Highlights
Energy was the day's clear leader globally, with crude's four-day advance flowing directly into producers and services — this is the main reason Europe's energy-heavier indices outperformed US benchmarks. Technology and long-duration growth led the decline for most of the session — the Nasdaq 100 down 0.58% against the Dow's 0.27% through the afternoon — but the rotation did not survive the close, the two finishing at −0.33% and −0.34%. Higher oil implies a higher-for-longer rate path and that discount-rate effect falls disproportionately on the AI-capex complex, but on 11 August the tape stopped expressing it before the bell.
Cross-market themes worth tracking:
- AI capex financing shifts to equity. Intel's upsizing of its raise from $15bn to $20bn is the second-order consequence of the buildout — funding needs are outrunning operating cash flow, and dilution is becoming the marginal source. Watch whether peers follow.
- Energy security as a durable bid. The Hormuz standoff is reinforcing what defence spending and grid investment already started: physical infrastructure and commodity-linked equity have a structural, not merely cyclical, tailwind. Copper at all-time highs is the same trade.
- Precious metals decoupling from geopolitics. Gold up just 0.48% and silver lower on a day of escalating Middle East risk, with both deep in drawdown from their highs (gold 20.5%, silver 46.5% below their records), suggests positioning is the dominant driver rather than haven demand.
- China's persistent drag on EM. Hang Seng 23.4% and Shanghai 35.8% below their records continue to cap the EM complex regardless of what the rest of the index does.
- European fiscal divergence. French and Italian 10-year yields converging to near-parity is a repricing of relative sovereign credibility within the euro area.
Top Stories (Global)
- US–Iran impasse over the Strait of Hormuz. Trump attached sweeping new demands on Monday, including compensation for victims' families and Middle Eastern countries, after Tehran said it would not reopen the Strait without reparations for war damage. Oil held a four-day gain. (Bloomberg / CNBC, 11 Aug)
- Qatar signals progress on shipping talks. Qatar's foreign ministry spokesperson said Oman–Iran negotiations on the future of Strait shipping have reached an advanced stage — the counterweight that kept crude's move orderly. (11 Aug)
- US equities closed lower as the standoff intensified. S&P 500 −0.32% to 7,728.20, Nasdaq 100 −0.33% to 29,525.48, Dow −0.34% to 53,791.85 — the technology-led weakness seen through the afternoon had evened out across the benchmarks by the close. (yfinance closes; S&P cross-checked against FRED SP500, 11 Aug)
- Intel priced its upsized $20bn stock offering at $95 per share — 210,526,315 shares, roughly $19.7bn net of fees, with a 30-day underwriter option on a further 31,578,947 shares. The book drew reported institutional demand above $100bn, around five times the deal, and settlement is set for 12 August. (Intel investor relations / CNBC, 11 Aug)
- UK gilts eased across the curve on hopes of a Hormuz deal lowering oil: 10Y −2.4 bps to 4.98%, 2Y −3.3 bps to 4.32%, 30Y −2.0 bps to 5.71%. The 10Y remains about 34 bps above a year ago. (tradingeconomics, 11 Aug)
- OAT-Bund spread widened 3.4 bps to 79.1 bps, with the French 10Y at 3.99% against a 3.20% Bund — French and Italian yields now effectively converged. (ideal-investisseur.fr, 11 Aug)
- JGB 10-year pushed above 2.8% for a second consecutive session as higher oil compounded inflation concerns, with the BoJ governor having signalled a possible September hike. Tokyo was closed today for Mountain Day. (tradingeconomics, 10 Aug)
Looking Ahead
Economic releases (next 1-5 trading days):
- Wednesday 12 August, 08:30 ET — US July CPI. The week's decisive print, and it arrives with crude having risen into it. June headline was 3.46% and core 2.57%, both decelerating sharply; whether that continues under an oil bid is the question the whole rates complex is positioned around.
- Later this week — US PPI and weekly initial jobless claims. Claims carry more weight than usual after July's −23k payrolls print.
- Friday 14 August, 08:30 ET — US retail sales. Consumer spending is roughly 70% of GDP; a soft print alongside negative payrolls would sharpen the slowdown narrative.
Central banks:
- FOMC: Wednesday 16 September — the next scheduled rate decision. A San Francisco Fed speech by President Daly is scheduled later this week.
- BoJ September meeting is effectively live: the governor has signalled a possible hike and the bank has assessed that underlying inflation could overshoot target.
Geopolitical:
- Hormuz negotiations — Oman–Iran talks described as advanced. Any concrete announcement is the single largest potential mover for oil, and through oil, for rates and equities.
Market closures (from the Nager.Date holiday calendar):
- Friday 14 August — no closures among tracked markets.
- Saturday 15 August — France: Assumption Day (Assomption). Falls on a weekend; no trading impact for Euronext Paris.
- Monday 17 August — South Korea: Liberation Day (광복절). Seoul closed.
- Further out: Monday 31 August — UK Summer Bank Holiday (London closed); Monday 7 September — US Labor Day, Canada Labour Day, Brazil Independence Day (all closed).
- Note: the holiday calendar contains no data for India (IN), so Indian market closures could not be checked. Germany, Switzerland and Australia have no national holidays in the coming month per the calendar.