2026 08 04
Global Financial Briefing — Tuesday, 4 August 2026
Americas index levels, commodities and day changes reflect the 4 August closing print. Fixed income, FX and macro figures are dated inline.
Market Overview
Global equities closed firmly risk-on, with the US, France, Germany, and the broad Euro STOXX 600 either setting or brushing fresh record highs in the same session — a genuinely synchronized rally rather than a US-only move. The dominant driver was geopolitical: hopes for a deal to reopen the Strait of Hormuz had investors betting mediators can avert US airstrikes on Iran, sending WTI crude down 5.7% to settle at $75.77 and lifting risk sentiment broadly. That relief, combined with a further leg higher in AI-hyperscaler names (Meta, Alphabet, Microsoft, Amazon all posted outsized gains into Monday's close and momentum carried through Tuesday), pushed the Nasdaq 100 up 3.32% and the Dow to a record close of 54,085.88.
Europe closed its session broadly in record territory too: the Euro STOXX 600, STOXX 50, CAC 40 and DAX all finished at or fractionally above their prior all-time highs, while the FTSE 100 and SMI lag just behind their own recent peaks. Asia-Pacific was more mixed — Japan, mainland China, Australia and Korea posted modest-to-solid gains, but Hong Kong and India both slipped, and none of the Asian benchmarks are anywhere near their own record levels, a reminder that this rally remains concentrated in developed Western markets and continues to be underpinned as much by geopolitical relief and AI enthusiasm as by broad-based global growth optimism.
Underneath the risk-on tone, valuations are stretched in the US in particular: the S&P 500's live trailing P/E is running roughly 63% above its long-run historical average, and the equity risk premium versus the 10-year Treasury is now negative — Treasuries are yielding more than the earnings yield on the S&P 500, a historically uncommon and cautionary signal for investors relying on equities to outperform bonds from here. Credit markets show no such caution: US and euro high-yield spreads are trading tight to historical norms, and the VIX sits at 15.9 — in the low half of the 15-20 "moderate" band, not yet into "low/complacent" territory (<15) but close to it — indicating little near-term hedging demand despite the elevated equity multiples.
Global Indices Snapshot
Americas
Americas data reflects the 4 Aug close.
| Index | Level | Day Chg | Day Chg % | Source |
|---|---|---|---|---|
| S&P 500 | 7,736.52 | +136.02 | +1.79% | yfinance ^GSPC |
| Nasdaq 100 | 29,733.16 | +956.36 | +3.32% | yfinance ^NDX |
| Dow Jones | 54,085.88 | +907.47 | +1.71% | yfinance ^DJI |
| Brazil IBOV | 177,894.97 | −105.26 | −0.06% | yfinance ^BVSP |
The S&P 500 closed at 7,736.52 — a record close that took out its previous 52-week high of 7,725.60 — after reaching 7,758.21 intraday, which now stands as its all-time high. The Dow also set a record close at 54,085.88, above the 53,178.41 posted on 3 Aug, having touched 54,272.60 intraday before easing into the bell. FRED's SP500 series confirms the S&P 500 close at 7,736.52 (2026-08-04), matching the yfinance print to the cent. Brazil's Ibovespa finished fractionally lower, sitting about 10.8% below its own all-time high of 199,355.
Europe
European data reflects today's close (4 Aug).
| Index | Level | Day Chg | Day Chg % | Source |
|---|---|---|---|---|
| Euro STOXX 600 | 656.86 | +4.77 | +0.73% | yfinance ^STOXX |
| CAC 40 | 8,666.63 | +52.81 | +0.61% | yfinance ^FCHI |
| DAX | 26,202.35 | +201.04 | +0.77% | yfinance ^GDAXI |
| FTSE 100 | 10,879.38 | +21.68 | +0.20% | yfinance ^FTSE |
| SMI (Swiss) | 14,463.23 | +91.46 | +0.64% | yfinance ^SSMI |
Euro STOXX 600 (656.86), STOXX 50 (6,486.70), CAC 40 (8,666.63) and DAX (26,202.35) all closed at or fractionally above their previous all-time highs today — a broad-based European record. FTSE 100 is about 1.0% below its 52-week/record high of 10,989.5, and the SMI is roughly 1.3% off its own high of 14,656.05 — both close, but not quite at record levels.
Asia-Pacific
Asia-Pacific data reflects today's close (4 Aug) in each local timezone.
| Index | Level | Day Chg | Day Chg % | Source |
|---|---|---|---|---|
| Nikkei 225 | 63,957.53 | +202.63 | +0.32% | yfinance ^N225 |
| Hang Seng | 25,852.92 | −156.48 | −0.60% | yfinance ^HSI |
| Shanghai Comp | 3,822.28 | +12.62 | +0.33% | yfinance 000001.SS |
| ASX 200 | 9,145.80 | +126.50 | +1.40% | yfinance ^AXJO |
| Kospi (Korea) | 6,358.95 | +101.50 | +1.62% | yfinance ^KS11 |
None of the Asian benchmarks are near their own record highs. Japan's Nikkei remains about 12% below its all-time high of 72,831.73; Hong Kong's Hang Seng is roughly 23% below its 33,484.08 peak; and the Shanghai Composite is more than 37% below its 6,124.04 all-time high. The ASX 200 is the closest to a record among this group, about 0.6% below its 9,202.90 high.
Emerging Markets
| Index | Level | Day Chg % | Source |
|---|---|---|---|
| MSCI EM (EEM) | 66.00 | +2.61% | yfinance EEM |
| India Nifty 50 | 24,614.90 | −0.64% | yfinance ^NSEI |
| South Africa | 65.96 | +2.53% | yfinance EZA |
Index Valuations & Investment Risk
Valuation Table
| Index | Trailing P/E (live) | Hist avg trailing P/E (†) |
|---|---|---|
| S&P 500 | 27.70x | ~16-18x |
| Nasdaq 100 | 31.96x | ~25-30x |
| Euro STOXX 600 | 19.02x | ~15-17x |
| CAC 40 | 18.21x | ~14-16x |
| DAX | 19.16x | ~15-17x |
| FTSE 100 | 18.19x | ~13-15x |
| Nikkei 225 | 20.73x | ~20-22x |
| MSCI EM | 16.98x | ~13-15x |
(†) Hist avg trailing P/E: static long-run reference constants.
Trailing P/E (live): sourced from yfinance trailingPE on ETF proxies (SPY, QQQ, EXSA.DE, CAC.PA, EXS1.DE, ISF.L, 1321.T, EEM).
Premium/discount to historical average midpoint: - S&P 500: +63% — historically stretched - Nasdaq 100: +16% (moderately elevated, below the flag threshold) - Euro STOXX 600: +19% (approaching elevated, just below the flag threshold) - CAC 40: +21% — elevated - DAX: +20% (right at the elevated threshold) - FTSE 100: +30% — historically stretched - Nikkei 225: −1% (essentially fair value) - MSCI EM: +21% — elevated
Japan is the only major index trading close to its own historical average; the UK, France and emerging markets are all running meaningfully above theirs on a trailing-P/E basis, and the US is the most stretched of the group by a wide margin.
Investment Risk Assessment for ETF Investors
United States (S&P 500 / Nasdaq ETFs) SPY's live trailing P/E of 27.70x is roughly 63% above the ~16-18x historical average — a historically stretched reading. Earnings yield is (1÷27.70) = 3.61%, which compares to the 10-year Treasury yield of 4.75% (FRED DGS10, 2026-07-31) for an equity risk premium of −1.14% — negative, meaning Treasuries currently yield more than S&P 500 earnings, a rare and cautionary condition historically associated with weaker forward equity returns. QQQ's trailing P/E of 31.96x is high in absolute terms but only ~16% above its own historical band, less stretched than the S&P 500 on a relative basis. The 10-year real yield (FRED DFII10) is 2.47% — a high real rate that continues to compress the present value of future earnings, particularly for long-duration growth names. Concentration in AI-hyperscaler earnings remains a key risk: the session's rally was substantially powered by a handful of mega-cap tech names. The S&P 500 and Dow both set record closes, well above their 50-day (7,474.9 and 51,768.9) and 200-day (7,028.9 and 49,085.0) moving averages, while the Nasdaq 100 finished about 3.3% below its own all-time high of 30,762.20.
Europe (STOXX 600 / CAC 40 / DAX ETFs) EXSA.DE's trailing P/E of 19.02x is about 19% above its ~15-17x historical average — approaching elevated but not yet flagged. Earnings yield is (1÷19.02) = 5.26%, which compares favourably to the Eurozone AAA 10-year yield of 3.19% (ECB YC API, 2026-08-03) for a euro equity risk premium of +2.07% — comfortably positive and well above the 1% caution threshold, in contrast to the negative US reading. This gives European equities a meaningfully more attractive valuation cushion versus their own government bond market than US equities currently offer. That said, CAC 40 (+21% over its historical average) and DAX (+20%) are both running hotter in absolute multiple terms than STOXX 600, even though today's session pushed all three to fresh records. Currency risk remains relevant for non-EUR-based investors, and geopolitical tail risk (energy dependence, French fiscal dynamics) is an ongoing consideration even as today's news (Hormuz de-escalation hopes) worked in Europe's favour.
Japan (Nikkei / TOPIX ETFs) The Nikkei's live trailing P/E of 20.73x is essentially in line with its ~20-22x historical range — the only major index in this briefing trading at fair value on this metric, despite sitting about 12% below its own all-time high. JPY currency-hedge considerations remain material: the yen continues to trade weak (USD/JPY ~156.5, web search), and the BOJ held its policy rate at 1.00% at the July 2026 meeting after a 25bp hike in June, while flagging core inflation likely running "clearly above" 2% from H2 FY2026 — a hawkish bias that keeps further BOJ tightening, and JGB yield volatility (10-year JGB yield near 2.85% today after a weak auction), squarely in view for investors.
Emerging Markets (MSCI EM ETFs) EEM's trailing P/E of 16.98x is about 21% above its ~13-15x historical average — elevated, though EM continues to trade at a discount to DM multiples in absolute terms (16.98x vs. 27.70x for the S&P 500). China's weight in the index remains a key swing factor for EM performance; the Shanghai Composite's +0.33% gain was modest against a stronger close in South Africa (EZA +2.53%) and a decline in India's Nifty 50 (−0.64%), underscoring dispersion within the EM basket. EEM closed at 66.00, below its 50-day moving average of 66.5 but well above its 200-day of 60.3, and 7.8% below its 52-week high of 71.57.
Overall Risk Score (qualitative, not financial advice): - United States: High valuation risk / low margin of safety — stretched trailing P/E, negative equity risk premium - Europe: Moderate — fair-to-elevated valuations but a comfortably positive equity risk premium versus Bunds - Japan: Moderate to attractive — valuation near historical fair value, offset by currency and policy-path risk - Emerging Markets: Moderate — valuation discount to DM intact but trading above own historical average, with internal dispersion
Disclaimer: This is financial information, not personalised investment advice. Past valuations do not guarantee future returns. Consult a financial advisor before investing.
US Economic Indicators (FRED - authoritative)
| Indicator | Current | Reference Date | FRED Series |
|---|---|---|---|
| CPI YoY % | 3.46% | 2026-06 (June) | CPIAUCSL |
| Core CPI YoY % | 2.57% | 2026-06 (June) | CPILFESL |
| Unemployment Rate | 4.2% | 2026-06 (June) | UNRATE |
| Nonfarm Payrolls | +57k m/m (158,984k total) | 2026-06 (June) | PAYEMS |
| 10Y TIPS Real Yield | 2.47% | 2026-07-31 | DFII10 |
FRED macro data is monthly and lags 4-6 weeks; June is the most recently published month for CPI, unemployment and payrolls as of this report. Core CPI (2.57% YoY) remains above the Fed's 2% target, and headline CPI (3.46% YoY) is running meaningfully hotter still — consistent with the Fed Funds range staying at 3.50-3.75% rather than easing further.
Other economic releases today: no same-day US PMI/GDP/PPI surprises were identified; today's macro narrative was dominated by the Hormuz-related oil move rather than scheduled data.
Fixed Income & Bond Analysis
Policy Rates
| Central Bank | Rate | Source |
|---|---|---|
| Fed Funds (upper) | 3.75% | FRED DFEDTARU |
| Fed Funds (lower) | 3.50% | FRED DFEDTARL |
| Effective FFR | 3.63% | FRED DFF |
| ECB Deposit Rate | 2.25% | FRED ECBDFR |
| BOJ Policy Rate | 1.00% | web search — held at July 2026 meeting after June's 25bp hike |
| BOE Bank Rate | ~3.73% (SONIA/FRED) | FRED IUDSOIA |
Government Bond Yields
| Country | 2Y Yield | 10Y Yield | 30Y Yield | Source |
|---|---|---|---|---|
| USA | 4.28% | 4.75% | 5.27% | FRED |
| Eurozone (AAA) | 2.70% | 3.19% | 3.63% | ECB YC API |
| UK | (not retrieved) | 4.99% | (not retrieved) | web |
| Japan | (not retrieved) | 2.85% | (not retrieved) | web |
Germany/France/Italy country-level yields and the OAT-Bund spread are not available here: the ECB AAA euro-area curve does not carry individual sovereign yields. UK 10-year gilt yield rose ~4bps to 4.99% today; Japan's 10-year JGB yield climbed to ~2.85% after a weak government bond auction.
Yield Curve Spreads (FRED pre-computed): - 10Y-2Y spread: +45 bps (2026-08-03) — positively sloped; not flat (within ±25bps) and well short of a historically "steep" curve (>~75bps). A modest, unremarkable slope. - 10Y-3M spread: +79 bps (2026-08-03) — positive, no recession signal from this measure currently.
Both spreads point to a normalizing but not yet steep curve — consistent with a market that has largely priced out near-term recession risk without expecting aggressive Fed easing either.
Yield Curve Charts
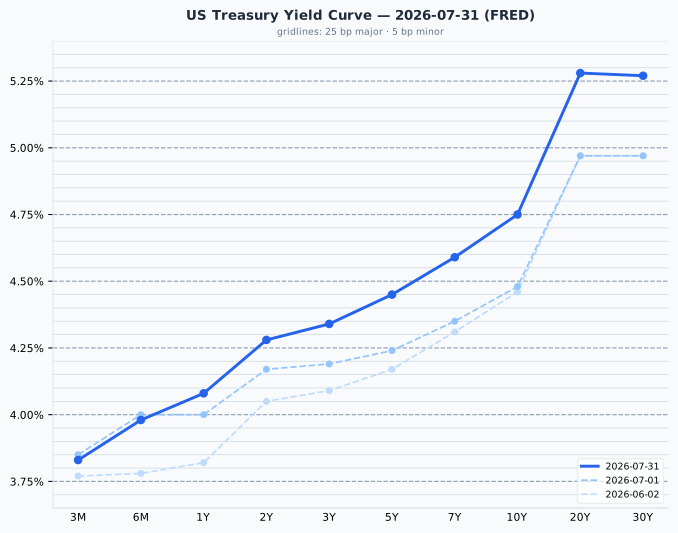
The US curve is upward-sloping across nearly its full length, with a marginal 1bp kink between the 20-year (5.28%) and 30-year (5.27%) — negligible and likely measurement noise rather than a genuine inversion signal. Overall this remains a "normal," modestly steep shape historically associated with an economy not signalling imminent recession. Versus one month ago (1 July 2026), yields are higher across the curve — the 10-year has risen about 27bps (4.48% → 4.75%) and the 2-year about 11bps (4.17% → 4.28%) — a bear-steepening move consistent with the market pricing less imminent Fed easing even as inflation stays above target.
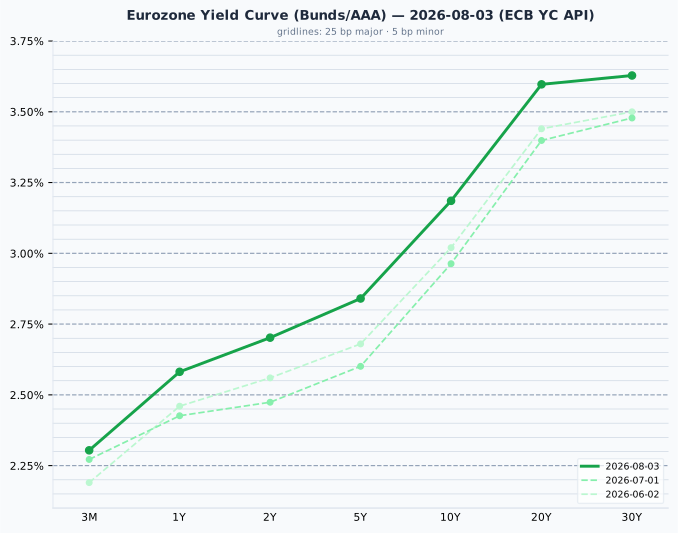
The Eurozone AAA curve is also upward-sloping throughout, steeper in the belly-to-long end than the front end — typical of a curve with policy rates well below long-run neutral expectations. Versus one month ago (3 July 2026), the curve has shifted higher across all maturities — the 10-year is up about 22bps (2.96% → 3.19%) and the 2-year up about 23bps (2.47% → 2.70%) — a broadly parallel upward shift rather than a change in shape.
Credit Markets (from FRED — authoritative)
| Market | OAS Spread | Series ID |
|---|---|---|
| US Investment Grade | 79 bps | BAMLC0A0CM |
| US High Yield | 285 bps | BAMLH0A0HYM2 |
| Euro High Yield | 265 bps | BAMLHE00EHYIOAS |
Both US investment grade (79bps, just under the 80-150bps normal range) and US high yield (285bps, below the 300-500bps normal band) are trading historically tight — credit markets are pricing very little near-term default or stress risk, consistent with today's broad risk-on equity move and a VIX at 15.9, in the low half of its "moderate" band. Euro high yield (265bps) is similarly tight. This complacency in credit is worth watching alongside the stretched US equity valuation picture: both markets are currently priced for a benign outcome.
Bond Portfolio Implications
The US equity risk premium is negative (−1.14%, computed above) — Treasuries currently out-yield the S&P 500's earnings yield, a historically uncommon setup that has often preceded weaker forward equity returns relative to bonds. Europe's equity risk premium, by contrast, is a healthy +2.07%, giving European equities a real valuation cushion that US equities currently lack. With the 10-year Treasury at 4.75% and real yields (DFII10) at 2.47%, government bonds offer a genuine income alternative to expensive US equities for the first time in a while. Duration risk remains material either way: a 100bp rise in yields would imply roughly an 8-9% price loss on a 10-year bond, so investors reaching for that yield should be comfortable with rate volatility, not just credit and equity risk.
Currencies & Commodities
Currencies:
| Pair | Rate | Source |
|---|---|---|
| EUR/USD | 1.1519 | FRED DEXUSEU |
| USD Index | 119.70 | FRED DTWEXBGS |
| USD/JPY | 156.55 | web search |
| GBP/USD | 1.3460 | web search |
| USD/CHF | 0.8090 | web search |
Commodities (all from yfinance front-month futures):
| Commodity | Price | Day Chg % | Ticker | Source |
|---|---|---|---|---|
| Brent Crude | $79.36/bbl | −5.26% | BZ=F | yfinance |
| WTI Crude | $75.77/bbl | −5.69% | CL=F | yfinance |
| Gold ($/oz) | $4,152.60 | +1.52% | GC=F | yfinance |
| Silver ($/oz) | $60.245 | +4.13% | SI=F | yfinance |
| Copper ($/lb) | $6.6445 | +1.59% | HG=F | yfinance |
| Nat Gas ($/MMBtu) | $2.682 | −3.56% | NG=F | yfinance |
WTI and Brent both settled sharply lower (−5.7% and −5.3%) on hopes for a Strait of Hormuz de-escalation deal, the single biggest cross-asset driver of the day; both extended their declines into the settle from where they stood mid-session. WTI at $75.77/bbl is 48.6% below its all-time high of $147.27/bbl (52-week range: $54.98–$119.48) and Brent at $79.36/bbl is 46.2% below its own $147.43/bbl peak — both firmly in a lower, post-spike trading range rather than "near highs" territory.
Gold settled up 1.5% at $4,152.60/oz, 25.7% below its all-time high of $5,586.20 — a level reached within just the past 52 weeks, meaning gold has round-tripped a meaningful correction inside the last year without recovering that ground. Silver shows a similar pattern in more extreme form: up 4.1% on the day to $60.245/oz, but still 50.3% below its own recent all-time high of $121.30. Copper, by contrast, settled essentially at its all-time high ($6.6445 vs. an ATH of $6.6525, within 0.2%) — quietly the strongest chart among the commodity complex, consistent with the broader risk-on, growth-positive tone. Natural gas fell 3.6% to $2.682/MMBtu and remains 83% below its $15.78 all-time high, a spike-driven historical outlier not indicative of current market conditions.
Crypto: no notable Bitcoin or Ethereum moves above 3% today.
Sector & Theme Highlights
AI-hyperscaler strength (Meta, Alphabet, Microsoft, Amazon) is the clearest single-stock theme driving Nasdaq 100 outperformance (+3.32% on the day) relative to the more value-tilted Dow (+1.71%). Geopolitical de-escalation — hopes for a Strait of Hormuz shipping deal — is the dominant cross-asset theme, simultaneously lifting equities, sinking oil, and likely supporting bonds on reduced inflation-risk premium. Europe's synchronized record highs across STOXX 600, CAC 40 and DAX suggest the rally is not purely a US AI story but a broader global risk-on move this week. Within commodities, the split between a resurgent copper (near record highs, a growth-sensitive read-through) and a battered oil complex (down sharply on supply-risk de-escalation) tells two different stories about the same day's news.
Top Stories (Global)
- Hopes for a deal to revive Strait of Hormuz shipping lifted stocks toward record highs and sent oil sinking, as investors bet mediators can avert US airstrikes on Iran.
- The Dow Jones closed at a fresh all-time high (53,178.41 on 3 Aug) and extended that on 4 Aug to a record close of 54,085.88, after peaking at 54,272.60 intraday.
- AI hyperscalers rallied sharply into this move — Meta, Alphabet, Microsoft and Amazon all posted gains in the mid-to-high single digits, lifting the Nasdaq 100.
- Japan's 10-year JGB yield climbed to ~2.85% after a weak government bond auction, extending an uptrend on fiscal-health and BOJ rate-path concerns.
- The BOJ held its policy rate at 1.00% at its July 2026 meeting after a 25bp hike in June, warning that core inflation is likely to run "clearly above" 2% from H2 FY2026 — a hawkish bias even while pausing.
- AMD beat after the close, reporting Q2 revenue of $11.5bn (+50% y/y) and non-GAAP EPS of $1.66 against a ~$1.55 consensus, with data centre revenue more than doubling to $6.7bn and Q3 guidance of ~$13bn; the shares nonetheless fell in after-hours trade.
- SpaceX's first quarterly results as a public company also beat: revenue rose 92% to $7.8bn versus a ~$6.8bn consensus, the net loss narrowed to $541m, and Starlink contributed $4.3bn on 12 million subscribers. Capital expenditure of $18.4bn in the quarter far exceeded expectations, and the stock fell as much as ~8% after hours before paring the decline.
- Credit markets remain historically tight (US IG ~79bps, US HY ~285bps, Euro HY ~265bps) even as US equity valuations sit at a multi-decade premium — two markets currently priced for very different outcomes.
Looking Ahead
Key events in the next 1-5 trading days: - Earnings: both 4 Aug after-the-close reports have landed (AMD and SpaceX — see Top Stories); each beat on revenue yet sold off after hours, so the follow-through in the 5 Aug session is the thing to watch, particularly for AI-hardware sentiment after AMD's data-centre beat. - Central banks: BOJ has signalled a hawkish bias (core inflation seen running "clearly above" 2% from H2 FY2026) after holding at 1.00% in July — watch for further commentary on the rate path. No FOMC or ECB meetings in the immediate 1-5 day window. - Bond supply/auctions: Japan's weak 10-year JGB auction (yields up to ~2.85%) is worth monitoring for follow-through in subsequent auctions. - Market closures (from holiday calendar, next 5 dates across US, GB, DE, FR, JP, AU, CH, CA, KR, BR, IN): - 11 Aug 2026 — Japan: Mountain Day (market closed) - 15 Aug 2026 — France: Assumption Day (market closed) - 17 Aug 2026 — South Korea: Liberation Day (market closed) - 31 Aug 2026 — UK: Summer Bank Holiday (market closed) - 7 Sep 2026 — US, Canada, Brazil: Labour Day / Independence Day (US and Canada markets closed; Brazil is a public holiday but exchange-specific closure not separately confirmed) - India's 2026 holiday calendar could not be retrieved, so no India closures could be confirmed for the period above.