2026 06 30
Global Financial Briefing — Tuesday, 30 June 2026
Quarter-end — final trading day of Q2 2026.
Market Overview
Global equity markets closed out the second quarter on a broadly positive note, with US technology stocks leading the charge as quarter-end rebalancing and portfolio window dressing drove flows into outperforming names. The Nasdaq 100 surged +1.68% to close near its 52-week high, while the S&P 500 gained +0.79%, bringing both indices to within 2% of their annual peaks. European markets also finished the day in positive territory, with the DAX (+1.50%) and Euro STOXX 50 (+1.55%) posting strong session gains, while the Euro STOXX 600 inched to within 0.3% of its 52-week high. The Nikkei 225 extended its remarkable multi-year run, adding another +0.86% to close above 70,000.
The dominant macro concern for investors heading into Q3 is the re-acceleration of US headline inflation. FRED data shows CPI YoY rising to 4.17% in May 2026 — the highest reading since mid-2022 — up sharply from 3.78% in April and 2.39% in January. Tariff pass-through to consumer prices is the primary suspected driver; core CPI, which excludes food and energy, remains more contained at 2.82% YoY. This bifurcation puts the Federal Reserve in a difficult position: the Fed Funds target stands at 3.50–3.75% (reflecting significant cuts from the 2023–24 peak), yet headline inflation is running at twice the 2% mandate target. Credit markets appear remarkably sanguine about this risk — US High Yield OAS at 280 bps is below its historical "normal" range, suggesting markets are pricing near-perfect outcomes.
Geopolitical risk kept a lid on equity gains and supported energy market caution. Iran reiterated its intent to exercise control over the Strait of Hormuz, and talks with US Secretary of State Rubio are due in Doha. A key corporate story was Alphabet's debut as a Dow component (+4.8%), Rocket Lab's announced $8 billion acquisition of Iridium, and a sharp fall in Super Micro Computer (-8%) following a Taiwan regulatory raid. On a central bank note, the Bank of Japan raised its policy rate to 1.00% on June 16 — the highest level since 1995 — but the yen remains weak at USD/JPY 161.93, signalling that the rate differential with the US still dominates yen dynamics. Market fear gauges remain subdued: the VIX closed at 17.65 (FRED VIXCLS, Jun 29) — the moderate 15–20 range — down from 19.49 the prior week, consistent with the quarter-end risk-on tone but not signalling complacency.
Global Indices Snapshot
All markets confirm today's (30 Jun) session data via regularMarketTime.
Americas
Americas data reflects today's close (30 Jun).
| Index | Level | Day Chg | Day Chg % | Source |
|---|---|---|---|---|
| S&P 500 | 7,440.43 | +58.93 | +0.79% | FRED SP500 (Jun 29) + yfinance ^GSPC |
| Nasdaq 100 | 30,276.35 | +501.60 | +1.68% | yfinance ^NDX |
| Dow Jones | 52,319.20 | +136.46 | +0.26% | yfinance ^DJI |
| Brazil IBOV | 172,024 | −1,181 | −0.68% | yfinance ^BVSP |
Note: S&P 500 level shown is FRED's authoritative Jun 29 close; yfinance ^GSPC shows today's intraday close at 7,499 (+0.79%).
Europe
European data reflects today's close (30 Jun).
| Index | Level | Day Chg | Day Chg % | Source |
|---|---|---|---|---|
| Euro STOXX 600 | 641.73 | +5.62 | +0.88% | yfinance ^STOXX |
| Euro STOXX 50 | 6,328.09 | +96.46 | +1.55% | yfinance ^STOXX50E |
| CAC 40 | 8,403.99 | +36.66 | +0.44% | yfinance ^FCHI |
| DAX | 24,995.81 | +368.92 | +1.50% | yfinance ^GDAXI |
| FTSE 100 | 10,497.12 | +12.90 | +0.12% | yfinance ^FTSE |
| SMI (Swiss) | 14,193.92 | −29.98 | −0.21% | yfinance ^SSMI |
Asia-Pacific
Asia-Pacific data reflects today's close (30 Jun).
| Index | Level | Day Chg | Day Chg % | Source |
|---|---|---|---|---|
| Nikkei 225 | 70,062.32 | +594.21 | +0.86% | yfinance ^N225 |
| Hang Seng | 22,881.02 | −145.66 | −0.63% | yfinance ^HSI |
| Shanghai Comp | 4,094.40 | +20.50 | +0.50% | yfinance 000001.SS |
| ASX 200 | 8,778.70 | −44.70 | −0.51% | yfinance ^AXJO |
| Kospi (Korea) | 8,476.48 | +81.83 | +0.97% | yfinance ^KS11 |
Emerging Markets
EM data reflects today's close (30 Jun).
| Index | Level | Day Chg % | Source |
|---|---|---|---|
| MSCI EM (EEM) | 68.41 | +1.45% | yfinance EEM |
| India Nifty 50 | 23,865.75 | −0.34% | yfinance ^NSEI |
| South Africa | (not retrieved) | — | yfinance ^J203 (404 error) |
Index Valuations & Investment Risk
Valuation Table
| Index | Trailing P/E (live) | Hist avg trailing P/E (†) | Premium vs hist avg | Earnings Yield |
|---|---|---|---|---|
| S&P 500 | 26.75x (SPY) | ~16–18x | +57% ⚠️ | 3.74% |
| Nasdaq 100 | 33.81x (QQQ) | ~25–30x | +23% ⚠️ | 2.96% |
| Euro STOXX 600 | 18.30x (EXSA.DE) | ~15–17x | +14% | 5.46% |
| CAC 40 | 17.58x (CAC.PA) | ~14–16x | +17% | 5.69% |
| DAX | 18.25x (EXS1.DE) | ~15–17x | +14% | 5.48% |
| FTSE 100 | 17.71x (ISF.L) | ~13–15x | +26% ⚠️ | 5.65% |
| Nikkei 225 | 23.87x (1321.T) | ~20–22x | +14% | 4.19% |
| MSCI EM | 18.11x (EEM) | ~13–15x | +29% ⚠️ | 5.52% |
(†) Historical average trailing P/E: decade-scale reference constants. Shiller CAPE: (not retrieved — requires separate data source).
Premium computed as (live trailing P/E ÷ hist avg midpoint − 1) × 100%. ⚠️ = >20% above historical average.
Investment Risk Assessment for ETF Investors
United States (S&P 500 / Nasdaq ETFs)
The S&P 500's trailing P/E of 26.75x sits 57% above its long-run average of ~17x — in the "historically stretched" zone. The Equity Risk Premium (ERP) is negative: earnings yield of (1÷26.75) = 3.74% minus the US 10Y Treasury yield of 4.38% (FRED DGS10, Jun 29) gives an ERP of −0.64%. Bonds are currently offering a higher yield than US equities on an earnings basis — a historically unusual and important warning signal for future equity returns. The 10-year TIPS real yield stands at 2.16% (FRED DFII10, Jun 29), maintaining a high real risk-free rate that compresses fair-value equity multiples.
The S&P 500 is within 2% of its 52-week high (7,621) and trades well above both its 50-day MA (7,371) and 200-day MA (6,930), reflecting strong momentum. Nasdaq 100 at 30,276 is similarly within 2% of its 52-week high (30,762). The Nasdaq's trailing P/E of 33.81x remains elevated relative to its own history (~27.5x midpoint), at a 23% premium. At current valuations, the margin of safety for US large-cap equities is thin.
Risk score: High valuation risk — negative ERP, stretched P/E multiples, real yields elevated.
Europe (STOXX 600 / CAC 40 / DAX ETFs)
European equities present considerably better relative value. Euro STOXX 600 at 18.30x trailing P/E and CAC 40 at 17.58x are both trading at modest premiums to their historical averages (14–17%), while earnings yields of ~5.5% generate a meaningful positive ERP against the German 10Y Bund at 2.86% (web search, Jun 29). The implied EUR ERP for STOXX 600 is approximately (1÷18.30) − 2.86% = +2.60% — healthy by historical standards. The P/E discount to the S&P 500 is approximately 32%, an unusually wide gap.
The Euro STOXX 600 is at 641.73, virtually at its 52-week high (643.55) and above both moving averages (MA50: 622, MA200: 598). The DAX is 2% below its 52-week high and also well above its moving averages. The ECB deposit rate at 2.25% (FRED ECBDFR) and the EUR/USD at 1.1403 (FRED, Jun 26) introduce currency risk for non-EUR investors. The OAT-Bund spread at approximately 69 bps (most recent data from May 22, 2026) remains a key watch indicator for French fiscal risk; the CAC 40 discount to DAX may reflect this.
Risk score: Moderate — fair value vs European norms, attractive vs US, currency and political risk remain.
Japan (Nikkei / TOPIX ETFs)
The Nikkei at 70,062 has surged dramatically over the past year (52-week range: 39,289–72,832). Trailing P/E of 23.87x is 14% above the ~21x historical average. The BOJ's rate hike to 1.00% (June 16) introduces cost-of-capital headwinds for Japanese equities, but corporate governance reforms and continued earnings improvement support the structural bull case. USD/JPY at 161.93 means unhedged foreign investors in Japanese equities face significant currency headwinds if the yen eventually normalises. The BOJ has signalled further hikes toward a neutral rate of ~2%, which could put significant pressure on levered Japanese equities over the next 12–18 months.
Risk score: Moderate — improving fundamentals but elevated valuations and BOJ policy risk.
Emerging Markets (MSCI EM ETFs)
MSCI EM (EEM) at 18.11x trailing P/E is 29% above its historical average — the largest premium in this briefing relative to its own history. The EEM ETF at $68.41 is 4.4% below its 52-week high of $71.57. Positive ERP of approximately (1÷18.11) − 4.38% (using US 10Y as proxy) = +1.14%, though local EM rates vary significantly. China's weight in the index, combined with ongoing US-China tensions (as highlighted by the SMCI Nvidia chip-smuggling case), creates material event risk. Currency weakness in several EM economies is an additional concern for USD-based investors.
Risk score: Moderate — positive ERP but elevated P/E vs own history, China and geopolitical risks.
Disclaimer: This is financial information, not personalised investment advice. Past valuations do not guarantee future returns. Consult a financial advisor before investing.
US Economic Indicators (FRED — authoritative)
| Indicator | Current | Prior | Delta | Reference Date | FRED Series |
|---|---|---|---|---|---|
| CPI YoY % | 4.17% | 3.78% | +0.39pp | May 2026 | CPIAUCSL |
| Core CPI YoY % | 2.82% | 2.74% | +0.08pp | May 2026 | CPILFESL |
| Unemployment Rate | 4.3% | 4.3% | 0.0pp | May 2026 | UNRATE |
| Nonfarm Payrolls | 159,001K | 158,829K | +172K | May 2026 chg | PAYEMS |
| 10Y TIPS Real Yield | 2.16% | Jun 29, 2026 | DFII10 |
Key observation — CPI re-acceleration: Headline CPI has surged from 2.39% in January 2026 to 4.17% in May 2026 — a 178 bp rise in four months. The core vs headline divergence (4.17% vs 2.82%) points to energy and food prices as primary drivers, likely reflecting tariff pass-through on goods. The labour market remains stable: unemployment has been flat at 4.3% for three consecutive months and May payrolls added 172K jobs. NFP at +172K is slightly above the ~150K monthly average needed to absorb labour force growth. The real yield of 2.16% represents a meaningful positive real return on risk-free assets, which historically compresses equity valuations.
Other economic releases today (June 30, 2026):
- MNI Chicago PMI (Jun) — released today; specific reading not retrieved, but the index tracks US manufacturing activity.
- Conference Board Consumer Confidence (Jun) — released today; not retrieved.
- UK Shop Price Inflation (Jun): +1.2% YoY (actual) vs +1.3% consensus — slight downside miss; food inflation at 2.4%.
- Japan Industrial Production (May m/m): +0.5% (positive rebound); YoY: −1.7%, first year-over-year decline in six months, a slight concern for Japan's industrial recovery.
Fixed Income & Bond Analysis
All US Treasury yields from FRED (as of Jun 29, 2026). European yields from web search.
Policy Rates
| Central Bank | Rate | Source |
|---|---|---|
| Fed Funds (upper) | 3.75% | FRED DFEDTARU (Jun 30) |
| Fed Funds (lower) | 3.50% | FRED DFEDTARL (Jun 30) |
| Effective FFR | 3.63% | FRED DFF (Jun 29) |
| ECB Deposit Rate | 2.25% | FRED ECBDFR (Jun 30) |
| BOJ Policy Rate | 1.00% | web search (raised Jun 16, 2026) |
| BOE Bank Rate | ~3.73% | FRED IUDSOIA/SONIA (Jun 26) |
Government Bond Yields
| Country | 2Y Yield | 10Y Yield | 30Y Yield | Source |
|---|---|---|---|---|
| USA | 4.10% | 4.38% | 4.86% | FRED (Jun 29) |
| Germany | (n/r) | 2.86% | (n/r) | web search (Jun 29) |
| France | (n/r) | (n/r) | (n/r) | web (not retrieved) |
| UK | 4.18% | 4.76% | (n/r) | web search (Jun 18) |
| Japan | (n/r) | 2.61% | (n/r) | web search (late Jun) |
| Italy | (n/r) | (n/r) | (n/r) | web (not retrieved) |
(n/r) = not retrieved.
OAT-Bund Spread: ~69 bps (most recent data from May 22, 2026; not retrieved for Jun 30). This remains an important indicator of French fiscal risk; a widening above 80–100 bps would signal renewed market concern about French public finances.
BTP-Bund Spread (Italy): ~75 bps (most recent data from June 5, 2026; not retrieved for Jun 30). Relatively contained versus the 200+ bp stress levels of the 2022 era.
Yield Curve Spreads (FRED pre-computed)
- 10Y-2Y spread: +30 bps (FRED T10Y2Y, Jun 30) — curve is normalised but flat. A positive 10Y-2Y spread means the curve is no longer inverted, but at only +30 bps it remains well below the ~75 bps threshold historically associated with a "normal" upward slope. The curve has steepened notably from the deep inversion seen in 2023–24.
- 10Y-3M spread: +57 bps (FRED T10Y3M, Jun 30) — positive, removing the short-end inversion that had historically been the most reliable recession predictor. Both spreads turning positive is a constructive signal for the medium-term economic outlook, though the pace of steepening is gradual.
The current curve shape reflects a market pricing in gradual Fed rate cuts over the coming year (2Y at 4.10% vs Fed Funds at 3.63% effective) while long-end yields remain elevated (10Y at 4.38%, 30Y at 4.86%), likely due to concerns about US fiscal deficits and the re-acceleration of inflation.
Yield Curve Charts
US Treasury Yield Curve (FRED — as of Jun 29, 2026)
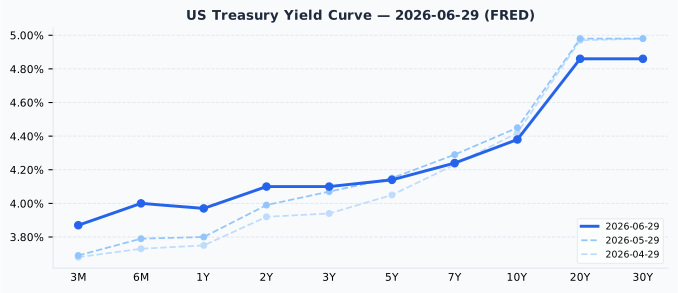
The current US curve (Jun 29) is positively sloped, with a pronounced upward tilt from the 2Y (4.10%) through the 30Y (4.86%), though still relatively flat in the belly (3M–2Y range compresses from 3.87% to 4.10%). Compared to one month prior (May 29), yields have risen modestly across the 2Y–10Y segment (+11–17 bps), likely reflecting the CPI re-acceleration data. Compared to two months prior (April 29), the curve has shifted upward by approximately 20–40 bps across maturities, with the move most pronounced at the intermediate tenors (5Y: +9 bps, 10Y: −4 bps — essentially flat vs April). The very long end (20Y/30Y) remains anchored.
Sanity check: 3M yield (3.87%) is 24.5 bps above the Fed Funds target midpoint (3.625%) — within the ~25 bps normal range.
Eurozone Yield Curve — ECB YC API — last available Jun 23, 2026
Note: ECB YC API returned HTTP 503 today (Jun 30). Chart uses most recent available ECB data (Jun 23). Values may not reflect Jun 30 market closes.
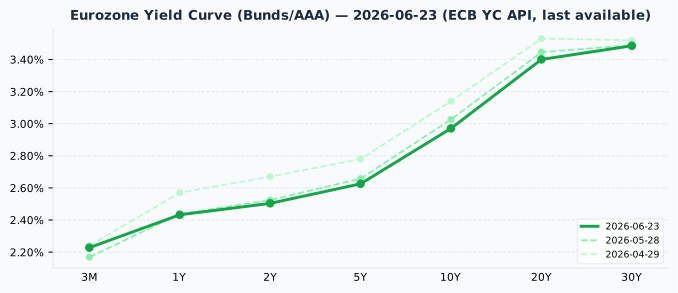
The Eurozone curve (Jun 23) shows a normal upward slope from 3M (2.23%) to 30Y (3.49%). The 10Y point at 2.97% is consistent with the web-search Bund yield of 2.86% on June 29 (small lag). Compared to one month ago (May 28), ECB yields are marginally lower at the short end (3M: 2.17% vs 2.23% now) but very similar in the 5Y–30Y range, suggesting the eurozone curve is broadly stable. Versus two months ago (April 29), yields have fallen across all maturities — the 10Y is 17 bps lower (2.97% vs 3.14%), reflecting ECB rate cuts and easing financial conditions.
Credit Markets (from FRED — authoritative)
| Market | OAS Spread | In Basis Points | FRED Series |
|---|---|---|---|
| US Investment Grade | 0.76% | 76 bps | BAMLC0A0CM (Jun 29) |
| US High Yield | 2.80% | 280 bps | BAMLH0A0HYM2 (Jun 29) |
| Euro High Yield | 2.65% | 265 bps | BAMLHE00EHYIOAS (Jun 29) |
Interpretation: Credit spreads are at historically tight levels. US High Yield at 280 bps is below the long-run "normal" range of 300–500 bps — a level not seen for sustained periods outside of late-cycle euphoria (pre-GFC 2006–07, pre-COVID 2019). US IG at 76 bps sits just below the low end of the 80–150 bps normal range. Euro HY at 265 bps is similarly compressed. These levels suggest credit markets are pricing in an extremely benign default/stress environment, despite headline CPI at 4.17% and a Fed that may need to delay further cuts. Tight spreads historically represent complacency risk; a spread normalisation to 400 bps HY / 120 bps IG would represent significant market turbulence.
Bond Portfolio Implications
Equity Risk Premium (ERP):
- S&P 500 ERP: (1÷26.75) − 4.38% = 3.74% − 4.38% = −0.64% — bonds yielding more than US equities. This is the "reverse ERP" condition historically associated with elevated forward equity risk.
- Euro STOXX 600 ERP: (1÷18.30) − 2.86% = 5.46% − 2.86% = +2.60% — healthy positive spread, European equities offer meaningful excess return over Bunds.
- Nikkei 225 ERP: (1÷23.87) − 2.61% = 4.19% − 2.61% = +1.58% — positive but narrowing as BOJ rate hikes push JGB yields higher.
Duration risk: With the US 10Y at 4.38%, a 100 bps rise in yields would imply approximately 8–9% price loss on a 10-year duration bond. The re-acceleration of CPI to 4.17% creates genuine upside risk to yields, particularly if the Fed signals a pause in the cutting cycle. Short-duration bonds (2Y at 4.10%) offer attractive carry with lower price sensitivity. Long-duration bonds (30Y at 4.86%) offer the highest coupon but maximum interest rate risk.
⚠️ Markdown notation note for downstream processing: All ERP calculations above use (1÷x) notation for reciprocal fractions.
Currencies & Commodities
Currencies:
| Pair | Rate | Source |
|---|---|---|
| EUR/USD | 1.1403 | FRED DEXUSEU (Jun 26) |
| USD Index | 120.89 | FRED DTWEXBGS (Jun 26, Jan 2006=100) |
| USD/JPY | 161.93 | web search (Jun 30) |
| GBP/USD | 1.3194 | web search (Jun 26 approx) |
| USD/CHF | 0.8074 | web search (Jun 21 approx) |
The broad dollar index at 120.89 (Jan 2006=100) reflects a dollar that remains elevated versus its 2006 base but has softened in 2026 as the Fed cuts rates. EUR/USD at 1.1403 shows the euro strengthening as ECB rates have stabilised at 2.25%. USD/JPY at 161.93 is notable — despite the BOJ hiking to 1.00%, the yen remains historically weak, held down by the 2.63% interest rate differential between the US and Japan. GBP/USD at 1.3194 reflects sterling resilience; USD/CHF at 0.8074 shows the Swiss franc significantly stronger than a year ago.
Commodities (all from yfinance MCP front-month futures):
| Commodity | Price | Day Chg % | vs ATH | Ticker | Source |
|---|---|---|---|---|---|
| Brent Crude | $73.37/bbl | −0.73% | 50.2% below $147.43 | BZ=F | yfinance |
| WTI Crude | $70.03/bbl | −1.02% | 52.5% below $147.27 | CL=F | yfinance |
| Gold ($/oz) | $4,021.80 | −0.42% | 28.0% below $5,586 | GC=F | yfinance |
| Silver ($/oz) | $59.05 | +0.70% | 51.3% below $121.30 | SI=F | yfinance |
| Copper ($/lb) | $6.247 | +1.35% | 6.1% below $6.65 | HG=F | yfinance |
| Nat Gas ($/MMBtu) | $3.257 | +2.39% | 79.4% below $15.78 | NG=F | yfinance |
Oil (WTI $70.03, Brent $73.37) is declining modestly today, with both benchmarks more than 50% below their all-time highs, reflecting weaker global demand sentiment despite Iran's Strait of Hormuz rhetoric. The 52-week range for WTI ($54.98–$119.48) shows an enormous range; current prices in the $70 zone represent the lower half of this band.
Gold at $4,021.80 is 28.0% below its all-time high of $5,586.20 (which was also the 52-week high). Gold pulled back from that earlier peak, likely as real yields and the USD stabilised. The current level represents a meaningful correction. Silver at $59.05 is 51.3% below its all-time high of $121.30 — also its 52-week high — a large gap that suggests the earlier precious-metals surge has significantly reversed.
Copper at $6.247/lb is 6.1% below its all-time high of $6.6525, also its 52-week high. Copper is rising today (+1.35%) and remains in the upper portion of its one-year range ($4.32–$6.65), reflecting ongoing industrial demand, particularly for electrification. Natural gas gained +2.39% and remains within its 52-week band ($2.48–$7.83), though well below its historic highs.
Crypto: No notable moves exceeding 3% threshold — omitted.
Sector & Theme Highlights
Best performing today: Technology (Nasdaq +1.68%), AI-linked semiconductors, German industrials (DAX +1.50%), Euro STOXX 50 (+1.55%). Alphabet's addition to the Dow brought significant institutional demand.
Underperformers: Brazil IBOV (−0.68%), Hang Seng (−0.63%), India Nifty 50 (−0.34%), Swiss SMI (−0.21%).
Key cross-market themes:
-
AI / Technology resurgence: Quarter-end tech buying drove Nasdaq near all-time highs. Alphabet's Dow inclusion ($GOOGL) signals the mainstreaming of AI-adjacent investing. However, SMCI's 8% drop on Taiwan raids underscores ongoing regulatory risk in the AI chip supply chain.
-
Tariff-driven inflation: The CPI spike to 4.17% in May (from 2.4% in February) reflects tariff pass-through on goods. The Fed's dilemma is acute — having cut rates significantly in 2025, it now faces resurging inflation without clear political space to hike.
-
BOJ normalisation: Japan's rate hike to 1.00% is its most aggressive monetary tightening in 30 years. The carry trade in JPY (borrowing yen to buy USD or other assets) faces gradual headwinds, but the 161.93 USD/JPY rate suggests carry unwind has not yet accelerated.
-
European outperformance: European equities are near multi-year highs with significantly better relative value than US peers. ECB at 2.25% (still accommodative), positive ERP, and improving earnings quality support European equities as a potential rotation target.
-
Credit complacency: HY OAS at 280 bps signals that credit markets are ignoring the inflation risk and potential for Fed policy tightening. This divergence between credit spreads and macro conditions is a key risk to watch in Q3.
-
Energy geopolitics: Iran/Hormuz risk remains live. Oil below $75 suggests markets are not yet pricing a major disruption, but any escalation could see rapid repricing. Defence-sector demand (separate from energy) remains elevated across European defence contractors.
Top Stories (Global)
-
Tech recovery drives quarter-end rally: The Nasdaq 100 and S&P 500 bounced sharply on the final day of Q2 2026, with tech stocks reversing a five-day losing streak as quarter-end rebalancing flows dominated. Calmer US-Iran headlines contributed.
-
Alphabet joins the Dow (+4.8%): Google's parent became a Dow Jones Industrial Average component today, replacing an undisclosed member. Its 4.8% gain contributed significantly to the Dow's positive session.
-
Rocket Lab to acquire Iridium for $8 billion: The space and satellite launch company announced a transformative acquisition of the low-earth orbit communications provider, representing one of the largest aerospace M&A deals of 2026.
-
Super Micro Computer falls 8% after Taiwan raid: Taiwanese authorities raided SMCI's offices over alleged Nvidia chip smuggling to China. The action highlights continued enforcement risk in the US-China semiconductor restrictions framework.
-
Concentrix tumbles 22% on earnings miss: The technology services company missed Q2 estimates and cut its full-year 2026 guidance, sending shares sharply lower amid concerns about IT services demand.
-
Iran reasserts Hormuz control; US warns on tolls: Senior Iranian officials reaffirmed Tehran's intent to control Strait of Hormuz passage. US Secretary of State Rubio said any tolls would be unacceptable. Doha talks are scheduled.
-
BOJ hike recap: The Bank of Japan's June 16 rate hike to 1.00% — a 25 bps increase — marks the first time the BOJ has been at this level since 1995. Board members signalled further moves toward a neutral rate of ~2%, though the pace remains cautious.
Looking Ahead
Key events — next 1–5 trading days:
1 Jul (Wed): - Canada Day — TSX closed (from holiday calendar: CA 2026-07-01) - Global PMI manufacturing data (usually released on the first business day of the month) - Eurozone HICP Flash Estimate for June 2026 (typically released early month)
2 Jul (Thu): - US ADP Employment (private payrolls preview for June) - US ISM Services PMI (June) - FOMC minutes from most recent meeting (varies)
3 Jul (Fri): - US markets closed — Independence Day (observed) (from holiday calendar: US 2026-07-03) - US Non-Farm Payrolls (June) — major market-moving release; look for reaction in Asian and European sessions Monday
4 Jul (Sat): Weekend. No trading.
7 Jul (Mon): - Markets re-open post long weekend; any NFP reaction/follow-through - Potential BOJ monetary policy commentary following June rate hike
Geopolitical watch: Iran-US talks in Doha are a critical near-term event. Any breakdown could cause a rapid oil spike. Watch Brent at $73.37 — a move above $85 would start to have meaningful macro and inflation implications.
Q3 2026 macro focus: CPI trajectory following the May 4.17% print is the dominant Q3 theme. A June CPI release (typically mid-July) showing whether the re-acceleration continued or reversed will be critical for Fed guidance.
Sources: FRED (Federal Reserve Bank of St. Louis); yfinance MCP; ECB Yield Curve API (unavailable Jun 30 — chart uses Jun 23 data); web searches for European yields, FX, BOJ rate, and market news. All data as of 30 June 2026 unless stated. Holiday data from the Nager.Date API.