2026 09 18
Global Financial Briefing — Friday, 18 September 2026
Americas index levels, commodities and day changes reflect the 18 September closing print. The US Treasury curve is the settled 18 September close; the euro AAA curve remains the 17 September curve, the most recent published. FX and macro figures are dated inline.
Market Overview
Thursday's respite in Treasuries lasted one session. The 10-year closed at 5.01% (US Treasury par curve, 18 September), +7 bp on the day, exactly reversing Thursday's rally to 4.94% and retouching Wednesday's 5.01% high, the highest since 2007, at the end of an eight-session rise; the 5-year closed at 4.86% (+8 bp), the 30-year at 5.34% (+5 bp) and the 13-week bill at 4.14% (+2 bp). Bloomberg's account is that the move is energy: Saudi Aramco has told at least two European refiners they will receive no crude next month after the attack on the East-West pipeline, satellite imagery shows three of its pumping stations damaged with no repair timeline, and Saudi Arabia and the Houthis exchanged cross-border strikes on Thursday (Trading Economics, CNBC), so the market is again pricing energy costs into inflation and inflation into the further Fed hike that 16 of 18 dot-plot participants pencilled in on Wednesday. Equities did not follow the yields lower into the close: the S&P 500 reversed an intraday loss to finish at 7,650.50 (+0.17%), the Nasdaq 100 also reversed to close at 29,644.17 (+0.67%), and the Dow pared its decline to close at 51,682.64 (−0.18%), with more than 350 S&P 500 names down and chipmakers up for a second session after Thursday's 3% gain (Bloomberg), on a quadruple-witching day that added the expected swings into the close. The data leaned the same way as the yields had earlier: industrial production was flat in August against +0.3% expected, manufacturing output fell 0.3% to end a seven-month run of gains, and capacity utilisation held at 76.3% (Federal Reserve G.17, Trading Economics). Week to date the S&P 500 is 0.08% lower and the Dow 1.69% lower, while the Nasdaq 100 is 0.94% higher; the dollar is heading for its best week since May (Bloomberg), the ICE dollar index at 100.40 (+0.15% today), and bitcoin has passed $80,000.
Europe had a worse day than the US, and it was a rates day as much as an equity one. The Euro STOXX 50 fell 1.37% to 6,236.20, its lowest in nearly two months, the STOXX 600 1.11% to 635.45, its largest fall since 9 September (−1.41%), the DAX 1.60% to 25,304.06, its lowest since late July, the CAC 40 1.49% to 8,065.02, the SMI 1.15% to 13,786.72 and the FTSE 100 1.45% to 10,659.13. The banks led the fall (Santander, BNP Paribas and Deutsche Bank all more than 3% lower; in London Barclays and Lloyds about 2.5% and HSBC 1.5%), the German carmakers fell hardest (Volkswagen −5.5%, Mercedes-Benz −4.5%, BMW −4.2%), Deutsche Telekom lost 4.1% on a negative analyst note on Orange, and the miners fell with metals and oil (Glencore −4%, Rio Tinto −1.7%); ASML (+1.5%) and Infineon (+2.7%) were the exceptions, on the same semiconductor bid as New York (Trading Economics). Behind it, the euro-area sovereign curve sold off with the periphery and France worst: the 10-year Bund rose 4 bp to 3.52% (Tuesday's 3.57% was its highest since June 2009), the 2-year 5 bp to 3.26%, the 10-year BTP 9.5 bp to 4.44% and the 10-year OAT 12 bp to 4.57%, which puts the OAT-Bund spread at about 105 bp, from 96 bp on Thursday, and the OAT 13 bp above the BTP, from 10 bp above it on Thursday. That is the widest the French spread has been in the September briefings, and it has come without a French event: the driver reported is the same ECB-hike repricing on energy that is moving Bunds, with the added weight of a 2027 budget due in parliament in early October that Prime Minister Lecornu has said must freeze all non-defence spending at 2026 levels, interest costs running at about €65 billion a year and rising by €10 billion (CNBC, Global Banking & Finance). Gilts gave back Thursday's post-BOE rally after August retail sales rose 0.5% against a 0.2% fall expected: the 10-year is up 6 bp at 5.30%, the 2-year up 11 bp at 4.72% and the 30-year unchanged at 5.77% (Trading Economics). The euro AAA curve for 17 September, published today, fell along its whole length on Thursday's rally, the 2-year 2 bp to 3.15%, the 10-year 4 bp to 3.49% and the 30-year 4 bp to 3.75%; today's Bund quotes sit 9 to 11 bp above it at the 2-, 5- and 30-year points, so the Bund curve has more than reversed Thursday's move. German state elections are on Sunday 20 September (Trading Economics).
Asia was the one region that rose, and it did so on a rate hike. The Bank of Japan raised its policy rate from 1.00% to about 1.25%, the highest since April 1995, on a 7 to 2 vote, Toichiro Asada and Ayano Sato dissenting; it is the second hike this year after June's move from 0.75% to 1.00% on 16 June, and at three months the shortest interval between hikes under Governor Ueda (Nippon.com, Japan Times, Bloomberg). The new rate takes effect on Thursday 24 September. The market had it priced and bought the news: the Nikkei rose 1.38% to 65,018.95, led by the AI hardware names (Advantest +7.0%, Lasertec +9.0%), the 10-year JGB slipped to 2.99% (−0.7 bp), the 2-year to 1.85% and the 30-year to 4.08%, and the yen weakened rather than strengthened, USD/JPY at 156.82 (+0.56%), the dollar's week doing more than the BOJ's quarter point. Korea did better still: the Kospi rose 2.66% to 6,894.23 on Samsung Electronics (+3.0%) and SK hynix (+5.6%) after the Nasdaq's 1.7% gain on Thursday, and the Hang Seng rose 0.60% to 24,750.78 on Lenovo (+9.5%) and SMIC (+4.4%); Shanghai rose 0.94% to 3,911.87, the ASX 200 was flat at 8,731.20 and the Nifty 50 rose 0.33% to 23,346.40. Oil is a little lower on the day but the level needs a sentence: Yahoo's WTI generic rolled from the October contract, which expires on 22 September, to November, and Brent from November to December, so the table now settles WTI at $96.08 and Brent at $99.29 where Thursday's briefing showed $101.91 and $104.82. The $5.83 and $5.53 differences are the calendar spreads between the contracts, not a price move: the October WTI contract that the press still quotes settled around $101 to $102 and Brent for November around $104.3 to $104.6 (Trading Economics, CNBC). Gold closed at $4,424.90, up 0.57% after trading lower intraday, silver at $67.15 (+1.59%) and copper at $6.69 (+0.45%), 1.7% below its 9 September record; the VIX closed Thursday at 15.44 (FRED VIXCLS, 17 September), moderate, down from 17.71 on the FOMC day, and today's close is not on FRED yet.
Global Indices Snapshot
Americas
| Index | Level | Day Chg | Day Chg % | Source |
|---|---|---|---|---|
| S&P 500 | 7,650.50 | +12.74 | +0.17% | yfinance ^GSPC |
| Nasdaq 100 | 29,644.17 | +197.17 | +0.67% | yfinance ^NDX |
| Dow Jones | 51,682.64 | −95.40 | −0.18% | yfinance ^DJI |
| Brazil IBOV | 185,198.40 | −793.62 | −0.43% | yfinance ^BVSP |
Americas data reflects the 18 September close. The S&P 500 and Nasdaq 100 both reversed intraday losses to close higher; the Dow pared its loss but stayed negative. The S&P 500 is 0.4% above its 50-day average (7,617.24), 6.5% above its 200-day (7,183.05) and 2.1% below its record of 7,816.70; the Nasdaq 100 is 1.6% above its 50-day (29,175.98) and 3.6% below its record; the Dow is 2.3% under its 50-day (52,881.61), 3.2% above its 200-day and 5.6% below its record, the rate-sensitive index again the weakest of the three. The Bovespa's close moved less than 0.02% from the earlier intraday reading and is left as originally reported, 5.0% above its 50-day and 7.1% below its record of 199,355, two days after the Selic cut to 13.75%.
Europe
| Index | Level | Day Chg | Day Chg % | Source |
|---|---|---|---|---|
| Euro STOXX 600 | 635.45 | −7.15 | −1.11% | yfinance ^STOXX |
| CAC 40 | 8,065.02 | −121.91 | −1.49% | yfinance ^FCHI |
| DAX | 25,304.06 | −412.65 | −1.60% | yfinance ^GDAXI |
| FTSE 100 | 10,659.13 | −156.97 | −1.45% | yfinance ^FTSE |
| SMI (Swiss) | 13,786.72 | −160.59 | −1.15% | yfinance ^SSMI |
European data reflects today's cash close (18 Sep). The Euro STOXX 50 closed at 6,236.20, down 1.37%. For the FTSE 100 the day change is recomputed against the 17 September close of 10,816.10 rather than the 16 September close, which Trading Economics corroborates (−1.5%). The CAC 40, DAX and SMI day changes reconcile with their 17 September closes (8,186.93, 25,716.71, 13,947.31). The day's fall leaves the STOXX 600 2.0% under its 50-day average (648.60), 2.3% above its 200-day (621.09) and 4.2% below its record of 663.41; the DAX is 1.8% under its 50-day and 4.9% below its record; the FTSE 100 is 0.8% under its 50-day and 3.0% below its record of 10,989.50; the SMI is 3.6% under its 50-day. The CAC 40 at 8,065.02 is 4.2% under its 50-day (8,414.34), 2.1% under its 200-day (8,241.06) and 7.9% below its record of 8,755.03, the only one of the five below both averages and the furthest from its high, a position the OAT move explains.
Asia-Pacific
| Index | Level | Day Chg | Day Chg % | Source |
|---|---|---|---|---|
| Nikkei 225 | 65,018.95 | +882.75 | +1.38% | yfinance ^N225 |
| Hang Seng | 24,750.78 | +146.49 | +0.60% | yfinance ^HSI |
| Shanghai Comp | 3,911.87 | +36.27 | +0.94% | yfinance 000001.SS |
| ASX 200 | 8,731.20 | −1.20 | −0.01% | yfinance ^AXJO |
| Kospi (Korea) | 6,894.23 | +178.82 | +2.66% | yfinance ^KS11 |
Asia-Pacific data reflects today's close (18 Sep). For the Hang Seng and the ASX 200, the day change is recomputed against the 17 September closes (24,604.29 and 8,732.40) rather than the 16 September closes; Trading Economics corroborates the Hang Seng's +146 points (+0.6%). The Nikkei is 10.7% below its record of 72,831.73, 1.0% under its 50-day average (65,692.79) and 9.0% above its 200-day. The Hang Seng at 24,751 is 2.1% under its 50-day and 3.4% under its 200-day (25,607); Shanghai at 3,912 is back above its 50-day (3,902) and 2.4% under its 200-day (4,009); the ASX 200 is 2.8% under its 50-day and 1.0% under its 200-day. The Kospi's 2.66% rise puts it 2.8% above its 50-day and 11.4% above its 200-day, and 26.5% below its record of 9,385.59.
Emerging Markets
| Index | Level | Day Chg % | Source |
|---|---|---|---|
| MSCI EM (EEM) | 67.03 | +0.18% | yfinance EEM |
| India Nifty 50 | 23,346.40 | +0.33% | yfinance ^NSEI |
| South Africa | 68.49 | −0.29% | yfinance EZA |
EEM and EZA are US-listed ETFs, revised to the 18 September close; the Nifty 50 is the 18 Sep close. EEM reversed an intraday loss to close at $67.03, 1.8% above its 50-day average and 6.3% below its record of $71.57; week to date it is 1.2% lower. The Nifty 50 is 3.1% under its 50-day and 4.7% under its 200-day (24,502), 11.5% below its record. EZA closed at $68.49, still lower on the day but less so than intraday, 1.9% above its 50-day, 1.1% under its 200-day and 16.2% below its 52-week high of $81.76.
Index Valuations & Investment Risk
Valuation Table
| Index | Trailing P/E (live) | 50-day avg | 100-day avg | 200-day avg |
|---|---|---|---|---|
| S&P 500 | 24.5x | 26.0x | — | — |
| Nasdaq 100 | 29.2x | 30.5x | — | — |
| Euro STOXX 600 | 17.5x | 18.3x | — | — |
| CAC 40 | 16.4x | 17.4x | — | — |
| DAX | 17.9x | 18.7x | — | — |
| FTSE 100 | 15.2x | 17.7x | — | — |
| Nikkei 225 | 21.6x | 21.8x | — | — |
| MSCI EM | 14.2x | 16.4x | — | — |
Trailing P/E is yfinance trailingPE on the ETF proxies (SPY, QQQ, EXSA.DE, CAC.PA, EXS1.DE, ISF.L, 1321.T, EEM). The US and EM rows were re-checked against the 18 September close; none moved by 1% or more (SPY 24.53x→24.61x, QQQ 29.20x→29.41x, EEM 14.18x→14.26x), so the table is left as originally captured. Averages of the daily trailing P/E readings recorded since 1 May 2026 (n = 92); shown for reference only.
Investment Risk Assessment for ETF Investors
United States (S&P 500 / Nasdaq ETFs)
At 24.5x trailing earnings the S&P 500's earnings yield is 4.08% (1÷24.53), against a settled 10-year Treasury yield of 5.01% (US Treasury par curve, 18 September): an earnings yield gap of −0.93 pp, so the 10-year note offers 93 bp more current income than the index's earnings. On the real-yield version, earnings yield less the 10-year TIPS yield of 2.68% (US Treasury real curve, 18 September), the gap is +1.40 pp; the 2.33 pp difference between the two is the breakeven inflation the nominal version charges equities for, and the breakeven was unchanged again, the whole 7 bp rise in the nominal yield showing up in the real one for a second straight session. The Nasdaq 100 at 29.2x gives an earnings yield of 3.42%, 1.59 pp below the nominal 10-year and 0.74 pp above the real one. Neither number is a forecast: they say that today the bond pays more than the index earns, before growth, and that after inflation the index still earns more than the bond. On level, the S&P 500 is 0.4% above its 50-day average and 2.1% below its record, so the index has spent three weeks going mostly sideways while the 10-year has gone from 4.65% to 5.01%: the market is absorbing the rate move through multiple compression (the trailing P/E has come down from a 50-day average of 26.0x to 24.5x) rather than through price, which is what a market with rising earnings does until the earnings stop rising. The concentration risk is the same as ever, and today's session illustrates it starkly: 350 of 500 names finished down, and the index still closed 0.17% higher, entirely on the semiconductor names. Rate sensitivity is now the first risk, ahead of AI capex: a 10-year at 5.01% with a Fed that has said it may hike again puts the discount rate on long-duration growth earnings where it was in 2007, and the Dow's 5.6% distance from its record against the Nasdaq 100's 3.6% says the market is pricing that mostly into financials, industrials and consumer names, not yet into technology.
Europe (STOXX 600 / CAC 40 / DAX ETFs)
The STOXX 600 at 17.5x gives an earnings yield of 5.72% (1÷17.48); against the same-day 10-year Bund at 3.52% (Trading Economics, 18 September intraday) the euro earnings yield gap is +2.20 pp, and against the settled euro AAA 10-year of 3.49% (ECB YC API, 17 September) it is +2.23 pp. The real-yield version, using the euro real 10-year of 1.45% built below, is +4.27 pp. The CAC 40 at 16.4x yields 6.09% and the DAX at 17.9x yields 5.58%, the FTSE 100 at 15.2x yields 6.60%. The US trades at a 40% P/E premium to the STOXX 600 (24.5x against 17.5x) and the gap between the two regions' earnings yield gaps is 3.06 pp on nominal yields and 2.80 pp on real yields; the 0.26 pp difference between those two is the part of Europe's apparent advantage that is only the inflation and policy-path difference between the currencies, which is small this month because the US breakeven (2.33%) and the euro survey expectation (2.04%) are close. Most of the difference in risk compensation is therefore real, and it is the price Europe carries for its sector mix, its growth and, this week, its sovereign risk: an OAT-Bund spread of 105 bp is a euro-area problem as well as a French one, and the banks that led today's fall are the holders of the paper. For a EUR-based investor the currency exposure in a STOXX 600 or CAC 40 fund is inside the earnings rather than in the quoted value: the constituents earn in dollars and yuan, so a dollar that is having its best week since May flatters their translated earnings, and the carmakers' 4 to 5% falls today are the flip side, China demand and energy costs. The exposure is smaller and slower than holding a US fund unhedged, not absent.
Japan (Nikkei / TOPIX ETFs)
The Nikkei at 21.6x trailing earnings yields 4.63%, against a 10-year JGB at 2.99%, a gap of 1.64 pp, the narrowest of the three developed regions after the US. The BOJ's move to 1.25% is the second hike this year after June's 1.00%, and the board's split (7 to 2, with both dissents against tightening) says the pace is contested; the market read the decision as one that leaves a further move open and priced it into the yen only briefly, USD/JPY finishing the European day at 156.82, weaker than before the announcement. For a EUR-based holder the yen is the risk in both directions: a 1.25% policy rate against 3.75 to 4.00% in the US and 2.50% at the ECB still funds the carry trade, so the yen weakens on quiet days and strengthens violently on unwinds. Hedging costs a euro investor roughly the 2.5% minus 1.25% differential, which is now the cheapest it has been in this cycle. The AI-hardware names that led today (Advantest, Lasertec) carry the index's concentration risk; corporate governance reform is the slow-moving support underneath.
Emerging Markets (MSCI EM ETFs)
EEM at 14.2x yields 7.05%, a 42% P/E discount to the S&P 500 and the widest earnings yield in the table. The two things that hurt it are both moving the wrong way this week: the dollar is having its best week since May and the 10-year Treasury closed at 5.01%, and EEM is down 1.2% on the week against a 0.94% gain in the Nasdaq 100. The China weight is the swing factor in both directions: Hong Kong and Shanghai rose today and the Hang Seng is still 3.4% under its 200-day average. Korea, the other large weight, is the best-performing market in the table today and its valuation is in the AI-memory names. The Brazilian easing cycle (Selic 13.75%) is supportive for the Latin American weight, but a further Fed hike would raise the cost of every EM carry position.
Overall Risk Score: High valuation risk / low margin of safety for the US on nominal yields, with a 10-year at 5.01% out-yielding the S&P 500's earnings by 93 bp and the Fed signalling more; Moderate for Europe, where the earnings yield gap of 2.2 pp is intact but the sovereign leg is deteriorating (OAT-Bund 105 bp, Bund 10-year within 5 bp of a 17-year high) and the day's 1.1 to 1.6% falls were led by the banks that hold the paper; Moderate for Japan after a hike the market had priced; Attractive relative valuation for EM on the numbers, with the dollar and US yields the reasons the discount persists.
US Economic Indicators (FRED - authoritative)
| Indicator | Current | Prior | Delta | Reference Date | FRED Series |
|---|---|---|---|---|---|
| CPI YoY % | 3.35% | 3.30% | +0.05 pp | Aug 2026 (vs Jul) | CPIAUCSL |
| Core CPI YoY % | 2.45% | 2.47% | −0.02 pp | Aug 2026 (vs Jul) | CPILFESL |
| Unemployment Rate | 4.1% | 4.1% | 0.0 pp | Aug 2026 (vs Jul) | UNRATE |
| Nonfarm Payrolls | +162k | +21k | +141k | Aug 2026, monthly chg | PAYEMS |
| 10Y TIPS Real Yield | 2.68% | 2.61% | +7 bp | 18 Sep 2026 (vs 17 Sep) | DFII10 (US Treasury real curve) |
Macro figures are the August 2026 observations (FRED, dated 1 August), the prior column the July observations; the real yield is from Treasury's own real curve rather than FRED, with the day change measured 18 September against 17 September. Headline CPI at 3.35% for August is 0.05 pp above July, energy doing the work while core eased to 2.45%; payrolls of +162k after July's +21k are the print that let the Fed hike on Wednesday.
Other economic releases today (from web search):
| Release | Actual | Consensus | Prior | Reaction |
|---|---|---|---|---|
| BOJ policy rate | 1.25% | 1.25% | 1.00% | In line; 7 to 2 vote; Nikkei +1.38%, 10Y JGB 2.99%, yen weaker |
| UK retail sales, Aug MoM | +0.5% | −0.2% | not retrieved | Beat, department stores led; 10Y gilt +6 bp to 5.30%, 2Y +11 bp |
| US industrial production, Aug MoM | 0.0% | +0.3% | +0.2% | Miss; manufacturing −0.3% ends a seven-month run; capacity utilisation 76.3% |
| Japan core CPI, Aug YoY | 1.7% | not retrieved | not retrieved | Cited as moderating on the JGB pages; not the BOJ's constraint today |
| Euro area current account, Jul | €28bn surplus | not retrieved | €35bn (Jun) | Surplus narrowed €7bn on a smaller goods balance (€36bn) and a wider secondary-income deficit (€18bn) (ECB) |
| German PPI, Aug YoY | +4.6% | +4.1% | not retrieved | Beat; energy prices +8.3% YoY did the work, ex-energy +3.1% YoY, +1.1% MoM (Destatis, Global Banking & Finance) |
| US Leading Economic Index, Aug MoM | −0.1% | not retrieved | +0.2% (Jul) | First decline since March, index at 99.5; consumer expectations the main drag (Conference Board) |
Fixed Income & Bond Analysis
Policy Rates
| Central Bank | Rate | Source |
|---|---|---|
| Fed Funds (upper) | 4.00% | FRED DFEDTARU (18 Sep 2026) |
| Fed Funds (lower) | 3.75% | FRED DFEDTARL (18 Sep 2026) |
| Effective FFR | 3.63% | FRED DFF (16 Sep 2026, the day of the hike; the effective rate had not yet moved to the new range) |
| ECB Deposit Rate | 2.50% | FRED ECBDFR (18 Sep 2026) |
| BOJ Policy Rate | 1.25% | web search (raised from 1.00% on 18 Sep 2026, 7 to 2; effective 24 Sep) |
| BOE Bank Rate | ~3.73% (SONIA/FRED) | FRED IUDSOIA (16 Sep 2026); Bank Rate held at 3.75% on 17 Sep, 6 to 3 |
Government Bond Yields
| Country | 2Y Yield | 10Y Yield | 30Y Yield | Day Chg (10Y) | Source |
|---|---|---|---|---|---|
| USA | 4.76% | 5.01% | 5.34% | +7 bp | US Treasury par curve (2026-09-18) |
| Germany | 3.26% | 3.52% | 3.84% | +4 bp | web (Trading Economics, 18 Sep intraday) |
| France | 3.55% | 4.57% | 5.18% | +12 bp | web (Trading Economics, 18 Sep intraday) |
| UK | 4.72% | 5.30% | 5.77% | +6 bp | web (Trading Economics, 18 Sep intraday) |
| Japan | 1.85% | 2.99% | 4.08% | −1 bp | web (Trading Economics, 18 Sep close) |
| Italy | — | 4.44% | — | +10 bp | web (Trading Economics, 18 Sep intraday) |
The USA row is now the settled 18 September par curve throughout. Its day change is +7 bp (10-year 5.01% against Thursday's settled 4.94%), reversing Thursday's rally exactly and retouching Wednesday's cycle high, the highest since 2007. The 5-year settled at 4.86% (+8 bp) and the 20-year at 5.38% (+6 bp). The European rows are Friday's intraday quotes, and with the US row now also 18 September, the two are same-day.
The settled US curve on Friday reverses Thursday's rally by 5 to 8 bp everywhere from the 1-year out and 2 bp at the 3-month bill (4.14%), so the shape did not change: the 2-year at 4.76% sits 76 bp above the top of the Fed's range and 113 bp above the effective rate, still pricing the further hike the dots point to. In Europe the day's move is a bear steepening of the Bund curve at the front and the belly (2-year +5 bp, 5-year +5 bp, 10-year +4 bp, 30-year +1 bp) and a much larger move in the periphery. The 10-year Bund at 3.52% is 5 bp under Tuesday's 3.57%, the highest since June 2009; the 10-year OAT at 4.57% is a new high for the cycle and the highest since September 2008 by Trading Economics' series; the 10-year gilt at 5.30% has given back six of the 10 bp it rallied on Thursday's BOE decision to pause gilt sales, and the 2-year gilt's 11 bp rise on a retail sales beat says the market has moved the November hike back into its pricing. The UK remains the outlier in the table: a 10-year gilt at 5.30% is 29 bp over the settled US 10-year, with a policy rate 25 bp lower than the Fed's.
Yield Curve Spreads: - 10Y-2Y spread: +25 bp (US Treasury par curve, 18 September; 5.01% less 4.76%), 2 bp narrower than Thursday's 27 bp as the 2-year rose 9 bp against the 10-year's 7 bp. Still comfortably outside the ±25 bp band that counts as flat: the curve is positively sloped and has been since the summer, but the 2-year at 4.76% is carrying a hike the front end has not yet been given, so the spread will widen if the Fed stops and narrow further if it does not. - 10Y-3M spread: +87 bp (same source and date; 5.01% less 4.14%), 5 bp wider than Thursday's 82 bp and back at Wednesday's level. The 3-month bill at 4.14% is 27 bp above the 3.875% midpoint of the new Fed range, just outside the ~25 bp tolerance, and prices a little more than one further hike over the bill's life. No recession signal: the spread has been positive since the spring.
OAT-Bund Spread: about 105 bp (10-year OAT 4.57% less 10-year Bund 3.52%, Trading Economics, 18 September intraday), from 96 bp on Thursday and 97 bp on Wednesday, and from 84.7 bp on 4 September (ideal-investisseur). The 9 bp widening in one session matches the 10 September move (85 to 94 bp, on the ECB hike) as the largest in the September briefings, and takes the spread through 100 bp for the first time in them; the 10-year OAT now yields 13 bp more than the 10-year BTP (4.44%), from 10 bp above it on Thursday. No French event is reported behind it. The 2027 budget is due in parliament in early October, Prime Minister Lecornu has said all non-defence spending must be frozen at 2026 levels, and France's interest bill is about €65 billion a year and rising by €10 billion (CNBC, Global Banking & Finance); Fitch has France at A+ since September 2025 and Moody's at Aa3 with a negative outlook. A spread that widens 9 bp on a day with no French news is a market that is short the paper into the budget.
Yield Curve Charts
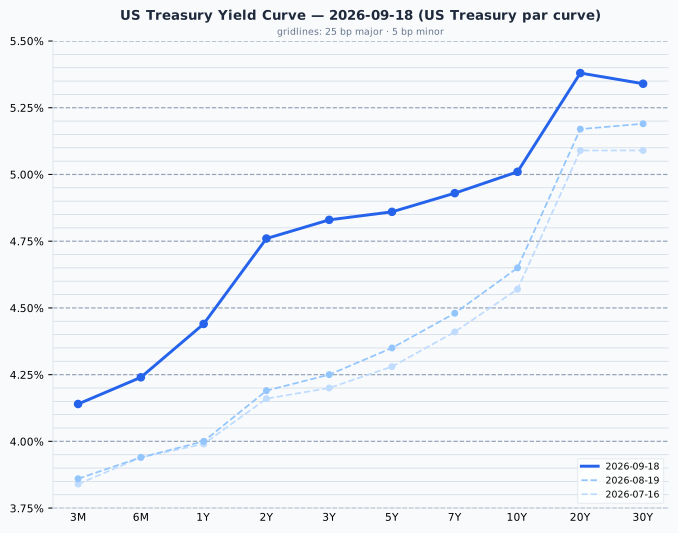
The settled US curve on 18 September is positively sloped from the 3-month bill (4.14%) to the 20-year (5.38%), with the 30-year (5.34%) 4 bp under the 20-year, the same hump the curve has carried all summer. Against the 19 August curve a month ago the whole curve is higher, by 28 bp at the 3-month, 57 bp at the 2-year, 36 bp at the 10-year and 15 bp at the 30-year: a bear flattening driven by the front end, which has repriced the Fed from no move to a hike delivered and another expected, while the long end has moved least. This is now the settled close throughout, so there is no separate live quote left to reconcile against it.
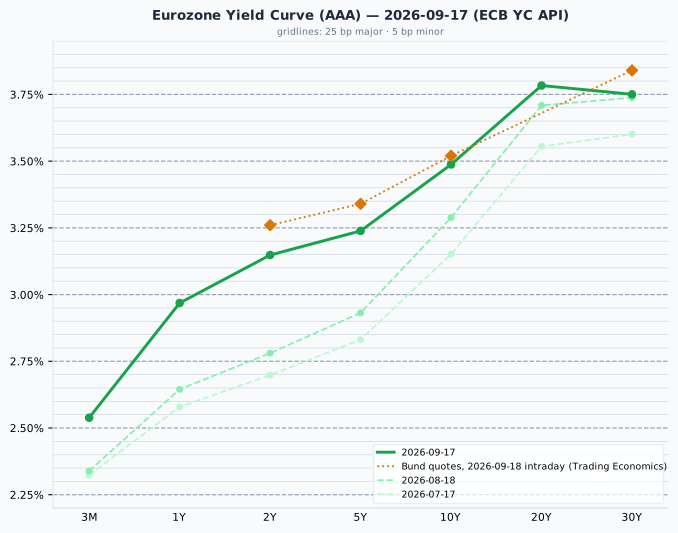
The euro AAA curve on 17 September rises from 2.54% at 3 months to 3.78% at 20 years and dips to 3.75% at 30 years, the same 20-year hump as the US curve. Against the 18 August curve a month ago it is 20 bp higher at 3 months, 37 bp higher at the 2-year, 20 bp higher at the 10-year and 1 bp higher at the 30-year: the same front-led bear flattening as in the US, here on the ECB's 10 September hike to 2.50% and the pricing of a third. Today's Bund quotes (amber) sit above the plotted 17 September curve at every maturity quoted, by 11 bp at the 2-year (3.26% against 3.15%), 10 bp at the 5-year, 3 bp at the 10-year and 9 bp at the 30-year; the plotted curve is the ECB's fitted AAA euro-area curve and the quotes are on-the-run Bunds, which sit a few bp apart by construction, so the 2-, 5- and 30-year gaps are today's move and the 10-year gap is not.
Credit Markets (from FRED - authoritative)
| Market | OAS | Obs. date | vs prior obs | Series ID |
|---|---|---|---|---|
| US Investment Grade | 78 bp | 17 Sep 2026 | 0 bp | BAMLC0A0CM |
| US High Yield | 270 bp | 17 Sep 2026 | 0 bp | BAMLH0A0HYM2 |
| Euro High Yield | 269 bp | 17 Sep 2026 | −5 bp | BAMLHE00EHYIOAS |
Change is 17 Sep 2026 vs 16 Sep 2026.
Credit spreads are the 17 September close; today's session is not in them yet. Thursday's equity and rates rally left US spreads exactly where the FOMC day had put them, investment grade at 78 bp and high yield at 270 bp, while euro high yield tightened 5 bp to 269 bp, a basis point under the US figure after Thursday's 274 bp had put it above. Both US series are below the bottom of their long-run bands (80 to 150 bp for IG, 300 to 500 bp for HY), so credit is historically tight and priced for a soft landing that the 10-year at 5.01% and the Fed's dots are disputing; a market that lets sovereign yields rise 30 to 50 bp in a month without moving credit spreads is one where the risk is being taken in duration, not in default, and the equity market's response today (banks down 3%) is closer to the rates market's view than the credit market's.
Real Yields (US and Euro Area)
| Region | Nominal 10Y | Expected inflation | Real 10Y | How the real yield is obtained |
|---|---|---|---|---|
| United States | 5.01% (US Treasury par curve, 18 Sep) | 2.33% (residual: nominal less real, the breakeven) | 2.68% (US Treasury real curve, 18 Sep) | Measured. TIPS trade, so the market quotes the real yield directly; expected inflation is what is left over |
| Euro area | 3.49% (ECB YC API AAA curve, 17 Sep) | 2.04% (ECB SPF, 2026 Q3, longer-term point forecast, measured) | 1.45% (residual: nominal less expected) | Constructed. No euro inflation-linked benchmark is published, so a survey expectation is subtracted from the nominal yield |
The US real yield is a market price and the euro one is an arithmetic residual: the two rows are built in opposite directions, and only the US figure is something anyone trades. Treat the euro number as the softer of the two. When the pair is compared, two mismatches apply: the US breakeven carries an inflation risk premium that a survey does not, and the SPF's horizon is five years against the bond's ten. The US leg is now 18 September and the euro leg is still 17 September, one session apart again after Thursday's same-day coincidence: the 152 bp nominal gap between the two 10-year yields (5.01% against 3.49%) splits into 29 bp of expected-inflation difference (2.33% against 2.04%) and 123 bp of real-rate difference (2.68% against 1.45%), so about four fifths of the gap is real, as it was on 7 August (18 bp inflation, 130 bp real, of 148 bp); the gap widened 7 bp from Thursday's 145 bp entirely on the US leg's reversal, since the euro side is unchanged. A month ago (19 August) the nominal gap was 136 bp (4.65% against 3.29%), so the two curves have risen together, the US by 36 bp and the euro AAA by 20 bp. The US real yield rose 7 bp on Friday to 2.68%, exactly reversing Thursday's fall and matching its own 16 September level, again the whole nominal move: breakevens did not change on the day.
The gap is not an opportunity for a EUR-based reader, and the briefing states it as a macro fact only. Hedged, it is cancelled by the forward: on a rolling three-month hedge the cost is the 3-month bill (4.14%) against the AAA 3-month (2.54%), about 160 bp, so a 10-year Treasury at 5.01% hedged into euros returns about 3.41% against 3.49% on the euro AAA 10-year, a slightly negative result. Unhedged it is a dollar bet, and the dollar's best week since May is the reason it has felt like a bond return this week. A 2.68% real yield is real above US inflation, not above a euro reader's.
Bond Portfolio Implications
The 10-year Treasury pays more than the S&P 500 earns: an earnings yield of 4.08% against a settled 5.01%, an earnings yield gap of −0.93 pp. On the real-yield version the gap is +1.40 pp, and the 2.33 pp difference between the two is the size of the correction for growth that the nominal version leaves out: the bond's coupon is fixed for a decade while the earnings behind the equity yield grow roughly with inflation. The euro gap is +2.20 pp on the same-day Bund (5.72% earnings yield against 3.52%) and +4.27 pp on the euro real yield. A holder of the index does not receive the whole 4.08% or 5.72%; only the dividend and buyback portion arrives as cash, and the rest is retained. So the honest statement of today's trade-off is that a US investor can lock a 5.01% nominal coupon, or a 2.68% real one, against an index earnings yield of 4.08% plus whatever growth the earnings deliver, while a euro investor is being paid 2.2 pp of nominal earnings yield over the Bund to hold equities, before growth. Neither number forecasts which asset wins; for that the earnings yield against its own history is the measure with content, and the S&P 500's 24.5x against a 50-day average of 26.0x says the multiple has been compressing as yields rose, the DAX's 17.9x against 18.7x and the FTSE's 15.2x against 17.7x say the same for Europe.
Duration is the risk being paid for. At today's settled par yields a further 100 bp rise costs about 7.4% on a 10-year and 13.3% on a 30-year (modified duration 7.79 and 14.87), against about 1.9% on a 2-year. With the 10-year at 5.01% and the 2-year at 4.76% the short end gives up 25 bp of yield to avoid four times the price risk of the 10-year and eight times that of the 30-year; on a day when Thursday's 7 bp rally was reversed exactly and the long end of three European curves is at 17-year highs, the trade-off still favours the 2- to 5-year part of the curve for anyone who does not want to make the call on a further Fed hike, with the 30-year's 5.34% the reward for those who do.
Currencies & Commodities
Currencies (live quotes):
| Pair | Rate | Day chg % | Source |
|---|---|---|---|
| EUR/USD | 1.1469 | −0.09% | yfinance (18:07 CEST) |
| USD Index (DXY, ICE) | 100.40 | +0.15% | yfinance (17:58 CEST) |
| USD/JPY | 156.82 | +0.56% | yfinance (18:08 CEST) |
| GBP/USD | 1.3374 | +0.12% | yfinance (18:07 CEST) |
| USD/CHF | 0.8240 | −0.00% | yfinance (18:08 CEST) |
FX quotes as of 18:08 CEST; day change vs the previous 17:00 ET close. The dollar is on course for its best week since May (Bloomberg) and the ICE index at 100.40 is 0.15% higher today; the yen is the day's loser, USD/JPY at 156.82 up 0.56% and 3.4 yen weaker than the 153.43 quoted before Wednesday's FOMC, the BOJ hike having bought it nothing. EUR/USD at 1.1469 is 1.2% below the 1.1604 FRED fix of 11 September; sterling is the one major up on the day, on the retail sales beat and the 11 bp rise in the 2-year gilt. The Swiss franc is unchanged.
Commodities (all front-month futures):
| Commodity | Price | Day Chg % | Ticker | Source |
|---|---|---|---|---|
| Brent Crude | 99.29 | −0.64% | BZ=F | yfinance |
| WTI Crude | 96.08 | −1.18% | CL=F | yfinance |
| Gold ($/oz) | 4,424.90 | +0.57% | GC=F | yfinance |
| Silver ($/oz) | 67.149 | +1.59% | SI=F | yfinance |
| Copper ($/lb) | 6.6915 | +0.45% | HG=F | yfinance |
| Nat Gas ($/MMBtu) | 2.912 | +0.38% | NG=F | yfinance |
Day changes are settlement vs settlement: the 18 September close against the 17 September settlement.
Contract roll. Yahoo's WTI generic switched on 18 September from the October contract (CLV26, which expires on 22 September) to November (CLX26), and the Brent generic from November (BZX26) to December (BZZ26). The rows above are therefore the November WTI contract, settled at $96.08 against its own 17 September settlement of $97.23, and the December Brent contract, settled at $99.29 against its own $99.93 settlement, and both day changes are genuine. What is not a market move is the level: Thursday's briefing showed WTI at $101.91 and Brent at $104.82, the October and November settlements, and the $5.83 and $5.53 gaps to today's table are the calendar spreads of a backwardated curve, the market paying up for prompt barrels while the Saudi pipeline is down. The October WTI contract the press still quotes settled around $101 to $102 and November Brent around $104.3 to $104.6 (Trading Economics, CNBC), so on a like-for-like basis oil settled a little lower on the day: the Saudi-Houthi strikes and Aramco's notice to European refiners that they get no crude next month pushed prices up early, and the extra cargoes offered through Oman and Hormuz pulled them back. The expireDate fields still show the old contracts' expiries (22 September for WTI, 1 October for Brent), the usual lag after a roll, so no further roll is imminent; the natural gas generic (NGV26) expires on 28 September, six trading days away.
Gold closed at $4,424.90, 20.8% below its all-time high of $5,586.20 set on 29 January 2026; its 52-week range is $3,664.40 to $5,586.20. Silver closed at $67.15, 44.6% below its record of $121.30, also set on 29 January, with copper at or near its all-time high, closing at $6.69, just 1.7% off its 9 September record of $6.81 (the record is within the last 12 months, so the distance is against the 52-week high as well). The precious metals decoupled from Thursday's real-rate story at the close: gold rose 0.57% and silver 1.59% even as the 10-year real yield closed 7 bp higher at 2.68%, the opposite of the usual inverse relationship and more consistent with the Saudi-Houthi escalation adding a safe-haven bid than with the disinflation read the metals gave on Thursday. WTI's 52-week range is $54.98 to $119.48 and Brent's $58.72 to $126.10; natural gas closed at $2.91, in the lower third of its $2.48 to $7.83 range, the one energy contract that the Middle East has not repriced.
Crypto: Bitcoin passed $80,000 (Bloomberg), about 5% above the $76,400 quoted on Thursday, notable on a day when risk assets elsewhere are lower and the dollar is up; no Ethereum figure was retrieved.
Sector & Theme Highlights
- Semiconductors, both continents, both directions of the rates trade: chipmakers rose in New York for a second session after Thursday's 3% group gain (Bloomberg), Infineon (+2.7%) and ASML (+1.5%) were the only large gainers in a European market down 1.1 to 1.6%, and the AI names carried Asia (Advantest +7.0%, Lasertec +9.0%, SK hynix +5.6%, Samsung +3.0%, SMIC +4.4%, Lenovo +9.5%). The index-level consequence is that a 5.01% 10-year is being priced into everything except the sector the market trusts to outgrow it.
- European banks, worst sector of the day: Santander, BNP Paribas and Deutsche Bank more than 3% lower, Barclays and Lloyds about 2.5%, HSBC 1.5%. A 9 bp widening in the OAT-Bund spread and a 10 bp rise in the BTP yield in one session is a mark-to-market on sovereign books and a reminder of which sector the euro-area doom loop runs through.
- German autos: Volkswagen −5.5%, Mercedes-Benz −4.5%, BMW −4.2%, on no single item: Berenberg cut its Mercedes target from €56 to €52 on Wednesday, BMW's June guidance cut (2026 automotive EBIT margin 1 to 3%, from 4 to 6%) blamed China and Iran-war energy costs, and today's move is a market that no longer needs a headline to sell the sector. The DAX is at its lowest since late July.
- Energy and miners lower with the front-month rolls and a flat oil day: Shell −0.9%, BP −1.1%, Glencore −4%, Rio Tinto −1.7%, while copper and silver held their gains; the divergence between the metals (up on the week) and the miners (down on the day) is the rates market, not the commodity market.
- Rates, the theme under all of them: the 10-year Treasury closed at 5.01%, the 10-year Bund within 5 bp of a 17-year high, the OAT at a cycle high, the gilt at 5.30% and the 30-year Treasury at 5.34%. The equity market's response was measured and, in the US, reversed to a small gain: the S&P 500 closed +0.17%, against 1 to 1.5% declines in Europe; the sector dispersion is where it is being felt.
Top Stories (Global)
- BOJ raises its policy rate to 1.25%, the highest since April 1995, on a 7 to 2 vote (Asada and Sato dissenting), its second hike this year after the 16 June move to 1.00% and the shortest interval between hikes under Governor Ueda; effective 24 September. The Nikkei rose 1.38% to 65,018.95, the 10-year JGB slipped to 2.99% and the yen weakened, USD/JPY 156.82 (Nippon.com, Japan Times, Bloomberg, Trading Economics).
- US 10-year Treasury closed at 5.01% (US Treasury par curve, 18 September, +7 bp), exactly reversing Thursday's rally to 4.94% and retouching Wednesday's cycle high, on Saudi supply disruption feeding inflation and Fed-hike expectations; the S&P 500 reversed an intraday loss to close 0.17% higher at 7,650.50, with more than 350 constituents down and chipmakers up, on a quadruple-witching day; the dollar is set for its best week since May and bitcoin topped $80,000 (Bloomberg).
- Europe's worst day since 9 September: the Euro STOXX 50 −1.37% to 6,236.20, its lowest in nearly two months, the DAX −1.60% to 25,304.06, its lowest since late July, the CAC 40 −1.49%, the FTSE 100 −1.45%; banks and German carmakers led (VW −5.5%, Mercedes −4.5%, BMW −4.2%, Santander, BNP and Deutsche Bank >−3%), Deutsche Telekom −4.1% on an Orange note; ASML and Infineon rose (Trading Economics). German state elections are on Sunday.
- French spread through 100 bp: the 10-year OAT rose 12 bp to 4.57%, the highest since 2008 on Trading Economics' series, taking the OAT-Bund spread to about 105 bp from 96 bp on Thursday and the OAT 13 bp above the 10-year BTP (4.44%, +10 bp); the 10-year Bund rose 4 bp to 3.52%. No French event is reported; the 2027 budget with its non-defence spending freeze is due in early October (Trading Economics, CNBC).
- Saudi Aramco tells at least two European refiners they will get no crude next month after the East-West pipeline attack; satellite imagery shows three pumping stations damaged with no repair timeline; Saudi Arabia and the Houthis exchanged cross-border strikes on Thursday. WTI's October contract is around $101 to $102 and Brent for November around $104.5, a few tenths lower on the day, with the extra cargoes via Oman and Hormuz offsetting (Trading Economics, CNBC). Trump meets the six GCC leaders at the UN in New York on Tuesday 22 September on the war's "endgame" and says he is weighing whether to resume attacks on Iran (Axios, CNBC).
- UK retail sales +0.5% in August against −0.2% expected, department stores leading; gilts gave back most of Thursday's BOE rally, the 10-year +6 bp to 5.30% and the 2-year +11 bp to 4.72%, and sterling was the one major to rise against the dollar, GBP/USD 1.3374 (Trading Economics).
- US industrial production flat in August against +0.3% expected, manufacturing −0.3% ending seven months of gains, capacity utilisation 76.3% (Federal Reserve G.17): the first activity print after the Fed's hike, and a soft one, on a day the bond market was pricing the opposite.
Looking Ahead
Central banks - BOJ, delivered: 1.25%, 7 to 2, effective 24 September; the next question is a further move this year, which the statement left open. Tokyo is closed on Monday 21 September and Wednesday 23 September, so the JGB market has three sessions next week to price it. - Fed: no meeting until late October. The blackout has ended, so next week brings the first Fed speakers since Wednesday's hike, read against a 10-year at 5.01% and a market pricing the further hike the dots showed. - ECB: no meeting until October. The AAA 2-year at 3.15% and the 2-year Bund at 3.26% price a third hike after June's 2.25% and September's 2.50%, and Trading Economics reports some analysts asking whether that pricing has gone too far given the energy hit to growth: the euro-area flash PMIs on Wednesday are the test. - BOE: next meeting in November; after Thursday's 6 to 3 hold with three votes for 4.00%, today's retail sales beat and the 11 bp rise in the 2-year gilt say the market is putting the hike back.
Economic releases - Monday 21 September: no major releases; Japan closed. - Tuesday 22 September: the WTI October contract expires; Trump-GCC meeting at the UN. - Wednesday 23 September: flash PMIs for the euro area, UK and US for September, the first activity read on both sides of the Atlantic after the three September hikes (Fed, ECB, BOJ) and the energy shock; Japan closed. - Thursday 24 September: US durable goods and new home sales for August; the BOJ's new rate takes effect. - Friday 26 September: US PCE inflation for August, the first inflation print the Fed sees after its hike, with the third Q2 GDP estimate; Korea closed for Chuseok (24 to 26 September).
Earnings - No major reports scheduled. The AI hardware names, which carried every market today, trade on supply-chain and policy headlines until the October reporting season.
Geopolitical - The Saudi East-West pipeline: three pumping stations damaged, repair timeline unknown, at least two European refiners told to expect no crude in October; the cargoes through Oman and Hormuz are the interim route and the backwardation in both crude curves ($5.83 WTI, $5.53 Brent between consecutive contracts, settlement basis) is the price of prompt supply. - Tuesday's Trump-GCC meeting in New York on the Iran war, with the president saying he is weighing a resumption of attacks and that the war ends around the November midterms; Gulf-state ceasefire talks are reported stalled. - German state elections on Sunday 20 September. - The French 2027 budget, due in parliament in early October, with the OAT-Bund spread now at 105 bp and rising on no news. - The White House copper-tariff decision remains unresolved; copper closed 1.7% below its 9 September record.
Market closures - Japan is closed Monday 21 September (Respect for the Aged Day) and Wednesday 23 September (Autumnal Equinox Day). - No closures in the next five calendar days (19 to 23 September) for the US, UK, Germany, France, Australia, Switzerland, Canada, Korea or Brazil. - Further out: Korea 24, 25 and 26 September (Chuseok); Canada 30 September (National Day for Truth and Reconciliation). - No Indian holiday data is available here, so Indian closures are not checked.
Data sources: US Treasury par and real curves (18 September, settled close) and FRED (policy rates, VIX, credit spreads, macro); ECB YC API (AAA curve, 17 September, the most recent published) and ECB SPF (2026 Q3); equity indices, ETF P/E proxies, commodity futures and FX via yfinance (the Americas indices, EEM, EZA and the commodity settlements reflect the 18 September close, with the FTSE 100, Hang Seng and ASX 200 day changes recomputed against the 17 September closes); European, UK and Japanese bond yields, economic releases and news via web search (Trading Economics, Bloomberg, CNBC, Nippon.com, Japan Times, Axios, Global Banking & Finance, ideal-investisseur, ECB, Destatis, Conference Board).