2026 09 17
Global Financial Briefing — Thursday, 17 September 2026
Americas index levels, commodities and day changes reflect the 17 September closing print; US Treasury par and real curve figures, the curve spreads and the US yield curve chart use Treasury's settled 17 September curve. The euro AAA curve is the 16 September observation, the latest the ECB had published, so the Germany row, the euro real-yield leg and the ECB chart carry that date. FX, credit and macro figures are dated inline. European and Asian closes are final.
Market Overview
The day after the Fed's hike, everything the hike had pushed the wrong way came back. The S&P 500 closed up 1.14% at 7,637.76, the Nasdaq 100 up 1.73% at 29,446.98 and the Dow up 0.61% at 51,778.00, all three recovering more than Wednesday's post-decision losses (−0.45%, +0.02% and −1.21%), with chipmakers up about 3% as a group (Bloomberg) after Monday's 5.9% fall in the semiconductor index; the S&P 500 and Nasdaq 100 closed a little above their mid-afternoon levels and the Dow a little below. Two things did it, and neither was equities. The 10-year Treasury settled at 4.94%, −7 bp on the day (US Treasury par curve, 17 September), ending an eight-session rise (Bloomberg) that took it to 5.01% on 16 September, its highest since 2007; the 2-year settled at 4.67% (−7 bp), the 5-year at 4.78% (−8 bp) and the 30-year at 5.29% (−6 bp), while the 3-month bill fell only 2 bp to 4.12%, so the whole move is a rally at the coupon end of a curve that on Wednesday priced the further hike the dot plot points to and is now deciding it had priced enough. And oil fell for a second session after Wednesday's 3.2% drop: WTI's October contract settled at $101.91 (−0.51% against Wednesday's $102.43 settlement) and Brent's November contract at $104.82 (−0.95% against $105.83), after Saudi Arabia said the East-West pipeline would restart within days and routed extra cargoes through Oman (Bloomberg). The data supported the Fed's read of the economy rather than the market's: initial jobless claims fell to 196,000 for the week to 12 September against 208,000 expected, the four-week average to 203,250 and continuing claims by 39,000 to 1.730 million (Reuters); the Philadelphia Fed index at 37.8 beat the 31.3 consensus, though it is down from 47.4 in August; only housing starts disappointed, at 1.275 million against a revised 1.309 million in July (−2.6%), a sharp multifamily fall masking a 7.6% rise in single-family starts to 918,000 (Census, Bloomberg). The VIX closed Wednesday at 17.71 (FRED VIXCLS, 16 September), moderate, up 3% on the decision; today's close is not on FRED yet.
Europe extended Wednesday's rebound: the STOXX 600 rose 0.86% to 642.60 and the Euro STOXX 50 0.90% to 6,322.90, the FTSE 100 1.19% to 10,816.14, the DAX 0.70% to 25,716.71, the CAC 40 0.57% to 8,186.93 and the SMI 0.57% to 13,947.31. Banks led, as on Wednesday (Santander, BBVA and Deutsche Bank close to +2%), the power-equipment names did better (Siemens Energy, Schneider and Siemens between +2.5% and +3.5%) and the autos followed (Stellantis +2.5%, Renault +2.1%, BMW +1.9%), while energy and materials lagged on the lower oil and metals prices (Trading Economics, Newsquawk). The Bank of England held Bank Rate at 3.75% on a 6 to 3 vote, three members wanting 4.00%, and did the thing the gilt market cared about more: it paused active gilt sales for six months, ended sales of long-dated gilts altogether, and set out a programme to run down most of its remaining £488 billion of gilts by 2034 at about £46 billion a year (Reuters, CNBC). The 10-year gilt fell 10 bp to 5.25% and the 30-year 10 bp to 5.76%, the 2-year 2 bp to 4.61%, a bull flattening on a supply decision rather than a rate one, and the pound is the day's weakest major, GBP/USD at 1.3354 (−0.23%). The euro AAA curve for 16 September, published today, edged lower along its whole length: the 2-year fell 2 bp to 3.17%, the 10-year 1 bp to 3.53%, the 30-year 2 bp to 3.79%. Today's Bund quotes are mixed: the 2-year up 2 bp at 3.23%, the 10-year down 2 bp at 3.49% and the 30-year down 4 bp at 3.84% (Trading Economics), so the Bund curve is flattening while the AAA composite merely drifts. The 10-year OAT at 4.45% (−2 bp) keeps the OAT-Bund spread at 96 bp, a basis point tighter than Wednesday's 97 bp, and the BTP at 4.35% (−3 bp) yields 10 bp less than the OAT, unchanged. Eurostat's final August HICP came in at 3.2%, revised down a tenth from the 3.3% flash and up from 2.9% in July, with energy at +14.3% on the year, its highest since January 2023.
Asia was split and quiet. The Nikkei rose 0.33% to 64,136.25 and the ASX 200 0.41% to 8,732.40; the Hang Seng fell 0.44% to 24,604.29 and Shanghai 0.41% to 3,875.60, both Chinese benchmarks still below both their 50-day and 200-day averages; the Kospi was flat (−0.04%) at 6,715.41 after Wednesday's 1.37% rise, and the Nifty 50 rose 0.23% to 23,270.60. The 10-year JGB held at 3.00% and the 30-year at 4.08% (Trading Economics) a day before the BOJ decision, where a rise from 1.00% to 1.25% is priced as near-certain and would be the highest policy rate since 1995. The yen has not waited for it: USD/JPY at 156.03 (−0.12% on the day) is 2.6 yen weaker than the 153.43 quoted in Wednesday's briefing before the FOMC, the dollar's post-decision rally having taken it through 156 at Wednesday's 17:00 ET close. The same move shows in EUR/USD at 1.1478 (+0.08% today, against 1.1604 on FRED's 11 September fix) and USD/CHF at 0.8249. Credit tightened on Wednesday's session, before today's rally: US high yield at 270 bp (FRED, 16 September) is 6 bp tighter than the 276 bp of 15 September, investment grade 2 bp tighter at 78 bp and euro high yield 1 bp tighter at 274 bp; today's session is not in them yet. The metals are the mirror of the yields: copper settled 2.34% higher at $6.66 a pound, 2.1% below its 9 September record of $6.81, silver 1.81% higher at $66.10, gold 0.28% higher at $4,399.70, and the emerging-market ETF EEM closed up 1.81% at $66.91, its best day in the table, on the lower dollar and lower yields. Bitcoin at about $76,400 is within 1% of Wednesday.
Global Indices Snapshot
Americas
| Index | Level | Day Chg | Day Chg % | Source |
|---|---|---|---|---|
| S&P 500 | 7,637.76 | +85.95 | +1.14% | yfinance ^GSPC |
| Nasdaq 100 | 29,446.98 | +501.92 | +1.73% | yfinance ^NDX |
| Dow Jones | 51,778.00 | +316.10 | +0.61% | yfinance ^DJI |
| Brazil IBOV | 185,992.03 | +444.37 | +0.24% | yfinance ^BVSP |
Americas data reflects the 17 Sep close. The S&P 500 close of 7,637.76 matches the FRED SP500 observation for 17 September to the cent; the day changes are against the 16 September closes (S&P 500 7,551.81). The day's rise takes the S&P 500 back above its 50-day average (7,612.00) by 0.3% after two closes below it, 6.5% above its 200-day (7,174.92) and 2.3% below its record of 7,816.70; the Nasdaq 100 closed 0.9% above its 50-day (29,173.75) and 4.3% below its record; the Dow, the index the Fed hit hardest on Wednesday, is still 2.1% under its 50-day (52,909) and 5.4% below its record, the rate-sensitive and financial names it carries recovering least. The Bovespa gave back half of its afternoon gain into the close, ending 0.24% higher, 5.6% above its 50-day and 6.7% below its record, a day after the Selic cut to 13.75%.
Europe
| Index | Level | Day Chg | Day Chg % | Source |
|---|---|---|---|---|
| Euro STOXX 600 | 642.60 | +5.51 | +0.86% | yfinance ^STOXX |
| CAC 40 | 8,186.93 | +46.34 | +0.57% | yfinance ^FCHI |
| DAX | 25,716.71 | +178.96 | +0.70% | yfinance ^GDAXI |
| FTSE 100 | 10,816.14 | +127.67 | +1.19% | yfinance ^FTSE |
| SMI (Swiss) | 13,947.31 | +78.65 | +0.57% | yfinance ^SSMI |
European data reflects today's cash close (17 Sep). The Euro STOXX 50 closed at 6,322.90, up 0.90%. For the CAC 40, DAX and FTSE 100 the previousClose field yfinance returned was the 15 September close, a session stale, but the change field reconciles exactly with the 16 September closes in Wednesday's briefing (8,140.59, 25,537.75 and 10,688.47), so the day changes shown are correct and the stale field is ignored. Two sessions of gains leave the STOXX 600 0.9% under its 50-day average (648.56), 3.5% above its 200-day (620.77) and 3.1% below its record of 663.41. The FTSE 100, the day's best European index on the gilt rally, is 0.7% above its 50-day and 1.6% below its record of 10,989.50; the DAX is within 0.1% of its 50-day (25,749) and 3.4% below its record; the SMI is 2.6% under its 50-day. The CAC 40 at 8,186.93 is 2.7% under its 50-day (8,417) and 0.7% under its 200-day (8,241), still the only one of the five below both, and 6.5% below its record of 8,755.03.
Asia-Pacific
| Index | Level | Day Chg | Day Chg % | Source |
|---|---|---|---|---|
| Nikkei 225 | 64,136.25 | +213.25 | +0.33% | yfinance ^N225 |
| Hang Seng | 24,604.29 | -109.49 | -0.44% | yfinance ^HSI |
| Shanghai Comp | 3,875.60 | -16.00 | -0.41% | yfinance 000001.SS |
| ASX 200 | 8,732.40 | +35.90 | +0.41% | yfinance ^AXJO |
| Kospi (Korea) | 6,715.41 | -2.56 | -0.04% | yfinance ^KS11 |
Asia-Pacific data reflects today's close (17 Sep). For the Hang Seng the previousClose field was the 15 September close, a session stale, but the change field reconciles with Wednesday's 24,713.78 close, so the day change is correct. The Nikkei is 11.9% below its record of 72,831.73 and 2.5% under its 50-day average (65,775), 7.7% above its 200-day, on the eve of the BOJ. The Hang Seng at 24,604 is 2.7% under its 50-day and 3.9% under its 200-day (25,613), Shanghai at 3,876 is 0.8% under its 50-day and 3.3% under its 200-day (4,009); the ASX 200 is 1.0% under its 200-day (8,822). The Kospi, flat after Wednesday's 1.37% rise, is 28.5% below its record of 9,385.59 and within 0.1% of its 50-day average, 8.7% above its 200-day; yfinance returned a 52-week low of exactly 0.0 for it, a data error, so no 52-week range is given for the Kospi.
Emerging Markets
| Index | Level | Day Chg % | Source |
|---|---|---|---|
| MSCI EM (EEM) | 66.91 | +1.81% | yfinance EEM |
| India Nifty 50 | 23,270.60 | +0.23% | yfinance ^NSEI |
| South Africa | 68.69 | +1.69% | yfinance EZA |
EEM and EZA are US-listed ETFs at the 17 September NYSE close; the Nifty 50 is the 17 September close. EEM closed at $66.91, 1.6% above its 50-day average, 7.6% above its 200-day and 6.5% below its record of $71.57; the day's 1.81% is its largest move in the table in either direction, the lower dollar and the 7 bp fall in Treasury yields doing for EM what they usually do. EZA at $68.69 is 2.5% above its 50-day, 0.8% under its 200-day and 16.0% below its record. The Nifty 50 at 23,270.60 remains 3.5% under its 50-day and 5.1% under its 200-day (24,516), 11.8% below its record of 26,373.20, the weakest large market in the table against its own averages after the Hang Seng.
Index Valuations & Investment Risk
Valuation Table
| Index | Trailing P/E (live) | 50-day avg | 100-day avg | 200-day avg |
|---|---|---|---|---|
| S&P 500 | 24.6x | 26.1x | — | — |
| Nasdaq 100 | 29.2x | 30.6x | — | — |
| Euro STOXX 600 | 17.7x | 18.3x | — | — |
| CAC 40 | 16.7x | 17.4x | — | — |
| DAX | 18.2x | 18.7x | — | — |
| FTSE 100 | 15.4x | 17.8x | — | — |
| Nikkei 225 | 21.3x | 21.8x | — | — |
| MSCI EM | 14.2x | 16.5x | — | — |
Averages of the daily trailing P/E readings recorded since 1 May 2026 (n = 91); shown for reference only. Trailing P/E is Yahoo Finance trailingPE on the ETF proxies SPY, QQQ, EXSA.DE, CAC.PA, EXS1.DE, ISF.L, 1321.T and EEM, taken at 20:41 CEST; the European and Japanese proxies were at their close. The US and EM proxies were taken before the NYSE close; the close-based readings (SPY 24.64x, QQQ 29.22x, EEM 14.23x) differ from those shown by less than 0.2%, so the rows stand as recorded.
Investment Risk Assessment for ETF Investors
United States (S&P 500 / Nasdaq ETFs)
The S&P 500's trailing P/E of 24.63x (SPY) gives an earnings yield of (1÷24.63) = 4.06%. Against the settled 10-year Treasury at 4.94% (US Treasury par curve, 17 September) the earnings yield gap is −0.88 pp: the bond pays 88 bp more current income than the index earns, before the point that only the dividend and buyback portion of those earnings reaches the holder as cash. Against the 10-year TIPS real yield of 2.61% (US Treasury real curve, 17 September) the real-basis gap is +1.45 pp, the 2.33 pp difference between the two being the inflation compensation the nominal bond carries and the equity's earnings do not need. The Nasdaq 100 at 29.18x (QQQ) earns 3.43%, −1.51 pp against the nominal 10-year and +0.82 pp against the real one. Today's rally has put the S&P 500 back above its 50-day average and 2.3% from its record, and the Nasdaq 100 4.3% from its; the 7 bp fall in the 10-year made the nominal gap 7 bp less negative than Wednesday's −0.95 pp, without changing its sign. The rate-sensitivity is the whole of the day: the same 7 bp fall in the 10-year that lifted the Nasdaq 100 1.7% would take back as much on the way up, and the Fed's dot plot still has one more hike this year for 16 of 18 participants. Concentration in the AI hardware names is the second risk, cutting both ways this week: the chip index fell 5.9% on Monday's AI-slowdown calls and rose 3% today on nothing more than lower yields and a Saudi pipeline.
Europe (STOXX 600 / CAC 40 / DAX ETFs)
The STOXX 600's earnings yield is (1÷17.69) = 5.65%. Against the euro AAA 10-year at 3.53% (ECB YC API, 16 September) the euro earnings yield gap is +2.12 pp, and +2.16 pp against today's 3.49% Bund quote; against the constructed euro real 10-year of 1.50% (AAA nominal 3.53% less the ECB SPF long-term HICP expectation of 2.04%, 2026 Q3) it is +4.16 pp. The CAC 40 at 16.65x earns 6.00%, +1.55 pp over the 10-year OAT at 4.45%; the DAX at 18.21x earns 5.49%, +2.00 pp over the Bund; the FTSE 100 at 15.39x earns 6.50%, +1.25 pp over a 10-year gilt at 5.25%. The US-euro comparison, −0.88 pp against +2.12 pp nominal, is partly the difference between the two currencies' inflation and policy paths rather than a difference in risk compensation, and the real-yield version narrows it: +1.45 pp against +4.16 pp, still 2.71 pp in Europe's favour, but with the caveat that the US real yield is a traded price and the euro one is a survey subtraction (see Real Yields below). On relative valuation the US trades at a 39% premium to the STOXX 600 on trailing earnings (24.63x against 17.69x). The European risks sit in the bond table: an OAT-Bund spread at 96 bp with the OAT yielding 10 bp more than the BTP, a Bund 10-year within a few basis points of the highest since June 2009 it touched this week, an ECB that has hiked twice since June (2.25% on 17 June, 2.50% on 10 September) with the AAA 2-year at 3.17% still pricing a third, and Brent at $105, the largest single input to a euro-area HICP that printed 3.2% for August with energy up 14.3%. A EUR-based investor holding EUR-quoted European funds has no FX effect on the quoted value of the holding, but the STOXX 600 and CAC 40 constituents earn abroad, so currency exposure sits inside the earnings, smaller and slower than for a USD fund but not absent; with EUR/USD at 1.1478, 1.1% under FRED's 11 September fix, that exposure has been working in the exporters' favour this week.
Japan (Nikkei / TOPIX ETFs)
The Nikkei 225 at 21.28x (1321.T) earns 4.70%, against a 10-year JGB at 3.00% and a 30-year at 4.08%: a gap of +1.70 pp that is the narrowest of the major markets after the US. Tomorrow's BOJ decision is the risk: a hike to 1.25%, the highest since 1995, is fully priced (Trading Economics), so the reaction will be to the guidance on a further move this year. The index is 11.9% below its record and 2.5% under its 50-day average, the market already having discounted a policy rate that is rising while the Fed's may have one more move in it. USD/JPY at 156.03, back through 156 after the Fed, is the argument for the hedged share class: a BOJ that hikes into a yen at these levels tends to produce a sharp but short yen rally, and an unhedged EUR investor takes that on top of the equity move. The governance reform theme (buybacks, cross-shareholding unwinds) continues and is the case for the market that does not depend on the yen.
Emerging Markets (MSCI EM ETFs)
EEM at 14.25x earns 7.02%, a 42% discount to the S&P 500 on trailing earnings and the widest earnings yield gap in the table (+2.08 pp over the nominal 10-year Treasury, +4.41 pp over the real). Today's 1.81% rise is the asset class doing what it does when the dollar and Treasury yields fall together; the reverse, on Wednesday afternoon, was what took USD/JPY through 156 and EUR/USD under 1.15. The China weight is the structural risk (the Hang Seng and Shanghai are both below their 200-day averages and both fell today while everything else rose), and India, the second weight, is 11.8% below its record with the Nifty 50 under both averages. A EUR-based holder of a USD-denominated EM ETF carries the dollar on top of the local currencies; with the dollar index at 100.25 and the Fed still tightening, that is currently the larger of the two.
Overall Risk Score: Moderate, fair value, mixed signals. The US earnings yield gap is still negative on nominal yields (−0.88 pp) and positive only on the real basis (+1.45 pp), which describes today's income trade-off and does not forecast anything; Europe and EM are the markets where the gap is unambiguously positive on either basis. Today's rally is a rates rally, and it lasts as long as the 10-year does not retest 5%.
US Economic Indicators (FRED - authoritative)
| Indicator | Current | Prior | Delta | Reference Date | FRED Series |
|---|---|---|---|---|---|
| CPI YoY % | 3.35% | 3.30% | +0.05 pp | Aug 2026 (prior Jul) | CPIAUCSL |
| Core CPI YoY % | 2.45% | 2.47% | −0.02 pp | Aug 2026 (prior Jul) | CPILFESL |
| Unemployment Rate | 4.1% | 4.1% | 0.0 pp | Aug 2026 (prior Jul) | UNRATE |
| Nonfarm Payrolls | +162k | +21k | +141k | Aug 2026 (prior Jul), monthly chg | PAYEMS |
| 10Y TIPS Real Yield | 2.61% | 2.68% | −7 bp | 2026-09-17 (prior 16 Sep) | DFII10 (US Treasury real curve) |
CPI and core CPI are the August 2026 prints (FRED CPIAUCSL, CPILFESL; the pc1 transformation), with July as the prior: headline rose from 3.30% to 3.35% while core eased from 2.47% to 2.45%, so the whole of the month's acceleration is energy. Headline at 3.35% against core at 2.45% is the energy contribution in one line: the 90 bp between them is the oil price. Payrolls at +162k for August against +21k in July (FRED PAYEMS); unemployment unchanged at 4.1%. The real yield at 2.61% is the 17 September Treasury real curve, −7 bp on the day, giving back the +6 bp of the FOMC session that had taken it to the top of this briefing's archive; the breakeven is unchanged at 2.33%, so Thursday's rally, like Wednesday's sell-off, was entirely a real-rate move.
Other economic releases today (web search)
| Release | Actual | Consensus | Prior | Note |
|---|---|---|---|---|
| US initial jobless claims (w/e 12 Sep) | 196k | 208k | 206k | 4-week average 203,250; continuing claims 1.730m (−39k); Labor Day week volatility (Reuters) |
| US housing starts (Aug, SAAR) | 1.275m | — | 1.309m (rev) | −2.6% m/m; single-family 918k (+7.6%), multifamily fell sharply (Census, Bloomberg) |
| Philadelphia Fed manufacturing (Sep) | 37.8 | 31.3 | 47.4 | Beat, but slowing; new orders and shipments firm, employment lower but positive (Investing.com) |
| Euro area HICP, final (Aug, y/y) | 3.2% | 3.3% (flash) | 2.9% | Revised down 0.1 pp; energy +14.3% y/y, highest since Jan 2023; services +1.43 pp contribution (Eurostat) |
| Bank of England Bank Rate | 3.75%, hold, 6 to 3 | hold | 3.75% | Three votes for +25 bp; QT gilt sales paused six months, long-dated sales ended; CPI seen at 4% early 2027; Q3 GDP 0.4% (Reuters, CNBC) |
Market reaction: the claims and Philadelphia Fed beats were absorbed without a mark on the bond rally, which says the market is trading the Fed's reaction function rather than the data; the 10-year settled 7 bp lower on a day when the labour data argued the other way. Gilts took the BOE's supply decision as the news, 10 bp lower at 10 and 30 years, and the pound as the cost of it.
Fixed Income & Bond Analysis
Policy Rates
| Central Bank | Rate | Source |
|---|---|---|
| Fed Funds (upper) | 4.00% | FRED DFEDTARU (2026-09-17) |
| Fed Funds (lower) | 3.75% | FRED DFEDTARL (2026-09-17) |
| Effective FFR | 3.63% | FRED DFF (2026-09-15) |
| ECB Deposit Rate | 2.50% | FRED ECBDFR (2026-09-17) |
| BOJ Policy Rate | 1.00% | web search (Trading Economics, BOJ); decision on 1.25% due Friday 18 Sep |
| BOE Bank Rate | 3.75% (SONIA 3.73%) | FRED IUDSOIA (2026-09-15); held at 3.75% today, 6 to 3 (Reuters, CNBC) |
FRED's target-range series now shows the new 3.75% to 4.00% range, effective 17 September, after Wednesday's 25 bp hike on a 12 to 0 vote; the effective rate at 3.63% is the 15 September observation, under the old range, and will step up to the new midpoint of 3.875% from today's observation. The 3-month bill at 4.12% (17 September, −2 bp) is 24.5 bp above the new midpoint, just inside the 25 bp sanity band and consistent with a market that has most of one further hike in the front end. The ECB's 2.50% is the 10 September decision, its second hike this year after June's 2.25%; the BOJ's 1.00% dates from 16 June and is expected to become 1.25% tomorrow. The BOE's 3.75%, held today with three dissents for a hike, sits under SONIA at 3.73%.
Government Bond Yields
| Country | 2Y Yield | 10Y Yield | 30Y Yield | Day Chg (10Y) | Source |
|---|---|---|---|---|---|
| USA | 4.67% | 4.94% | 5.29% | −7 bp | US Treasury par curve (2026-09-17) |
| Germany | 3.23% | 3.49% | 3.84% | −2 bp | web (Trading Economics, 17 Sep intraday) |
| France | — | 4.45% | — | −2 bp | web (Trading Economics, 17 Sep intraday) |
| UK | 4.61% | 5.25% | 5.76% | −10 bp | web (Trading Economics, 17 Sep intraday) |
| Japan | 1.87% | 3.00% | 4.08% | 0 bp | web (Trading Economics, 17 Sep) |
| Italy | — | 4.35% | — | −3 bp | web (Trading Economics, 17 Sep intraday) |
The USA row is the settled US Treasury par curve for 17 September, with the day change against the 16 September curve (10-year 5.01%): a near-parallel rally across the coupon curve, 2-year −7 bp to 4.67%, 3-year −7 bp to 4.75%, 5-year −8 bp to 4.78%, 7-year −8 bp to 4.86%, 10-year −7 bp to 4.94%, 20-year −7 bp to 5.32% and 30-year −6 bp to 5.29%, with the bills barely moving (3-month −2 bp to 4.12%, 6-month −2 bp to 4.20%, 1-year −5 bp to 4.40%). It is the first fall in the 10-year in nine sessions and takes back most of Wednesday's bear flattening, without undoing the month: the 2-year is still 48 bp above 18 August. The German row is today's Bund quotes: the 2-year rose 2 bp to 3.23% while the 5-year was unchanged at 3.30%, the 10-year fell 2 bp to 3.49% and the 30-year 4 bp to 3.84%, a flattening of 4 bp between 2 and 10 years on the day. The ECB's AAA composite for 16 September, published today, had every maturity a basis point or two lower than the 15 September curve (3-month 2.52%, 1-year 2.97%, 2-year 3.17%, 5-year 3.28%, 10-year 3.53%, 20-year 3.83%, 30-year 3.79%). The French 10-year at 4.45% (−2 bp) matches the Bund's move, so the OAT-Bund spread is 96 bp against 97 bp on Wednesday; Italy at 4.35% (−3 bp) is 86 bp over the Bund and 10 bp under France. The gilt curve had the day's largest sovereign move for the second session running (Wednesday's was the 14 bp fall at 2 years on the in-line CPI): the 10-year fell 10 bp to 5.25% and the 30-year 10 bp to 5.76% on the BOE's pause in gilt sales, while the 2-year fell only 2 bp to 4.61% and the 5-year 2 bp to 4.84%, a bull flattening driven by the long end that the Bank has just stopped selling. The JGB 10-year was unchanged at 3.00%, the 2-year at 1.87% and the 30-year at 4.08%, the day before the BOJ.
Yield Curve Spreads (US Treasury par curve, 17 September): - 10Y-2Y spread: +27 bp, positive but flat (within ±25 bp is flat; this is 2 bp outside it), unchanged on the day because the 2-year and the 10-year fell by the same 7 bp, and 25 bp flatter than the 52 bp of 18 August: a month in which the 2-year rose 48 bp and the 10-year 23 bp. The market has moved the whole of the Fed's two hikes into the front end and only part of them into the long end. - 10Y-3M spread: +82 bp, normal, no recession signal; 5 bp flatter on the day, the bill having fallen 2 bp against the 10-year's 7, and 3 bp flatter than the 85 bp of 18 August, because the bill rose 26 bp and the 10-year 23 bp over the month.
The two spreads together describe a curve whose slope is entirely between 3 months and 2 years (55 bp) and almost nothing from 2 to 10 (27 bp): a market pricing the hikes and not much growth beyond them.
OAT-Bund Spread: 96 bp (10-year OAT 4.45% against Bund 3.49%, Trading Economics, 17 September), 1 bp tighter than Wednesday's 97 bp and 11 bp wider than the 84.7 bp of 4 September. The French 10-year still yields 10 bp more than the Italian, as it has all week; the spread is the market's price for a fiscal position that no budget has yet addressed, and it has widened with every rise in the Bund rather than narrowed.
Yield Curve Charts
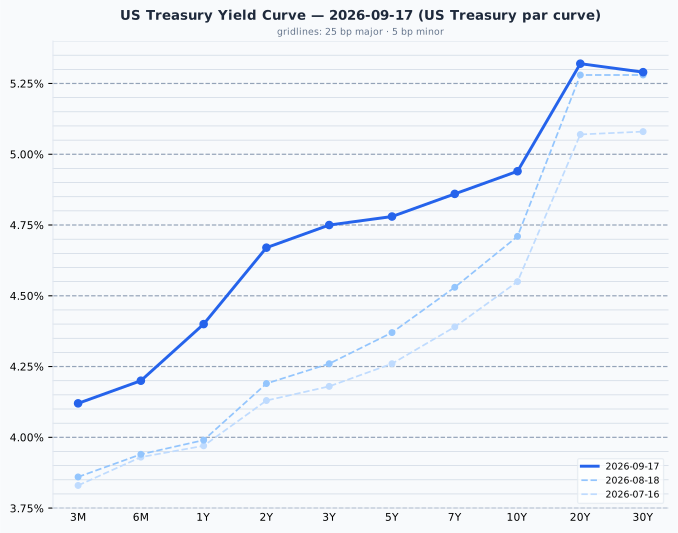
US Treasury par curve, 17 September 2026, against the 18 August and 16 July curves. The curve rises from 4.12% at 3 months to 4.94% at 10 years and 5.32% at 20, then dips to 5.29% at 30 years, the 20-year hump unchanged; the 2-to-10 slope is 27 bp. Against the 18 August curve the shift is a bear flattening centred on the front end: +26 bp at 3 months, +41 bp at 1 year, +48 bp at 2 years, +49 bp at 3 years, +41 bp at 5 years, +33 bp at 7 years, +23 bp at 10 years, +4 bp at 20 years and +1 bp at 30 years; Thursday's 6 to 8 bp rally from 2 years out has taken the long end almost back to where it was a month ago while the front end keeps the hikes. The 3-month bill at 4.12% is 24.5 bp above the new Fed Funds midpoint of 3.875%, just inside the 25 bp sanity band and pricing most of a further hike.
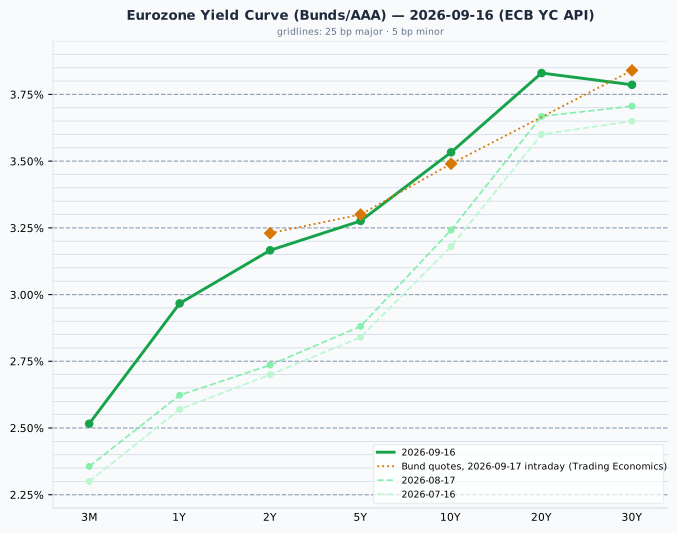
Euro area AAA government curve, 16 September 2026 (ECB YC API), against the 17 August and 16 July curves, with today's Bund quotes overlaid. The curve rises from 2.52% at 3 months to 3.53% at 10 years and 3.83% at 20, then dips to 3.79% at 30 years, the same 20-year hump as the US curve; the 2-to-10 slope is 37 bp. Against the 17 August curve every point is higher: +16 bp at 3 months, +34 bp at 1 year, +43 bp at 2 years, +40 bp at 5 years, +29 bp at 10 years, +16 bp at 20 years and +8 bp at 30 years, a bear flattening of the same shape as the US one and centred on the 2-year, which is where the June and September ECB hikes and the pricing of a third have landed. Today's Bund quotes differ from the plotted 16 September curve by at most 6 bp, at the 2-year (3.23% against 3.17%), with the 30-year 5 bp above (3.84% against 3.79%), the 5-year 2 bp above and the 10-year 4 bp below (3.49% against 3.53%); the curve is the ECB's fitted AAA euro-area composite and the quotes are on-the-run Bunds, which sit a few basis points apart by construction, so none of these gaps is clearly a day move, and the 2-year's is consistent with the Bund 2-year's own 2 bp rise today.
Credit Markets (from FRED - authoritative)
| Market | OAS | Obs. date | vs prior obs | Series ID |
|---|---|---|---|---|
| US Investment Grade | 78 bp | 2026-09-16 | −2 bp | BAMLC0A0CM |
| US High Yield | 270 bp | 2026-09-16 | −6 bp | BAMLH0A0HYM2 |
| Euro High Yield | 274 bp | 2026-09-16 | −1 bp | BAMLHE00EHYIOAS |
Change is 2026-09-16 vs 2026-09-15. Credit spreads are the 16 September close; today's session is not in them yet. US high yield at 270 bp tightened 6 bp on the FOMC session, the day equities fell, which reads as the credit market taking the hike as confirmation of the economy rather than a threat to it; it remains under the 300 bp floor of the 300 to 500 bp normal range, historically tight, and investment grade at 78 bp is 2 bp under the 80 bp floor of its 80 to 150 bp band. Euro high yield at 274 bp is 4 bp over US high yield, the two having traded within a few basis points of each other all month. Over the month since 18 August, US high yield is unchanged at 270 bp while the 10-year Treasury rose 30 bp: the credit market has not repriced with the rates market, which is either confidence in earnings or the complacency that tight spreads usually are. None of the three is near stress.
Real Yields (US and Euro Area)
| Region | Nominal 10Y | Expected inflation | Real 10Y | How the real yield is obtained |
|---|---|---|---|---|
| United States | 4.94% (US Treasury par curve, 17 Sep) | 2.33% (residual: nominal − real) | 2.61% (US Treasury real curve, 17 Sep) | Measured. TIPS trade, so the market quotes a real yield directly; expected inflation is the residual (the breakeven) |
| Euro area | 3.53% (ECB YC API, 16 Sep) | 2.04% (ECB SPF, 2026 Q3, measured) | 1.50% (residual: nominal − expected) | Constructed. No euro inflation-linked benchmark is published, so a survey expectation is subtracted from the nominal yield |
The US real yield is a market price and the euro one is derived: the two rows are built in opposite directions, the US measuring the real yield and inferring inflation, the euro area measuring inflation (by survey) and inferring the real yield, so only the US figure is something anyone trades and the euro figure is the softer of the two. Two mismatches apply whenever they are compared: the US breakeven carries an inflation risk premium that a survey does not, and the SPF horizon is five years against the bond's ten. The two legs are a day apart: the US leg is the 17 September close and the euro leg the 16 September curve, the latest the ECB had published. On that basis the 141 bp nominal gap between the two 10-years splits into about 29 bp of expected-inflation difference (2.33% against 2.04%) and 111 bp of real-rate difference (2.61% against 1.50%), so four-fifths of it is real, a share that has moved little since 7 August (18 bp inflation, 130 bp real). The US real yield at 2.61% is −7 bp on 16 September (2.68%), the whole of Thursday's 7 bp fall in the nominal 10-year landing in the real rate with the breakeven unchanged at 2.33%, the mirror of Wednesday's +6 bp; against the 18 August curve (nominal 4.71%, real 2.41%, breakeven 2.30%) the 23 bp rise in the nominal 10-year has been 20 bp of real yield and 3 bp of breakeven, which is the tightening the Fed was after.
Why the US real-yield advantage is not a return a euro investor can capture
The US real yield has exceeded the euro one in every quarter since 2014, by 1.52 pp on average, and today's 111 bp is under that mean. It is a structural feature (US trend growth, euro-area savings, Bund scarcity, US fiscal supply), not a trade a EUR-based reader can capture: hedging the currency removes it, because the forward rate is set from the same interest differential, and holding Treasuries unhedged is a dollar bet rather than a bond decision. A real yield is real in its own currency; 2.61% is 2.61% above US inflation, which is not a real return for someone who spends euros. The gap is stated here as a description of relative policy stance and growth expectations, and no portfolio conclusion is drawn from it.
Bond Portfolio Implications
The nominal 10-year Treasury at 4.94% pays 88 bp more than the S&P 500's 4.06% earnings yield and 151 bp more than the Nasdaq 100's 3.43%; the euro AAA 10-year at 3.53% pays 212 bp less than the STOXX 600's 5.65%. This is a description of today's income trade-off, not a forecast: the earnings yield gap ignores earnings growth, which roughly tracks inflation and is what the real-basis version (+1.45 pp for the S&P 500, +4.16 pp for the STOXX 600) corrects for, and an equity holder receives only the dividend and buyback share of the earnings as cash. On that basis a US bond is competitive with US equities on current income, a euro bond is not competitive with euro equities on either basis, and a gilt at 5.25% against the FTSE 100's 6.50% sits between the two. The valuation argument that does carry predictive weight is the multiple against its own history, and there the S&P 500 at 24.6x is off its summer levels but not cheap.
At the 17 September par yields a further 100 bp rise costs about 7.5% on a 10-year and 13.4% on a 30-year (modified duration 7.82 and 14.96), against about 1.9% on a 2-year (17 September curve). The trade-off has not changed this week: the 2-year at 4.67% gives up 27 bp against the 10-year and 62 bp against the 30-year for a quarter of the 10-year's rate risk and an eighth of the 30-year's, and with the Fed's dots still pointing at one more hike and the 10-year having only just turned down from a 19-year high, the short end is where the yield is being paid for the least duration; the long end is the bet that today's 7 bp rally is the start of something, which one session cannot show.
Currencies & Commodities
Currencies (Yahoo Finance live quotes)
| Pair | Rate | Day chg % | Source |
|---|---|---|---|
| EUR/USD | 1.1478 | +0.08% | yfinance (20:40 CEST) |
| USD Index (DXY, ICE) | 100.25 | 0.00% | yfinance (20:31 CEST) |
| USD/JPY | 156.03 | −0.12% | yfinance (20:41 CEST) |
| GBP/USD | 1.3354 | −0.23% | yfinance (20:41 CEST) |
| USD/CHF | 0.8249 | −0.01% | yfinance (20:41 CEST) |
FX quotes as of 20:41 CEST; day change vs the previous 17:00 ET close. The day changes are small because the move happened on Wednesday afternoon: the dollar rallied on the FOMC's dot plot after Wednesday's briefing was written, and the previous-close fields today carry it (USD/JPY 156.22, GBP/USD 1.3385, USD/CHF 0.8250, EUR/USD 1.1469). Against Wednesday's intraday quotes the yen is 2.6 yen weaker, the pound 1.4% lower and the franc 0.8% lower, and EUR/USD at 1.1478 is 1.1% under FRED's 11 September fix of 1.1604 (DEXUSEU), which is the last settled reference. Today's pound weakness (−0.23%, the day's largest move in the table) is the BOE's: a 6 to 3 hold with the gilt-sales pause read as the Bank leaning away from a November hike. The ICE dollar index quote of 100.25 shows no change against its previous close, which is more likely a stale print than a flat day given the moves in its components; it is shown as returned. The ICE index is a different index from FRED's broad trade-weighted DTWEXBGS (118.21 on 11 September) and the two are not compared.
Commodities (Yahoo Finance front-month futures)
| Commodity | Price | Day Chg % | Ticker | Source |
|---|---|---|---|---|
| Brent Crude | $104.82 | −0.95% | BZ=F | yfinance (BZX26, Nov) |
| WTI Crude | $101.91 | −0.51% | CL=F | yfinance (CLV26, Oct) |
| Gold ($/oz) | $4,399.70 | +0.28% | GC=F | yfinance (GCZ26, Dec) |
| Silver ($/oz) | $66.10 | +1.81% | SI=F | yfinance (SIZ26, Dec) |
| Copper ($/lb) | $6.6615 | +2.34% | HG=F | yfinance (HGZ26, Dec) |
| Nat Gas ($/MMBtu) | $2.901 | +0.35% | NG=F | yfinance (NGV26, Oct) |
Day changes are settlement (2026-09-17) vs the prior session's settlement (2026-09-16). Prices are the 17 September settlements of the contracts named.
Oil settled lower for a second session after Wednesday's 3.2% fall, but only just: WTI's October contract settled at $101.91, 52 cents under Wednesday's $102.43, and Brent's November contract at $104.82, $1.01 under $105.83, both a little lower than the afternoon quotes, the extra Saudi cargoes through Oman and the "days" restart timetable for the East-West pipeline (Bloomberg) weighing against a market that still has both benchmarks above $100 and the analysts' "weeks" timetable unresolved. WTI is 14.7% below its 52-week high of $119.48 and Brent 16.9% below its $126.10; their all-time highs are the 2008 contracts' $147 prints and are not a useful reference. WTI's October contract (CLV26) expires on 22 September, three trading days away; the generic will roll to November and the quoted level will jump by the calendar spread with no market move behind it, so Monday's or Tuesday's WTI change should be read against the contract named, not the headline. Gold settled at $4,399.70, 21.2% below its all-time high of $5,586.20 (29 January 2026), silver at $66.10 (settlement 66.095), 45.5% below its $121.30 record of the same date; both extended their afternoon gains into the settlement with yields and the dollar lower, silver by more, as usual. Copper settled at $6.6615 a pound (+2.34%, the largest move in the table), 2.1% below its all-time high of $6.8055 set on 9 September, slightly below the record and within the range where the White House copper-tariff decision, still unresolved, is the only thing between it and a new one. Natural gas at $2.901 sits in the lower third of its $2.483 to $7.827 52-week range; its record is the 2005 contract's $15.78 and is not a reference.
Crypto: Bitcoin at about $76,400 (web search) is within 1% of Wednesday, holding above $75,000 through the Fed's hike; no notable move.
Sector & Theme Highlights
- Rates-sensitive rebound, both sides of the Atlantic. The 7 bp fall in the 10-year Treasury and the 10 bp fall in the 10-year gilt produced the same leadership: technology and semiconductors in the US (chip gauge +3%, Nasdaq 100 +1.73%), banks and power equipment in Europe (Santander, BBVA and Deutsche Bank about +2%; Siemens Energy, Schneider and Siemens +2.5% to +3.5%), autos (Stellantis +2.5%, Renault +2.1%, BMW +1.9%) and the FTSE 100 (+1.19%) as the best large index in Europe on the gilt rally.
- Energy and materials lag in Europe with oil down for a second session and metals mixed; Wednesday's US session had already taken energy down 3% and financials 1.6% on the FOMC, and today's rebound left energy behind.
- AI hardware: three sessions, three directions. Monday's 5.9% fall in the chip index on AI-slowdown calls, Wednesday's Intel and SK Hynix memory rally, today's 3% rise on lower yields. The sector is trading rates and supply-chain headlines, not results, until October.
- Emerging markets are the largest beneficiary of a lower dollar and lower yields on the day (EEM +1.81%, EZA +1.69%), but the China benchmarks fell (Hang Seng −0.44%, Shanghai −0.41%) while everything else rose, and India remains below both its averages.
- Sovereign supply as a policy tool. The BOE's six-month pause in gilt sales, and the end of long-dated sales, moved the 30-year gilt 10 bp on a day Bank Rate did nothing; the euro-area equivalent, the OAT-Bund spread at 96 bp, has no such lever.
Top Stories (Global)
- US stocks recover the Fed: the S&P 500 closed +1.14% at 7,637.76, the Nasdaq 100 +1.73% at 29,446.98 and the Dow +0.61% at 51,778.00, more than reversing Wednesday's post-FOMC falls, with chipmakers +3% as a group; the 10-year Treasury settled at 4.94% (−7 bp, US Treasury par curve), ending an eight-session rise that ran to Wednesday's 5.01% settlement, the highest since 2007 (Bloomberg, Yahoo Finance).
- Bank of England holds at 3.75%, 6 to 3, and pauses gilt sales: three members voted for 4.00%; active QT sales are suspended for six months, sales of long-dated gilts end, and the remaining £488 billion of holdings will run down at about £46 billion a year to 2034. The 10-year gilt fell 10 bp to 5.25% and the 30-year 10 bp to 5.76%, the 2-year 2 bp to 4.61%; the Bank sees CPI reaching 4% early next year and raised its Q3 GDP estimate to 0.4% (Reuters, CNBC, Trading Economics). GBP/USD fell 0.23% to 1.3354.
- US labour market firmer than the housing market: initial claims 196,000 against 208,000 expected (Reuters, Bloomberg); housing starts 1.275 million, −2.6%, on a multifamily fall that hid a 7.6% single-family rise (Census); Philadelphia Fed 37.8 against 31.3 expected, down from 47.4.
- Oil lower for a second session after Wednesday's 3.2% fall: WTI settled at $101.91 (−0.51%) and Brent at $104.82 (−0.95%) as Saudi Arabia routes extra cargoes through Oman and repeats that the East-West pipeline restarts within days (Bloomberg); both benchmarks are still above $100.
- Euro area final HICP 3.2% for August, revised down from the 3.3% flash and up from 2.9% in July, energy +14.3% on the year, its highest since January 2023, services contributing 1.43 pp (Eurostat). The euro AAA 2-year at 3.17% still prices a third ECB hike after June's 2.25% and September's 2.50%.
- Europe's second consecutive gain, after Wednesday's rebound ended a two-session fall: the STOXX 600 +0.86% to 642.60, the Euro STOXX 50 +0.90%, the FTSE 100 +1.19%; banks, power equipment and autos lead, energy and materials lag. Corporate: the EU raised preliminary objections to MMG's purchase of Anglo American's nickel business on ferronickel supply grounds; RWE lifted its stake in Amprion's holding company to about 58%; AstraZeneca committed CNY 200 million to its Wuxi site; Exosens raised full-year guidance (Newsquawk).
- BOJ tomorrow: a hike from 1.00% to 1.25%, the highest since 1995, is priced as near-certain; the 10-year JGB held at 3.00% and the 30-year at 4.08%, and USD/JPY at 156.03 is 2.6 yen weaker than Wednesday's pre-FOMC quote (Trading Economics, Japan Times). Tokyo is closed Monday.
Looking Ahead
Central banks - Thursday 17 September: Bank of England, delivered: a 6 to 3 hold at 3.75% with three votes for a hike, a six-month pause in gilt sales and the end of long-dated sales. The next meeting is in November; the three dissents and a CPI forecast reaching 4% say a hike there is live, and the gilt market's 10 bp rally says the supply decision mattered more today. - Friday 18 September: BOJ, statement after the Asian open, press conference 06:30 GMT. A hike from 1.00% to 1.25% is priced; the reaction will be to guidance on a further move this year, with the JGB 10-year at 3.00% and USD/JPY at 156.03 the instruments. Tokyo is closed the following Monday and on Wednesday, so next week has only three JGB sessions. - Fed: no meeting until late October; Wednesday's dots have one more hike this year for 16 of 18 participants, and the Fed speakers who resume after the blackout will be read against a 10-year that has just turned down from 5.01%. - ECB: no meeting until October; the AAA 2-year at 3.17% prices a third hike after June and September.
Economic releases - Friday 18 September: UK retail sales for August, the first activity print after the BOE; euro area current account; US leading index; the BOJ. - Next week: flash PMIs for the euro area, UK and US (Wednesday 23 September); US new home sales, durable goods, the third Q2 GDP estimate and PCE inflation for August (Friday 26 September), the first inflation print the Fed sees after its hike.
Earnings - No major reports scheduled. The AI hardware names trade on supply-chain and policy headlines until the October reporting season.
Geopolitical - The Saudi East-West pipeline: the administration says days, the analysts say weeks; the extra cargoes through Oman are the interim route, and both crude benchmarks above $100 are the market's view that the interruption is not over. - The White House copper-tariff decision is unresolved; copper is 2.1% below its 9 September record. - WTI's October contract expires on 22 September, three trading days away; the generic rolls to November and the quoted level will jump by the calendar spread.
Market closures - No closures in the next five calendar days (18 to 22 September) across the US, UK, Germany, France, Australia, Switzerland, Canada, Korea or Brazil, with one exception: Japan is closed Monday 21 September (Respect for the Aged Day), the first session after the BOJ decision. - Further out: Japan 23 September (Autumnal Equinox Day); Korea 24, 25 and 26 September (Chuseok); Canada 30 September (National Day for Truth and Reconciliation). - No Indian holiday data is available here, so Indian closures are not checked.
Data sources: US Treasury par and real curves (17 September) and FRED (policy rates, VIX, credit spreads, macro); ECB YC API (AAA curve, 16 September) and ECB SPF (2026 Q3); equity indices, ETF P/E proxies, commodity futures, live yields and FX via Yahoo Finance (taken at 20:41 CEST, with the Americas indices, EEM, EZA and the commodity settlements at the 17 September close); European, UK and Japanese bond yields, economic releases and news via web search (Trading Economics, Reuters, Bloomberg, CNBC, Eurostat, Census, Newsquawk, Investing.com).