2026 09 16
Global Financial Briefing — Wednesday, 16 September 2026
Americas index levels, commodities and day changes reflect the 16 September closing print; the USA row of the bond table, the curve spreads, the US real yield and the US yield curve chart use Treasury's settled 16 September curves, and the outcomes of the FOMC and Copom decisions are included. European and Asian closes are final. The euro area yield rows, credit, FX and macro figures are dated inline.
Market Overview
Markets spent the day before the Fed's decision unwinding a little of what they had done on the way in, and then the decision undid the unwinding. The FOMC raised the target range by 25 bp to 3.75% to 4.00%, a unanimous 12 to 0 vote, the first change to a range that had stood at 3.50% to 3.75% in every one of this briefing's archives since 20 April and the Fed's first increase since 2023 (Fox Business); the statement said inflation "remains elevated", and the dot plot had 16 of 18 participants expecting at least one more hike this year, four of them two, with no further increases pencilled in beyond 2026 and one cut each in 2028 and 2029 (CNBC, Seeking Alpha). That was more than the "insurance" framing the market had hoped for, and Chair Kevin Warsh's press conference, read as hawkish on inflation and terse on the AI investment cycle (Fortune), is where the day's prices were made. All three US indices had been higher before 14:00 ET: the S&P 500 closed down 0.45% at 7,551.81 after being up 0.30% at midday, the Dow fell 1.21% to 51,461.90, its 631-point loss the largest move in the table, and the Nasdaq 100 gave back a 0.77% gain to close flat (+0.02%) at 28,945.06, the chipmakers' Intel and SK Hynix rally the only thing that survived the afternoon. The Treasury curve bear-flattened on the 16 September par curve: the 2-year rose 7 bp to 4.74%, the 1-year 6 bp to 4.45% and the 3-month bill 3 bp to 4.14%, while the 10-year rose 1 bp to 5.01%, a new high for this briefing's archive and its highest settlement since 2007, and the 30-year fell 1 bp to 5.35%. The morning's live quotes (10-year 4.96%, −3 bp at 12:19 ET) were a pre-decision rally that the settlement reversed. Oil did the other half of the day's work: WTI's October contract settled at $102.43, −3.21% against Tuesday's $105.83, and Brent's November contract at $105.83 (−2.69%) against $108.75, after the US Energy Secretary told CNBC that the outage on Saudi Arabia's East-West pipeline would be "measured in days"; independent analysts reading satellite images of the damaged pumping station still say weeks, and the physical premium over futures that yesterday's briefing put at $20 to $25 a barrel is the market's own verdict on which of them is right. The data pulled the other way from oil. August retail sales rose 1.2% against 0.8% expected, after a revised −0.5% in July, and the control group that feeds GDP rose 1.4% against 0.4%, the strongest month since March: a consumer who was supposed to be flagging after last week's Michigan survey spent more on everything, not just on fuel. The VIX closed Tuesday at 17.20 (FRED VIXCLS, 15 September), moderate, and was quoted near 16.8 before the decision; Wednesday's close is not yet on FRED.
Europe closed higher for the first time since 11 September, ending a two-session fall: the STOXX 600 rose 0.46% to 637.09, the CAC 40 0.62% to 8,140.59, the DAX 0.53% to 25,537.75, the FTSE 100 0.28% and the SMI 0.43%, with the Euro STOXX 50 up 0.48% at 6,266.50. Banks led and oil's fall did the rest; it is a relief rally, not a reversal, with the STOXX 600 still 1.8% under its 50-day average and the CAC 40 the only major index in the table under both its 50-day (8,419) and 200-day (8,240) averages. The euro AAA curve for 15 September, published today, gave back part of Monday's front-end jump: the 2-year fell 4 bp to 3.19% after rising 10 bp the day before, the 1-year 4 bp to 2.99%, the 5-year 2 bp to 3.28%, while the 10-year was unchanged at 3.54% and the 20-year and 30-year each rose 1 bp to 3.85% and 3.80%. Today's Bund quotes are lower again, the 10-year at 3.51% (−2 bp), the 2-year at 3.22% (−2 bp) and the 30-year at 3.88% (−2 bp); the 10-year OAT fell 3 bp to 4.48%, so the OAT-Bund spread widened a basis point to 97 bp, and Italy at 4.38% (−4 bp) yields 10 bp less than France. The UK had the day's largest bond move in either direction. August CPI came in at 3.1%, in line with expectations and up from 2.9%, the first print above 3% since March, with motor fuel up 23% on the year; the gilt market read "in line" as "no November hike needed" and rallied across the curve, the 2-year down 14 bp to 4.63%, the 5-year 11 bp to 4.85%, the 10-year 8 bp to 5.30% after Tuesday's 5.41% high, and the 30-year 6 bp to 5.87%, back under the 6% it touched this week. A hold at 3.75% tomorrow is priced above 80%.
Asia rose ahead of the Fed and, for once, held its gains into the close. The Kospi's 1.37% rise to 6,717.97 is its first gain since 9 September (7,051.64), ending a four-session fall of 6.0%, and SK Hynix's Intel news is the reason; the Nikkei rose 0.69% to 63,923.00, the Hang Seng 0.19%, Shanghai 0.71%, the ASX 200 0.28% and the Nifty 50 0.43%. The 10-year JGB fell 4 bp to 3.00% after Tuesday's 3.04%, its highest since September 1996, with the BOJ expected to raise its policy rate from 1.00% to 1.25% on Friday, its second increase this year after the move to 1.00% on 16 June. The yen is the day's currency story: USD/JPY at 153.43 (−0.59%) has come 1.6 yen off Tuesday's 155.08 with the BOJ two days away and oil lower, while GBP/USD at 1.3537 (−0.05%) and USD/CHF at 0.8181 (+0.16%) barely moved. Credit widened a fraction further: US high yield at 276 bp (FRED, 15 September) is 5 bp wider than Monday's 271 bp and 11 bp wider than Friday's 265 bp, still under the 300 bp floor of the normal range, with investment grade unchanged at 80 bp and euro high yield at 275 bp. Gold settled up 1.26% at $4,387.50 and silver 1.66% at $64.92 on the lower dollar and the morning's dip in yields, copper up 1.02% at $6.509; all three metals settle by 13:30 ET, before the statement, so none of those prices knows the decision. Brazil's Copom cut the Selic by 25 bp to 13.75% from 14.00% after 18:30 in Brasília, a unanimous decision that brings the easing since March to 125 bp and leaves the next step open (Bloomberg, InfoMoney): two central banks moving in opposite directions within four hours of each other, and the Bovespa, flat at midday, closed down 0.51% at 185,547.66 between them. Bitcoin at about $75,950 (07:00 ET) was unchanged from Tuesday's close after the CLARITY Act's cloture vote failed.
Global Indices Snapshot
Americas
| Index | Level | Day Chg | Day Chg % | Source |
|---|---|---|---|---|
| S&P 500 | 7,551.81 | -33.92 | -0.45% | yfinance ^GSPC |
| Nasdaq 100 | 28,945.06 | +7.22 | +0.02% | yfinance ^NDX |
| Dow Jones | 51,461.90 | -631.21 | -1.21% | yfinance ^DJI |
| Brazil IBOV | 185,547.66 | -954.98 | -0.51% | yfinance ^BVSP |
Americas data reflects the 16 Sep close. FRED's SP500 series confirms the 16 September close at 7,551.81, and every previousClose field reconciles with price − change (S&P 500 prior close 7,585.73). The close reversed the midday picture: the S&P 500 was up 0.30% at 12:33 ET and closed down 0.45%, the Dow turned a 0.09% dip into a 1.21% fall, and the Nasdaq 100 gave back almost all of a 0.77% gain to finish 7 points higher, the turn coming during Chair Warsh's press conference rather than on the 14:00 ET statement. The S&P 500 is 3.4% below its record of 7,816.70 and 0.8% under its 50-day average (7,612.00), its second consecutive close below it after Tuesday's 0.3%, and 5.3% above its 200-day (7,175); the Nasdaq 100 is 0.8% under its 50-day (29,174) and 5.9% below its record; the Dow is 2.7% under its 50-day (52,909) and 6.0% below its record, the banks and consumer names that led it down on Monday and Tuesday now joined by everything rate-sensitive. The Bovespa, up 0.54% on Tuesday with oil, closed down 0.51% with oil down 3% and the Selic cut still to come, 6.9% below its record.
Europe
| Index | Level | Day Chg | Day Chg % | Source |
|---|---|---|---|---|
| Euro STOXX 600 | 637.09 | +2.91 | +0.46% | yfinance ^STOXX |
| CAC 40 | 8,140.59 | +50.31 | +0.62% | yfinance ^FCHI |
| DAX | 25,537.75 | +135.47 | +0.53% | yfinance ^GDAXI |
| FTSE 100 | 10,688.47 | +30.34 | +0.28% | yfinance ^FTSE |
| SMI (Swiss) | 13,868.66 | +59.79 | +0.43% | yfinance ^SSMI |
European data reflects today's cash close (16 Sep). The Euro STOXX 50 closed at 6,266.50, up 0.48%. Every previousClose field reconciles with price − change. The STOXX 600's first gain since 11 September leaves it 4.0% below its record of 663.41, 1.8% under its 50-day average (648.54) and 2.7% above its 200-day (620.46). The CAC 40 at 8,140.59 is 3.3% under its 50-day and 1.2% under its 200-day (8,240), still the only one of the five below both, and 7.0% below its record; the DAX is 0.8% under its 50-day and 3.2% above its 200-day, the FTSE 100 0.5% under its 50-day and 2.7% below its record, and the SMI 3.1% under its 50-day after Tuesday's UBS-led fall.
Asia-Pacific
| Index | Level | Day Chg | Day Chg % | Source |
|---|---|---|---|---|
| Nikkei 225 | 63,923.00 | +438.90 | +0.69% | yfinance ^N225 |
| Hang Seng | 24,713.78 | +46.54 | +0.19% | yfinance ^HSI |
| Shanghai Comp | 3,891.60 | +27.32 | +0.71% | yfinance 000001.SS |
| ASX 200 | 8,696.50 | +24.00 | +0.28% | yfinance ^AXJO |
| Kospi (Korea) | 6,717.97 | +90.71 | +1.37% | yfinance ^KS11 |
Asia-Pacific data reflects today's close (16 Sep). For the Hang Seng, Shanghai and the ASX 200 the previousClose field yfinance returned was the 14 September close, a session stale, but the change field reconciles exactly with the 15 September closes in the price history (24,667.24, 3,864.28 and 8,672.50), so the day changes shown are correct and the stale field is ignored. The Kospi's 1.37% gain is its first since 9 September and ends a four-session fall from 7,051.64; it remains 28.4% below its record of 9,385.59 and 0.5% under its 50-day average, 9.0% above its 200-day. The Nikkei is 12.2% below its record and 3.0% under its 50-day; the Hang Seng at 24,714 is 3.5% under its 200-day (25,616) and Shanghai at 3,892 is 2.9% under its 200-day (4,009), both Chinese markets still below both averages; the ASX 200 is 1.4% under its 200-day (8,821).
Emerging Markets
| Index | Level | Day Chg % | Source |
|---|---|---|---|
| MSCI EM (EEM) | 65.72 | -0.06% | yfinance EEM |
| India Nifty 50 | 23,217.60 | +0.43% | yfinance ^NSEI |
| South Africa | 67.55 | -1.99% | yfinance EZA |
EEM and EZA reflect the 16 Sep close. The Nifty 50 is the 16 September close (15:31 IST) against the 15 September close of 23,118.60, a single-session change this time; it is 3.8% under its 50-day, 5.3% under its 200-day and 12.0% below its record. EEM closed at 65.72, down 0.06%, having been up 0.89% at midday: the Korean and Chinese gains that lifted it in the morning were taken back by the dollar and the front end of the curve after the Fed, and it ends 0.2% under its 50-day average (65.83), where it had been 0.8% above at midday, and 8.2% below its record of 71.57. EZA fell 1.99% to 67.55, more than double its midday loss, despite gold, giving back Tuesday's 0.63% gain and more.
Index Valuations & Investment Risk
Valuation Table
| Index | Trailing P/E (live) | Hist avg trailing P/E (†) | Premium / discount to hist. midpoint |
|---|---|---|---|
| S&P 500 | 24.55x | ~16-18x | +44% |
| Nasdaq 100 | 28.93x | ~25-30x | +5% |
| Euro STOXX 600 | 17.54x | ~15-17x | +10% |
| CAC 40 | 16.55x | ~14-16x | +10% |
| DAX | 18.08x | ~15-17x | +13% |
| FTSE 100 | 15.32x | ~13-15x | +9% |
| Nikkei 225 | 21.19x | ~20-22x | +1% |
| MSCI EM | 14.11x | ~13-15x | +1% |
(†) Static long-run reference constants, not live data. Live trailing P/E from yfinance trailingPE on ETF proxies (SPY, QQQ, EXSA.DE, CAC.PA, EXS1.DE, ISF.L, 1321.T, EEM), quoted at 18:34 CEST, the European and Asian proxies on their closes; the US-listed proxies (SPY, QQQ, EEM) stood at 24.36x, 28.72x and 13.98x after the 16 September close, each 0.7% to 0.9% under the midday value and inside the 1% threshold at which a row is revised, so the table stands and the earnings yields below are computed from it. Premium is (live ÷ midpoint − 1). The S&P 500 at 24.55x is the only index above the 40% "historically stretched" threshold; the Nasdaq 100, the Nikkei and MSCI EM sit inside their historical bands.
Investment Risk Assessment for ETF Investors
United States (S&P 500 / Nasdaq ETFs)
The S&P 500's earnings yield is (1÷24.55) = 4.07%. Against the settled 10-year at 5.01% (US Treasury par curve, 16 September) the earnings yield gap is −0.94 pp: the 10-year Treasury pays 94 bp more than the index earns, before any growth. Against the 10-year real yield of 2.68% (US Treasury real curve, 16 September) the gap is +1.39 pp, the 2.33 pp difference being the market-implied inflation rate that a fixed coupon does not grow with and earnings, roughly, do. That correction is what flips the sign, and its size is the point of interest: on quoted prices alone a bond paying 5.01% for ten years out-earns the index, and only the growth the gap omits puts equities ahead. The real gap narrowed 6 bp on the day because the real yield rose 6 bp while the nominal rose 1 bp: the market took the hike as real tightening, not as inflation. The Nasdaq 100 at 28.93x earns (1÷28.93) = 3.46%, a nominal gap of −1.55 pp and a real gap of +0.78 pp. Only the dividend and buyback portion of the earnings yield reaches the holder as cash, so both gaps overstate the income an equity investor actually receives. Level and trend: the S&P 500 at 7,551.81 is 0.8% under its 50-day average (7,612) and 5.3% above its 200-day (7,175), 3.4% below its record, 19.6% above its 52-week low of 6,316.91; the Nasdaq 100 is 0.8% under its 50-day and 6.5% above its 200-day. The day's specific risk resolved at 14:00 ET, and not the way the "insurance hike" case wanted: the dot plot has 16 of 18 participants expecting at least one more increase this year, and the chair's press conference was read as hawkish. The S&P 500 gave up 0.75 pp between midday and the close on that alone, with retail sales (control group +1.4%) having already removed the "consumer is cracking" argument for a one-and-done. Concentration and AI capex risk are unchanged; the SK Hynix report is a reminder that the memory and foundry names now move on supply-chain geography as much as on demand, and they were the only part of the market that held a gain into the close.
Europe (STOXX 600 / CAC 40 / DAX ETFs)
The STOXX 600's earnings yield is (1÷17.54) = 5.70%. Against the euro AAA 10-year at 3.54% (ECB YC API, 15 September) the euro earnings yield gap is +2.16 pp, and +2.19 pp against today's 3.51% Bund quote; against the constructed euro real 10-year of 1.51% (AAA nominal 3.54% less the ECB SPF long-term HICP expectation of 2.04%, 2026 Q3) it is +4.20 pp. The CAC 40 at 16.55x earns 6.04%, +1.56 pp over the 10-year OAT at 4.48%; the DAX at 18.08x earns 5.53%, +2.02 pp over the Bund; the FTSE 100 at 15.32x earns 6.53%, +1.23 pp over a 10-year gilt at 5.30%. The US-euro comparison, −0.94 pp against +2.16 pp nominal, is partly the difference between the two currencies' inflation and policy paths rather than a difference in risk compensation, and the real-yield version narrows it: +1.39 pp against +4.20 pp, still 2.81 pp in Europe's favour, but with the caveat that the US real yield is a traded price and the euro one is a survey subtraction (see Real Yields below). On relative valuation the US trades at a 40% premium to the STOXX 600 on trailing earnings (24.55x against 17.54x). The European risks are the ones in the bond table: an OAT-Bund spread at 97 bp with the OAT yielding 10 bp more than the BTP, a Bund 10-year that touched its highest since June 2009 this week, an ECB that has hiked twice since June (2.25% on 17 June, 2.50% on 10 September) with the AAA 2-year at 3.19% pricing a third, and an oil price that, at $105 Brent, is still the largest single input to euro-area inflation. A EUR-based investor holding EUR-quoted European funds has no FX effect on the quoted value of the holding, but the STOXX 600 and CAC 40 constituents earn abroad, so currency exposure sits inside the earnings, smaller and slower than for a USD fund but not absent.
Japan (Nikkei / TOPIX ETFs)
The Nikkei 225 at 21.19x is inside its historical band and earns 4.72%, +1.72 pp over a 10-year JGB at 3.00%. The BOJ is expected to raise its rate to 1.25% on Friday, its second hike this year after the move to 1.00% on 16 June, and the yen has begun to move ahead of it: USD/JPY at 153.43 is 1.6 yen stronger than Tuesday. For a EUR- or USD-based holder the currency decision, hedged or unhedged, is likely to matter more than the index over the next week; an unhedged position gains if the BOJ delivers and the yen extends, and the hedge cost is rising as the rate differential narrows. The Nikkei at 63,923 is 12.2% below its record and 3.0% under its 50-day average. Tokyo is closed on Monday 21 September, the first session after the decision.
Emerging Markets (MSCI EM ETFs)
EEM at 14.11x is at its historical midpoint and earns 7.09%, the highest earnings yield in the table. The morning's gain (+0.89% at midday) was Korea and China, the Kospi's SK Hynix rally and Shanghai's 0.71%, and the afternoon took it away: EEM closed down 0.06% at 65.72 once the dot plot lifted the dollar and the 2-year. The risks are the ones that arrived: a Fed hike with more signalled strengthens the dollar and raises the cost of EM carry, the Copom cut to 13.75% narrows Brazil's premium at the same moment, and China's two-speed data (output +5.2%, retail sales +0.4% in August) keeps the domestic demand story unresolved. EEM is 8.2% below its record and 0.2% under its 50-day.
Overall Risk Score: High valuation risk / low margin of safety for the S&P 500, at a 44% premium to its historical trailing P/E with a nominal earnings yield gap of −0.94 pp on the day the Fed raised the target range to 3.75% to 4.00% and signalled more; Moderate for the Nasdaq 100, Europe and Japan, all within 15% of their historical bands but each facing a live rates decision this week; Attractive relative valuation for MSCI EM on earnings yield, with the dollar and the Fed the offsetting risk.
US Economic Indicators (FRED - authoritative)
| Indicator | Current | Prior | Delta | Reference Date | FRED Series |
|---|---|---|---|---|---|
| CPI YoY % | 3.35% | 3.30% (Jul) | +5 bp | Aug 2026 | CPIAUCSL |
| Core CPI YoY % | 2.45% | 2.47% (Jul) | −2 bp | Aug 2026 | CPILFESL |
| Unemployment Rate | 4.1% | — | — | Aug 2026 | UNRATE |
| Nonfarm Payrolls | +162k | — | monthly chg | Aug 2026 | PAYEMS |
| 10Y TIPS Real Yield | 2.68% | 2.62% (15 Sep) | +6 bp | 16 Sep 2026 | DFII10 (US Treasury real curve) |
The monthly rows are unchanged from Tuesday, the prior-month CPI rates being the July observations recorded in earlier briefings; only the latest observation is retrieved for unemployment and payrolls, so those Prior and Delta cells stay blank. The real 10-year is the settled 16 September figure, against 2.62% on 15 September; a 6 bp rise on the day of the hike, against 1 bp on the nominal 10-year, is the market treating the move as real tightening. Market-implied inflation (5.01% − 2.68%) is 2.33%, down from 2.38%.
Other economic releases today (web search):
| Release | Actual | Consensus | Prior | Reaction |
|---|---|---|---|---|
| US retail sales, Aug, m/m | +1.2% | +0.8% | −0.5% (rev.) | Beat; strongest since March; $773.9 bn, +6.0% y/y |
| US retail sales control group, Aug, m/m | +1.4% | +0.4% | −0.4% | Beat by 1.0 pp |
| UK CPI, Aug, y/y | 3.1% | 3.1% | 2.9% | In line; highest since March; motor fuel +23% y/y; gilts rallied |
| Euro area final HICP, Aug | (publishes 17 Sep) | 3.3% (flash) | 2.9% | Not today |
The retail sales report is the last piece of data the FOMC sees before it votes and it points one way: a 1.2% headline and a 1.4% control group after two soft months, the strongest monthly gain since March, at a time when the Fed's argument for a single insurance hike rests partly on a consumer that is slowing. The 10-year was 3 bp lower after it in the morning and settled 1 bp higher once the Fed had spoken, which says the number changed the dot-plot debate rather than the decision. Part of the headline is price (fuel and food at higher prices), but the control group excludes gasoline and still rose 1.4%. The control group is the Census Bureau's retail sales survey with four categories taken out: motor vehicles and parts, gasoline stations, building materials and food services. It is called that because the Bureau of Economic Analysis (BEA), the Commerce Department agency that compiles GDP, personal income and the PCE price index, uses it to control its estimate of goods consumption in the national accounts; cars, building materials and restaurants are measured elsewhere in GDP, and gasoline receipts move with the pump price rather than with volume. Roughly 70% of the headline, it is the cleanest monthly read on underlying goods demand, which is why a 1.4% gain in a month when crude was above $100 says the spending was not at the pump. Two caveats: the figures are nominal, so part of the gain is price, and the first estimate is revised twice, as July's cut to −0.5% shows. The UK print was in line and the gilt market treated in line as good news, the 2-year falling 14 bp: with the Bank of England expected to hold tomorrow and CPI now seen reaching 4% by early 2027, the market had been pricing hikes for a print that came in exactly as forecast. The euro-area final HICP for August, which yesterday's calendar had for today, is in fact published tomorrow.
Fixed Income & Bond Analysis
Policy Rates
| Central Bank | Rate | Source |
|---|---|---|
| Fed Funds (upper) | 3.75% | FRED DFEDTARU (2026-09-16); raised to 4.00% at 14:00 ET, effective 17 Sep |
| Fed Funds (lower) | 3.50% | FRED DFEDTARL (2026-09-16) |
| Effective FFR | 3.63% | FRED DFF (2026-09-14) |
| ECB Deposit Rate | 2.50% | FRED ECBDFR (2026-09-16) |
| BOJ Policy Rate | 1.00% | web search (Japan Times, 12 Sep); hike to 1.25% expected 18 Sep |
| BOE Bank Rate | ~3.73% (SONIA/FRED) | FRED IUDSOIA (2026-09-14); Bank Rate 3.75%, decision 17 Sep |
The Fed row is the range in force during the 16 September session, 3.50% to 3.75%, unchanged in every archive of this briefing since 20 April 2026; the FOMC raised it by 25 bp to 3.75% to 4.00% at 14:00 ET on a 12 to 0 vote, and the new range takes effect on 17 September, so FRED's series will show it from tomorrow's observation. The dot plot has 16 of 18 participants expecting at least one further increase in 2026, four of them two. The ECB's 2.50% is the 10 September decision, its second hike this year after June's 2.25%; the BOJ's 1.00% dates from 16 June. The effective rate at 3.63% is 1 bp above the old midpoint, and the 3-month bill at 4.14% (16 September) is 26.5 bp above the new 3.875% midpoint, on the edge of the 25 bp sanity band, against 48.5 bp above the old one on Tuesday's curve: the bill has the hike in it and a little of the next.
Government Bond Yields
| Country | 2Y Yield | 10Y Yield | 30Y Yield | Day Chg (10Y) | Source |
|---|---|---|---|---|---|
| USA | 4.74% | 5.01% | 5.35% | +1 bp | US Treasury par curve (2026-09-16), vs 2026-09-15 |
| Germany | 3.19% | 3.54% | 3.80% | 0 bp | ECB AAA curve (2026-09-15), vs 2026-09-14; Bund quotes 3.22% / 3.51% / 3.88% (Trading Economics, 16 Sep intraday, 10Y −2 bp) |
| France | 3.45% | 4.48% | 5.12% | −3 bp | web (Trading Economics, 16 Sep intraday) |
| UK | 4.63% | 5.30% | 5.87% | −8 bp | web (Trading Economics, 16 Sep intraday) |
| Japan | — | 3.00% | — | −4 bp | web (Trading Economics, 16 Sep) |
| Italy | — | 4.38% | — | −4 bp | web (Trading Economics, 16 Sep intraday) |
The USA row is the settled US Treasury par curve for 16 September, with the day change against 15 September (10-year 5.00%). The curve bear-flattened on the decision: the 3-month rose 3 bp to 4.14%, the 6-month 5 bp to 4.22%, the 1-year 6 bp to 4.45%, the 2-year 7 bp to 4.74%, the 3-year 6 bp to 4.82%, the 5-year 3 bp to 4.86%, the 7-year 3 bp to 4.94% and the 10-year 1 bp to 5.01%, a new high for this briefing's archive and the highest settlement since 2007, while the 20-year fell 1 bp to 5.39% and the 30-year 1 bp to 5.35%. The morning's live quotes (10-year 4.96%, −3 bp at 12:19 ET) were a pre-decision rally that the dot plot reversed; the 2-year's 7 bp is the market adding the second hike the dots point to. The German row is the ECB AAA composite for 15 September, published today, against 14 September: the 3-month fell 1 bp to 2.51%, the 1-year 4 bp to 2.99%, the 2-year 4 bp to 3.19%, the 5-year 2 bp to 3.28%, the 10-year was unchanged at 3.54% (+0.3 bp), the 20-year rose 1 bp to 3.85% and the 30-year 1 bp to 3.80%. That gives back a little under half of Monday's 10 bp jump at 2 years and none of it at 10: the front end had overshot on the ECB pricing and the long end has not moved. Today's Bund quotes (3.22% / 3.51% / 3.88%) are 2 bp lower across the curve than Tuesday's, with the 10-year having touched its highest since June 2009 this week. The French 10-year at 4.48% fell 3 bp, a basis point less than the Bund, so the OAT-Bund spread is 97 bp against 96 bp yesterday; the French 2-year at 3.45% is 23 bp over the Bund 2-year and the French 30-year at 5.12% is 124 bp over the Bund 30-year, the spread widening with maturity. Italy at 4.38% (−4 bp) yields 10 bp less than France. The gilt rally is the day's largest sovereign move: the 2-year fell 14 bp to 4.63%, the 5-year 11 bp to 4.85%, the 10-year 8 bp to 5.30% and the 30-year 6 bp to 5.87%, a bull steepening on an in-line CPI print and a market that had four hikes priced by mid-2027. The JGB 10-year fell 4 bp to 3.00%, back to the round number from Tuesday's 3.04%, two days before the BOJ.
Yield Curve Spreads: - 10Y-2Y spread: +27 bp (US Treasury par curve, 16 September), 6 bp flatter on the day and 26 bp flatter than a month ago (53 bp on the 17 August curve), matching the 27 bp of 22 and 23 June as the flattest this briefing's archive holds. Normal, not steep: a positive slope, with the 2-year up 55 bp in a month against 29 bp at 10 years, the shape of a market pricing the hikes rather than the growth; the morning's quotes had pointed to a small further flattening and the settlement delivered a large one. - 10Y-3M spread: +87 bp (same source and date), 2 bp flatter on the day and 2 bp above a month ago (85 bp). Comfortably positive; the bill now has the hike in it and a little of the next, and the 10-year has the oil.
OAT-Bund Spread: 97 bp (10-year OAT 4.48% against the 10-year Bund at 3.51%, both Trading Economics intraday 16 September), a basis point wider than Tuesday's 96 bp because the Bund fell 2 bp and the OAT 3 bp, but the OAT fell from a higher base. It remains among the widest levels of the year, and with the OAT 10 bp over the BTP the French fiscal premium is still the larger of the two. The 2-year spread of 23 bp and the 30-year spread of 124 bp show the premium concentrated in the long end, where the fiscal path matters most.
Yield Curve Charts
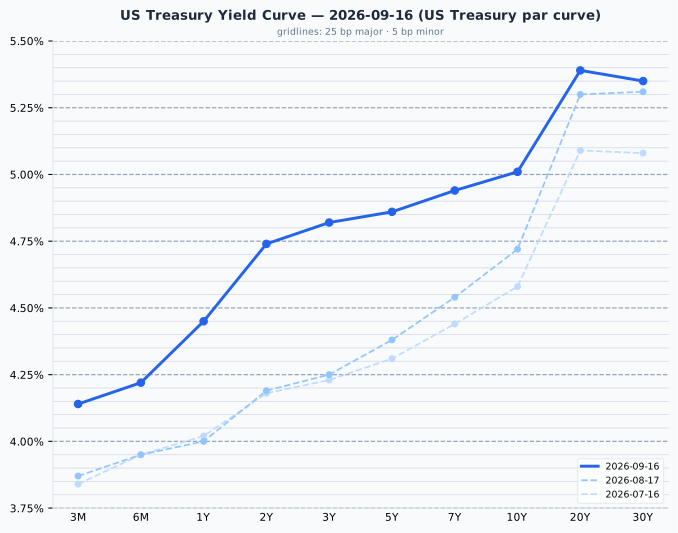
US Treasury par curve, 16 September 2026, against the 17 August and 16 July curves. The curve is upward-sloping throughout with a hump at 20 years (5.39% against 5.35% at 30), 27 bp between 2 and 10 years and 87 bp between 3 months and 10 years. Against the 17 August curve every point is higher: +27 bp at 3 months, +45 bp at 1 year, +55 bp at 2 years, +57 bp at 3 years, +48 bp at 5 years, +40 bp at 7 years, +29 bp at 10 years, +9 bp at 20 years and +4 bp at 30 years, a bear flattening concentrated in the 2-to-5-year belly where the Fed's path is priced; the day of the hike added to it at every point out to 10 years while the 20- and 30-year edged lower. The 3-month bill at 4.14% is 26.5 bp above the new 3.875% Fed Funds midpoint, on the edge of the 25 bp sanity band now that the hike has been delivered, against 48.5 bp above the old midpoint on Tuesday's curve.
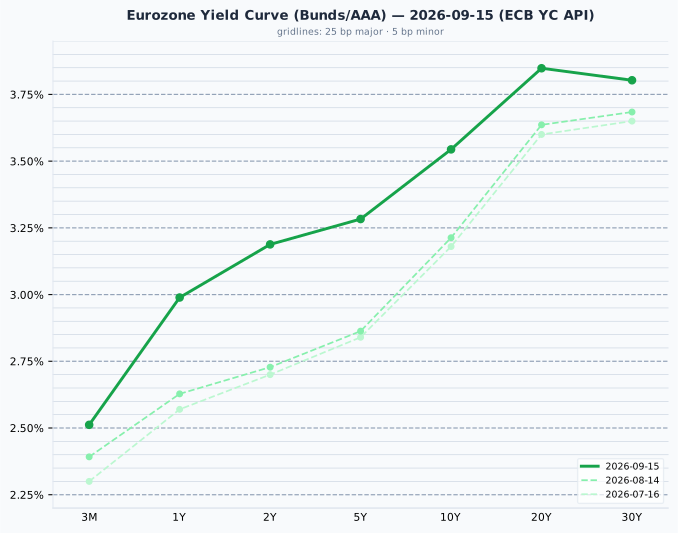
Euro area AAA government curve, 15 September 2026 (ECB YC API), against the 14 August and 16 July curves. The curve rises from 2.51% at 3 months to 3.54% at 10 years and 3.85% at 20, then dips to 3.80% at 30 years, the same 20-year hump as the US curve; the 2-to-10 slope is 36 bp, 5 bp steeper than Monday's 31 bp after the 2-year gave back 4 bp. Against the 14 August curve every point is higher: +12 bp at 3 months, +36 bp at 1 year, +46 bp at 2 years, +42 bp at 5 years, +33 bp at 10 years, +21 bp at 20 years and +12 bp at 30 years, a bear flattening of the same shape as the US one and centred on the 2-year, which is where the June and September ECB hikes and the pricing of a third have landed.
Credit Markets (from FRED - authoritative)
| Market | OAS Spread | Series ID |
|---|---|---|
| US Investment Grade | 80 bp | BAMLC0A0CM (2026-09-15) |
| US High Yield | 276 bp | BAMLH0A0HYM2 (2026-09-15) |
| Euro High Yield | 275 bp | BAMLHE00EHYIOAS (2026-09-15) |
US high yield at 276 bp is 5 bp wider than Monday's 271 bp and 11 bp wider than Friday's 265 bp, a second consecutive daily widening from Friday 11 September's 265 bp; it remains under the 300 bp floor of the normal range (300 to 500 bp) and so still reads as historically tight rather than normal, but the direction is the point. Investment grade is unchanged at 80 bp, the bottom of its 80 to 150 bp normal range. Euro high yield at 275 bp is a basis point tighter than US. Credit is noticing the 5% 10-year and the oil price a few basis points at a time; nothing here says stress, and tonight's decision is the test of whether the widening continues.
Real Yields (US and Euro Area)
| Region | Nominal 10Y | Expected inflation | Real 10Y | How the real yield is obtained |
|---|---|---|---|---|
| United States | 5.01% (US Treasury par curve, 16 Sep) | 2.33% (residual: nominal − real) | 2.68% (US Treasury real curve, 16 Sep) | Measured. TIPS trade, so the market quotes a real yield directly; expected inflation is the breakeven residual |
| Euro area | 3.54% (ECB AAA curve, 15 Sep) | 2.04% (ECB SPF long-term HICP expectation, 2026 Q3, measured) | 1.51% (residual: nominal − expected) | Constructed. No euro inflation-linked benchmark is published, so a survey expectation is subtracted from the nominal yield |
The two rows are built in opposite directions. The US real yield is a market price (TIPS) and its inflation figure is the residual; the euro area measures the inflation expectation by survey and infers the real yield. Only the US figure is something anyone trades, and the euro figure is the softer of the two. Two mismatches when comparing them: the US breakeven carries an inflation risk premium a survey does not, and the SPF horizon is five years against the bond's ten. Decomposing the 147 bp nominal gap between the two 10-years: 29 bp is expected inflation (2.33% against 2.04%) and 117 bp is real (2.68% against 1.51%), so about four-fifths of the gap is a real-rate story, a larger real share than Tuesday's 111 of 146 bp: the day of the hike raised the US real yield 6 bp and lowered the breakeven 5 bp, which is what a rate increase taken as credible should do. The euro real yield at 1.51% is up from 1.11% on 7 August, the AAA 10-year having risen 39 bp while the survey expectation is unchanged.
The US real yield has exceeded the euro one in every quarter since 2014 and the gap is a structural feature, not a trade a EUR-based reader can capture: hedged into euros the advantage disappears, because the forward rate removes the interest differential, and unhedged it is a currency bet rather than a bond decision. A real yield is real in its own currency; 2.68% is 2.68% above US inflation, which is not a real return for someone who spends euros.
Bond Portfolio Implications
The earnings yield gap for the S&P 500 is (1÷24.55) − 5.01% = −0.94 pp: the 10-year Treasury pays 94 bp more than the index earns, on a snapshot of quoted prices with no growth assumption. The euro gap is (1÷17.54) − 3.54% = +2.16 pp on the AAA curve. This measure compares today's income offer and does not forecast which asset wins; it leaves growth out, which understates equities by roughly expected inflation, and correcting for that with the real yields gives +1.39 pp for the US and +4.20 pp for the euro area, a 2.33 pp correction for the US and 2.04 pp for Europe. The correction flips the US sign, and it is the size of that correction rather than any agreement between two rearrangements of one equation that is informative. An equity holder receives only the dividend and buyback share of the earnings yield as cash; the rest is retained.
On the bond side, the settled 10-year at 5.01% is the highest yield this briefing's archive has recorded, a basis point above Tuesday's 5.00%, and the 30-year at 5.35% is a basis point under Tuesday's record 5.36%; the morning's live quotes (4.96% and 5.34%) turned out to be the low of the day, not the close. A 5.01% 10-year with a 2.68% real component is, on its own terms, the most a Treasury has offered since 2007, and it is now being offered with the overnight rate at 3.75% to 4.00%, a 3-month bill at 4.14% that has the hike in it, and a dot plot pointing to at least one more. Duration is the risk: a further 100 bp rise costs roughly 8 to 9% on a 10-year and 16 to 18% on a 30-year, and the 30-year's +4 bp in a month against +55 bp at 2 years says the long end has so far been the safer place to be in a hiking cycle that the front end is pricing; the day of the hike repeated the pattern, +7 bp at 2 years and −1 bp at 30. The gilt market's day is the counter-example: 14 bp off the 2-year on an in-line print shows how much of the front end's move is hike pricing that can reverse on a single number. For a euro investor the AAA 10-year at 3.54% and the OAT at 4.48% are the relevant comparison, and at 4.48% the OAT is above the BTP for a reason the market has not stopped pricing.
Currencies & Commodities
Currencies:
| Pair | Rate | Source |
|---|---|---|
| EUR/USD | 1.1604 | FRED DEXUSEU (2026-09-11) |
| USD Index | 118.21 | FRED DTWEXBGS (2026-09-11) |
| USD/JPY | 153.43 (−0.59%) | web search (16 Sep intraday) |
| GBP/USD | 1.3537 (−0.05%) | web search (16 Sep intraday) |
| USD/CHF | 0.8181 (+0.16%) | web search (16 Sep intraday) |
FRED's EUR/USD and broad dollar index are the 11 September observations, the newest published; the FRED FX series lag by several business days. The yen is the day's move: USD/JPY at 153.43 is 1.65 yen stronger than Tuesday's 155.08 print, with the BOJ expected to hike on Friday, the 10-year JGB back to 3.00% and oil down 3%, which helps an importer. Sterling is flat at 1.3537 despite a 14 bp fall in the 2-year gilt, and the franc gave up a little at 0.8181.
Commodities (all front-month futures):
| Commodity | Price | Day Chg % | Ticker | Source |
|---|---|---|---|---|
| Brent Crude | $105.83 | -2.69% | BZ=F | yfinance |
| WTI Crude | $102.43 | -3.21% | CL=F | yfinance |
| Gold ($/oz) | $4,387.50 | +1.26% | GC=F | yfinance |
| Silver ($/oz) | $64.92 | +1.66% | SI=F | yfinance |
| Copper ($/lb) | $6.509 | +1.02% | HG=F | yfinance |
| Nat Gas ($/MMBtu) | $2.891 | -0.96% | NG=F | yfinance |
Day changes are settlement (16 September) vs the prior session's settlement (15 September); every row is on the same settlement-to-settlement basis. The front-month contracts did not roll during the session, so no roll affects the comparison. Copper, silver and gold settle between 13:00 and 13:30 ET, before the FOMC statement; the energy contracts settle at 14:30 ET, half an hour after it and as the press conference began.
Oil is the day's mover, and it is a reversal of Tuesday's: WTI's October contract (CLV26) settled at $102.43, $3.40 under Tuesday's $105.83 settlement, and Brent's November contract (BZX26) at $105.83, $2.92 under $108.75, after the US Energy Secretary put the East-West pipeline outage at days rather than the five-to-six weeks that had been reported, and Saudi Arabia said it was moving more crude out through Hormuz with US naval assistance along Oman's coast. Brent settled 37 cents above its midday quote and WTI 4 cents below, so the fall was a little smaller for Brent (−2.69%) and a little larger for WTI (−3.21%) than the morning's quotes, and the Brent-WTI spread widened to $3.40. Independent analysts reading the satellite images of the damaged pumping station still say weeks, and the physical market, with Dated Brent reported above $130 on Tuesday, has not confirmed the futures' optimism. The physical premium is the gap between the price of a real cargo loading in the next few days and the futures contract for the same grade: Dated Brent (North Sea cargoes with a fixed loading date) and the Dubai and Oman benchmarks for Middle East barrels are what refiners pay now, at $128 to $130, while the October and November futures at $102 to $106 are for delivery weeks or months out and are mostly held as financial positions. Normally the two trade within a dollar or two of each other because arbitrage keeps them together; a gap of $25 or more means the shortage is now, with refiners bidding for whatever cargoes exist while the futures price in the pipeline being back before the contracts expire. That is why the premium is the market's verdict on days versus weeks: if buyers believed the outage would end next week they would stop paying $25 extra for prompt delivery and the physical price would fall back towards the futures. Today the futures fell about 3% and Dated Brent did not, so the premium widened; the futures took the reassurance, the people buying oil did not. WTI is 14.3% below its 52-week high of $119.48 and 86% above its 52-week low of $54.98; Brent is 16.1% below its 52-week high of $126.10. (Both contracts' all-time highs date from July 2008 and are not a useful reference.) The WTI October contract expires on 22 September, six days away; the CL=F generic will roll to November around then and the quoted level will jump by the spread between the two contracts with no market move behind it, so a discontinuity in next week's table is expected. Brent's November contract expires on 1 October. Gold settled at $4,387.50, up 1.26% on the lower dollar and the morning's dip in real-rate quotes, 21.5% below its all-time high of $5,586.20 set on 29 January 2026 and 19.9% above its 52-week low of $3,660.50; silver at $64.92 (+1.66%) is 46.5% below its record of $121.30, also set on 29 January, and 56% above its 52-week low. Both settle before 13:30 ET, so neither price knows the Fed's decision or the 6 bp rise in the real 10-year that followed it. Copper at $6.509 is 4.4% below its all-time high of $6.8055 set on 9 September, slightly below the record with the White House copper-tariff decision still pending. Natural gas at $2.891 (−0.96%) is 63% below its 52-week high of $7.827, 16% above its 52-week low; its record is from 2005 and is not cited.
Crypto: Bitcoin at about $75,950 (Fortune, 07:00 ET) is flat on Tuesday's $75,613 close, holding the level it fell to after the CLARITY Act's cloture vote failed 49 to 50; no move above the 3% threshold to report.
Sector & Theme Highlights
- Semiconductors and memory (best): the Reuters report that SK Hynix is in talks to make memory chips at Intel's Ohio site, either by leasing part of the fab or through a joint venture with Intel and the cloud companies, lifted Intel 5%, SK Hynix 2% in Seoul (the Kospi's 1.37% gain is largely that), and AMD and Nvidia with them. SK Hynix said nothing had been finalised. The theme is supply-chain geography: a Korean memory maker producing in the US would be the first, and it is Intel's foundry story back in play after the Ohio delays.
- Banks (Europe, best): the sector led the STOXX 600's rebound after two days of losses, on lower bond yields and a calmer oil price; UBS, the index's worst stock on Tuesday at −3.4%, was part of the SMI's 0.43% recovery.
- Energy (worst): oil down about 3% at the settlement (WTI −3.21%, Brent −2.69%) reverses the sector's Tuesday leadership (+1.3%); the physical premium says the trade is not over, but the futures market took the Energy Secretary's "days" at face value.
- Rates-sensitive and consumer (worst at the close): the Dow's −1.21% against the Nasdaq 100's +0.02% is the two-speed market of the week, made wider by the Fed: the banks and consumer names that led it down on Monday and Tuesday fell again once the dot plot showed more hikes, and the chipmakers' morning rally was the only thing that held. Retail sales at +1.2% did not help the retailers as much as it helped the Fed's hawks.
- Precious metals: gold +1.26% and silver +1.66% at settlements struck before the decision, on a weaker dollar and the morning's lower real-rate quotes; both remain far below their January records.
- Cross-market theme, the two central banks: the Fed's hike to 3.75% to 4.00% and Copom's cut to 13.75% landed within four hours of each other, the BOE holds tomorrow and the BOJ is expected to hike on Friday: four decisions in three days, three of them in the tightening direction, and only Brazil, from 14.00%, easing.
Top Stories (Global)
- FOMC raises rates 25 bp to 3.75% to 4.00%, a unanimous 12 to 0 vote and the first change to a target range that had stood at 3.50% to 3.75% in every archive of this briefing since 20 April; the statement says inflation "remains elevated", and the dot plot has 16 of 18 participants expecting at least one more hike this year, four of them two, with no further increases beyond 2026 and one cut each in 2028 and 2029 (CNBC, Seeking Alpha). Chair Kevin Warsh's press conference was read as hawkish on inflation, and stocks that had been higher all day turned during it: the S&P 500 closed −0.45% at 7,551.81, the Dow −1.21%, the Nasdaq 100 flat, the 2-year Treasury rose 7 bp to 4.74% and the 10-year settled at 5.01%, its highest since 2007 (CNBC, Fortune).
- US retail sales +1.2% in August against +0.8% expected, control group +1.4% against +0.4%, the strongest month since March after a revised −0.5% in July; total sales $773.9 bn, +6.0% on the year. The consumer the Michigan survey said was flagging spent more.
- Oil falls 3% after the US Energy Secretary calls the East-West pipeline outage "a brief and temporary interruption" measured in days; WTI settled at $102.43 (−3.21%), Brent at $105.83 (−2.69%). Analysts citing satellite imagery of the pumping station say weeks; Saudi Arabia is routing more crude through Hormuz with US assistance along the Omani coast. September's rise is still more than 16%.
- UK CPI 3.1% in August, in line, up from 2.9% and the highest since March, motor fuel +23% on the year; gilts rallied across the curve (2-year −14 bp to 4.63%, 10-year −8 bp to 5.30%, 30-year −6 bp to 5.87%) as the market pared hike bets ahead of tomorrow's Bank of England decision, where a hold at 3.75% is priced above 80%; CPI is expected to reach 4% by early 2027.
- Intel and SK Hynix in talks on US memory production (Reuters): a lease of part of Intel's Ohio campus or a joint venture with cloud firms; Intel +5%, SK Hynix +2%, the Kospi +1.37% ending a four-session fall.
- Europe rebounds: the STOXX 600 +0.46% to 637.09, its first gain since 11 September, banks leading; the Bund 10-year −2 bp to 3.51% after touching its highest since June 2009 this week, the OAT 4.48% (spread 97 bp), the BTP 4.38%. The euro AAA 2-year gave back 4 bp of Monday's 10 bp rise.
- Brazil's Copom cuts the Selic 25 bp to 13.75% from 14.00%, unanimous, after 18:30 in Brasília and three and a half hours after the Fed's hike; the statement cites slowing activity in cyclical sectors against a tight labour market and inflation still above target, with Focus survey expectations at 4.9% for 2026 and 4.3% for 2027, and leaves the next step open. Easing since March totals 125 bp, and the bank's own survey of economists has the rate ending the year at 13.75% (Bloomberg, Investing.com, InfoMoney). The Bovespa closed down 0.51% before the decision.
- Japan: the 10-year JGB back to 3.00% (−4 bp) and USD/JPY at 153.43 (−0.59%) two days before the BOJ, where a hike to 1.25% is expected, the second this year after June's move to 1.00%.
Looking Ahead
Central banks - Wednesday 16 September: FOMC, delivered: a 25 bp hike to 3.75% to 4.00%, unanimous, with a dot plot showing at least one more increase this year for 16 of 18 participants. The question it leaves for the next meeting is whether the second hike is the last, and the 2-year at 4.74% says the market is not sure it is. - Wednesday 16 September: Brazil Copom, delivered: a 25 bp cut to 13.75%, unanimous, the last decision before the presidential election, with the next step left open and the surveyed consensus seeing no further cut this year. - Thursday 17 September: Bank of England, 12:00 BST, Bank Rate 3.75%, a hold priced above 80% after today's in-line CPI; the vote split and the guidance on November are what the gilt market trades after today's 14 bp rally at 2 years. - Thursday 17 to Friday 18 September: BOJ, statement Friday after the Asian open, press conference 06:30 GMT. A hike from 1.00% to 1.25% is expected, the highest since 1995; the JGB 10-year at 3.00% and USD/JPY at 153.43 frame it. Tokyo is closed the following Monday. - ECB: no meeting until October; the AAA 2-year at 3.19% still prices a third hike after June and September.
Economic releases - Thursday 17 September: euro area final HICP for August (flash 3.3%, prior 2.9%); US initial jobless claims, housing starts and the Philadelphia Fed survey, with Monday's Empire State miss (7.6 against 14.1) setting the bar; the BOE. - Friday 18 September: UK retail sales for August; the BOJ.
Earnings - No major reports scheduled. The AI hardware story is being traded on supply-chain news (Intel and SK Hynix today) rather than on results until the October reporting season.
Geopolitical - The Saudi East-West pipeline: the US administration says days, the analysts say weeks, and the physical crude premium over futures is the market's measure. Saudi exports through Hormuz with US naval escort along the Omani coast are the interim route. The Salalah meeting between Iran and the Gulf states remains postponed with no new date. - The White House copper-tariff decision is unresolved; copper is 4.4% below its 9 September record. - The CLARITY Act's failed cloture vote leaves crypto market-structure legislation without a path this year; Bitcoin is holding near $76,000. - WTI's October contract expires on 22 September, six days away; the generic will roll to November and the quoted level will jump by the calendar spread.
Market closures - No closures in the next five trading days (17 to 23 September) across the US, UK, Germany, France, Australia, Switzerland, Canada, Korea or Brazil, with two exceptions: Japan is closed Monday 21 September (Respect for the Aged Day), the first session after the BOJ decision, and again Wednesday 23 September (Autumnal Equinox Day). - Further out: Korea 24, 25 and 26 September (Chuseok); Canada 30 September (National Day for Truth and Reconciliation). - No Indian holiday data is available here, so Indian closures are not checked.