2026 07 01
Global Financial Briefing — Wednesday, 1 July 2026
Retrospective briefing — data as of 1 July 2026. Valuation table omitted (trailing P/E not available for past dates).
Market Overview
Global markets opened the third quarter on a mixed note after a historic first half. US equities gave back a modest slice of their Q2 gains: the S&P 500 slipped 0.22% to 7,483.23 and the Nasdaq 100 fell 1.54% to 29,809.13 as a two-day relief rally in technology names unwound, with chipmakers Micron and Intel posting double-digit percentage losses. The Dow Jones was comparatively resilient, down just 0.03% to 52,305.24. All three benchmarks nonetheless closed out an extraordinary second quarter — the S&P 500 gained roughly 14.9% and the Nasdaq 21.4% in Q2, their best quarters since Q2 2020, while the Dow's 12.9% quarterly gain was its best since Q4 2022. The Russell 2000 hit a fresh all-time high and finished H1 2026 up more than 21%, its strongest first half since 1991 — a signal that the rally has broadened well beyond mega-cap tech.
Asia-Pacific was the session's clear underperformer. The Nikkei 225 dropped 2.47% to 68,733.15 and the Shanghai Composite fell 2.03% to 4,028.90, both giving back ground after a powerful 12-month advance. South Korea's Kospi shows an outsized decline in the data feed (see index table footnote — yfinance data quality flag). Hong Kong's Hang Seng was the regional exception, adding 0.76%. Europe was comparatively calm and broadly positive: the Euro STOXX 600, CAC 40, DAX, FTSE 100 and Swiss Market Index all closed higher, led by the SMI's 0.83% gain, as German Bund yields ticked up to 2.94% and the euro-area growth backdrop stayed steady.
The CBOE VIX closed at 16.45 (FRED VIXCLS, 2026-06-30) — in the "moderate" 15–20 band, not signalling the kind of complacency (<15) or elevated stress (>20) that would color the risk-on/risk-off read one way or the other; it's broadly consistent with a market digesting a pullback from record highs rather than panicking.
In fixed income, the US Treasury curve remains modestly upward-sloping (10Y–2Y spread +31 bps, 10Y–3M spread +63 bps) — no inversion signal, though the curve has flattened somewhat from a month earlier. The Bank of Japan's mid-June rate hike to 1.00% (the highest since 1995) continues to reverberate through JGB yields, which have climbed toward 2.65–2.70% on the 10-year. US CPI inflation remains elevated at 4.17% y/y (May 2026), well above the Fed's 2% target, even as the Fed Funds range holds at 3.50–3.75%. Credit markets show no signs of stress: US high-yield spreads at 275 bps and investment-grade at 76 bps both sit below their historical-average ranges, indicating a still-complacent — not distressed — credit backdrop.
Global Indices Snapshot
Americas
| Index | Level | Day Chg | Day Chg % | Source |
|---|---|---|---|---|
| S&P 500 | 7,483.23 | -16.13 | -0.22% | yfinance ^GSPC |
| Nasdaq 100 | 29,809.13 | -467.22 | -1.54% | yfinance ^NDX |
| Dow Jones | 52,305.24 | -13.96 | -0.03% | yfinance ^DJI |
| Brazil IBOV | 171,689.0 | -335.0 | -0.19% | yfinance ^BVSP |
Cross-checked against FRED SP500 (2026-07-01): 7,483.23 — exact match.
Europe
| Index | Level | Day Chg | Day Chg % | Source |
|---|---|---|---|---|
| Euro STOXX 600 | 641.48 | +2.17 | +0.34% | yfinance ^STOXX |
| Euro STOXX 50 | 6,286.96 | +4.46 | +0.07% | yfinance ^STOXX50E |
| CAC 40 | 8,384.29 | +47.00 | +0.56% | yfinance ^FCHI |
| DAX | 25,102.40 | +62.12 | +0.25% | yfinance ^GDAXI |
| FTSE 100 | 10,526.83 | +48.53 | +0.46% | yfinance ^FTSE |
| SMI (Swiss) | 14,230.53 | +116.53 | +0.83% | yfinance ^SSMI |
All levels reflect the 1 July 2026 close.
Asia-Pacific
| Index | Level ‡ | Day Chg | Day Chg % | Source |
|---|---|---|---|---|
| Nikkei 225 | 68,733.15 | -1,741.81 | -2.47% | yfinance ^N225 |
| Hang Seng | 23,055.03 | +174.01 | +0.76% | yfinance ^HSI |
| Shanghai Comp | 4,028.90 | -83.54 | -2.03% | yfinance 000001.SS |
| ASX 200 | 8,724.5 | +1.6 | +0.02% | yfinance ^AXJO |
| Kospi (Korea) | 7,648.09 ‡ | — | — | yfinance ^KS11 |
‡ Kospi: yfinance's 30 June observation for ^KS11 is a zero-volume, flat OHLC placeholder (data quality issue, not a real trading session), so the day-over-day change cannot be reliably computed. The 1 July level (7,648.09) is shown for reference only — do not infer an implied ~-8% to -10% single-day move from it.
Emerging Markets
| Index | Level | Day Chg % | Source |
|---|---|---|---|
| MSCI EM (EEM) | $66.48 | -2.82% | yfinance EEM |
| India Nifty 50 | 24,133.5 | +0.53% | yfinance ^NSEI |
| South Africa | (not retrieved) | — | yfinance ^J203 — no data returned |
Index Valuations & Investment Risk
Valuation table and P/E-based Equity Risk Premium analysis are omitted: live trailing P/E is available only for the current date, not for a past one. For qualitative context: the Q2 2026 rally described above (S&P 500 +14.9%, Nasdaq +21.4% for the quarter) suggests valuations were likely elevated relative to historical averages heading into 1 July, but a precise premium/discount figure cannot be stated without live trailing-earnings data.
Disclaimer: This is financial information, not personalised investment advice. Past valuations do not guarantee future returns. Consult a financial advisor before investing.
US Economic Indicators (FRED — authoritative)
| Indicator | Current | Reference Date | FRED Series |
|---|---|---|---|
| CPI YoY % | 4.17% | May 2026 | CPIAUCSL |
| Core CPI YoY % | 2.82% | May 2026 | CPILFESL |
| Unemployment Rate | 4.3% | May 2026 | UNRATE |
| Nonfarm Payrolls | 159,001k (+172k m/m) | May 2026 | PAYEMS |
| 10Y TIPS Real Yield | 2.20% | 2026-06-30 | DFII10 |
Headline CPI at 4.17% y/y remains more than double the Fed's 2% target, even as the effective Fed Funds rate sits at 3.63% — implying a still-modest real policy rate relative to headline inflation, though the 10Y TIPS real yield of 2.20% (FRED DFII10, 2026-06-30) shows the market pricing meaningfully positive real returns further out the curve. Core CPI at 2.82% is closer to target but still elevated. The labour market continues to add jobs at a moderate pace (+172k in May).
Fixed Income & Bond Analysis
Policy Rates
| Central Bank | Rate | Source |
|---|---|---|
| Fed Funds (upper) | 3.75% | FRED DFEDTARU |
| Fed Funds (lower) | 3.50% | FRED DFEDTARL |
| Effective FFR | 3.63% | FRED DFF |
| ECB Deposit Rate | 2.25% | FRED ECBDFR |
| BOJ Policy Rate | 1.00% | web search — hiked from 0.75% to 1.00% on 2026-06-16, highest since 1995 |
| BOE Bank Rate | 3.73% | FRED IUDSOIA (SONIA proxy), 2026-06-29 |
Government Bond Yields
| Country | 2Y Yield | 10Y Yield | 30Y Yield | Source |
|---|---|---|---|---|
| USA | 4.14% | 4.44% | 4.91% | FRED (2026-06-30) |
| Germany | 2.48% † | 2.94% | 3.43% † | web (10Y) / ECB YC API † (2Y, 30Y, 2026-06-30) |
| France | — | 3.57% | — | web search (2026-06-24) |
| UK | 4.18% | 4.71% | — | web search (2Y: 2026-06-18, 10Y: 2026-07-01) |
| Japan | — | 2.67% | — | web search (~2026-06-30/07-01) |
| Italy | — | (not found) | — | web search — not retrieved |
† Germany 2Y/30Y sourced from the ECB AAA-rated euro area curve (nearest available date, 2026-06-30) as a Bund proxy, since a direct Bund quote wasn't retrieved for those maturities.
Yield Curve Spreads (FRED pre-computed, 2026-07-01): - 10Y–2Y spread: +31 bps — positive/normal, not inverted; modestly flatter than a month earlier (curve levels broadly declined ~15-20bps across the front end month-over-month). - 10Y–3M spread: +63 bps — positive, consistent with no imminent recession signal by this classic indicator.
Both spreads point to a "normal," non-inverted curve. Neither is flagging elevated near-term recession risk, though the modest month-over-month flattening bears watching alongside the still-elevated CPI print.
OAT–Bund Spread: France 10Y (3.57%, 24 June) minus Germany 10Y (2.94%, 1 July) ≈ 63 bps. Dates aren't perfectly aligned (best available web data for each), so treat this as approximate — French fiscal risk premium remains a moderate but persistent feature of the euro-area curve.
Yield Curve Charts
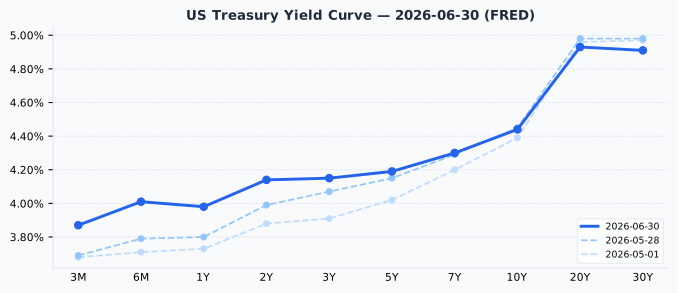
The US curve is upward-sloping across its full length, from ~3.87% at 3 months to ~4.91% at 30 years, with a modest belly-to-long-end lift from 2Y (4.14%) through 30Y — a normal shape, no inversion at any point on the curve. Versus one month ago (28 May) and two months ago (1 May), the entire curve has shifted materially higher — front-end yields (3M) rose from 3.68% (May) to 3.87% (July), a ~19bps increase, while 10Y rose from 4.39% to 4.44%, suggesting the market re-priced modestly higher rate expectations over the two-month window even as the Fed held its target range steady.
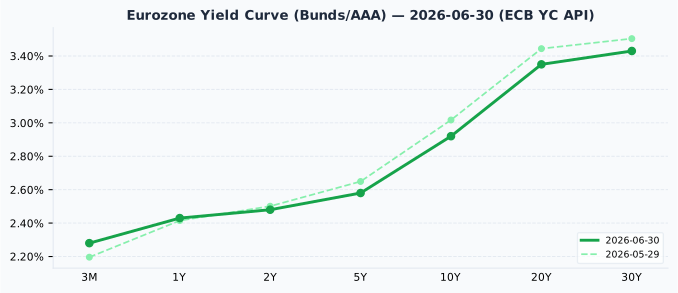
The euro-area AAA curve is also upward-sloping, from 2.28% at 3 months to 3.43% at 30 years. Compared with the prior reading (29 May), most maturities have actually eased slightly (10Y fell from 3.02% to 2.92%; 20Y from 3.44% to 3.35%), a modest bull-flattening versus the US curve's bear-steepening over the same window — a notable transatlantic divergence in rate expectations.
Credit Markets (from FRED — authoritative)
| Market | OAS Spread | Series ID |
|---|---|---|
| US Investment Grade | 76 bps | BAMLC0A0CM |
| US High Yield | 275 bps | BAMLH0A0HYM2 |
| Euro High Yield | 270 bps | BAMLHE00EHYIOAS |
US high-yield spreads at 275 bps sit below the typical 300–500 bps "normal" range — historically tight, signalling continued investor complacency/risk appetite rather than any stress. Investment-grade spreads at 76 bps are similarly tight versus the 80–150 bps normal band. Euro high-yield spreads (270 bps) tell the same story on the European side. None of these levels indicate credit-market stress as of 1 July.
Bond Portfolio Implications
A full Equity Risk Premium calculation requires live trailing P/E data, which is unavailable in this retrospective mode (see Valuations section above). Qualitatively: with the 10Y Treasury yielding 4.44% and 10Y TIPS real yields at 2.20%, bonds continued to offer a meaningfully positive real return as of 1 July — a genuine competing asset class to equities, particularly after Q2's outsized equity rally likely compressed forward equity return expectations. Duration risk remains material: a 100 bps rise in yields would still imply roughly an 8–9% price loss on a 10-year bond at these levels.
Currencies & Commodities
Currencies:
| Pair | Rate | Source |
|---|---|---|
| EUR/USD | 1.1403 | FRED DEXUSEU (2026-06-26 — most recent available) |
| USD Index | 120.89 | FRED DTWEXBGS (2026-06-26) |
| USD/JPY | 162.69 | web search (2026-07-01) |
| GBP/USD | ~1.32 | web search (nearest available, 2026-06-28) |
| USD/CHF | 0.8087 | web search (nearest available, 2026-07-02) |
FRED's EUR/USD and Broad USD Index series both lag to 2026-06-26 in this pull; treat as the most recent confirmed reading rather than the exact 1 July print. GBP/USD and USD/CHF are likewise the nearest dates found via web search, not exact 1 July closes — flagged per the master data rule rather than estimated.
Commodities (yfinance front-month futures):
| Commodity | Price | Day Chg % | Ticker | Source |
|---|---|---|---|---|
| Brent Crude | $71.57 | -1.85% | BZ=F | yfinance |
| WTI Crude | $68.58 | -1.32% | CL=F | yfinance |
| Gold ($/oz) | $4,068.30 | +1.13% | GC=F | yfinance |
| Silver ($/oz) | $60.09 | +1.02% | SI=F | yfinance |
| Copper ($/lb) | $6.12 | -1.11% | HG=F | yfinance |
| Nat Gas ($/MMBtu) | $3.22 | -1.68% | NG=F | yfinance |
Gold at $4,068/oz and silver at $60/oz both notched gains on the day, consistent with the broader multi-year precious-metals rally reflected across this dataset. Energy was softer across the board — both WTI and Brent fell over 1%, with the WTI-Brent spread (~$3/bbl) sitting at a normal level. Historical ATH context for gold/silver is unavailable in retrospective mode (the ath field is only populated via live get_stock_info, not the historical-prices endpoint used here), so no ATH-distance language is used per the master data rule.
Top Stories (Global)
- US equities pull back from Q2 highs: S&P 500 (-0.22%) and Nasdaq (-1.54% on ^NDX / -0.66% on the broader Nasdaq Composite) slid as a two-day tech relief rally unwound; the Dow (-0.03%) held up best, closing at 52,305.24.
- Record-breaking Q2 2026: the S&P 500 (+14.9%) and Nasdaq (+21.4%) posted their best quarters since Q2 2020; the Dow's +12.9% was its best since Q4 2022.
- Russell 2000 hits an all-time high, up more than 21% in H1 2026 — the best first half for US small caps since 1991, signalling broadening market participation beyond mega-cap tech.
- Meta shares jumped more than 10% after Bloomberg reported the company is building out a new cloud business.
- Chip sector volatility: Micron and Intel posted double-digit percentage losses, dragging the Nasdaq Composite down 0.7% on the session.
- Bending Spoons IPO pops 42% on its US trading debut — the Italian software company (owner of AOL, Vimeo, and other legacy internet brands) saw a strong reception from investors.
- BOJ's June hike continues to ripple through markets: the Bank of Japan's rate increase to 1.00% (from 0.75%, the highest level since 1995) has pushed JGB 10-year yields up toward 2.65-2.70%, with board members signalling further hikes may be warranted if the economic outlook holds.
Looking Ahead
- Market closures (next 5 calendar dates, from holiday calendar):
- 2026-07-03 (Fri): US — Independence Day (observed)
- 2026-07-14 (Tue): France — Bastille Day
- 2026-07-17 (Fri): South Korea — Constitution Day
- 2026-07-20 (Mon): Japan — Marine Day
- 2026-08-01 (Sat): Switzerland — Swiss National Day
- Canada Day (1 July): Canadian markets were closed on the briefing date itself; no Canadian index is tracked in this briefing's universe, so no table impact.
- BOJ policy watch: after the mid-June hike to 1.00%, board commentary points to a gradual path toward a ~2% neutral rate — further hikes are plausible if inflation and growth stay on track, a key risk factor for JGB yields and JPY crosses.
- US Q3 earnings season will begin ramping up in the coming weeks following an exceptionally strong Q2 for US equities; watch for whether corporate guidance can justify the scale of the H1 2026 rally.