2026 07 24
Global Financial Briefing — Friday, July 24, 2026
Market Overview
Markets are turning the page on a rough Thursday. Wall Street closed sharply lower on July 23 — the Dow fell 506.93 points (-1.0%) to 51,711.65, the Nasdaq Composite dropped 553.21 points (-2.2%) to 25,137.69, and the S&P 500 slid 90.66 points (-1.2%) to 7,408.30 — as surging oil prices, escalating Middle East tensions, and renewed anxiety over AI capital spending outweighed a strong quarter from Alphabet (EPS $9.11 and revenue $103.62B, both above estimates, overshadowed by 2026 capex guidance raised to $195–205B from $180–190B). Today (Friday) the tone has partially reversed: reports that Pakistan is exploring a path to revive US–Iran talks have pushed Brent crude down toward $96/bbl and pulled Treasury yields off their highs for the year, supporting a bid in blue-chip US names and a broad rally across Europe.
The regional picture is split. US indices are little changed to modestly higher intraday (Dow and S&P 500 both up around +0.4–0.5%, Nasdaq 100 lagging at -0.5% as mega-cap tech digests the AI-spending debate). Europe is firmly risk-on, with the STOXX 600, CAC 40, DAX, FTSE 100 and SMI all up between +0.8% and +1.4% on today's close, helped by the same oil pullback. Asia-Pacific, by contrast, is nursing yesterday's session: the Nikkei 225 fell -2.7%, and — most notably — South Korea's Kospi plunged -5.7%, a sharp single-day move that stands out even against a broadly weak regional tape (Hang Seng -1.0%, Shanghai -1.6%, ASX 200 -0.8%, Nifty 50 -0.4%).
Underneath the daily noise, two structural threads dominate: (1) a global government-bond repricing — German Bund 10Y yields have pushed to their highest since 2011 (3.20%) and UK 10Y Gilts have held above 5% for the longest stretch since 2008, both making bonds more competitive with historically expensive equities; and (2) a fresh round of central-bank divergence, with the Bank of Japan having hiked to 1.00% in June (its highest since 1995) even as the Fed holds its target range at 3.50–3.75%.
Global Indices Snapshot
Americas
US and Brazilian markets are open; levels below are intraday (not final close).
| Index | Level | Day Chg | Day Chg % | Source |
|---|---|---|---|---|
| S&P 500 | 7,434.41 | +26.11 | +0.35% | yfinance ^GSPC |
| Nasdaq 100 | 28,315.27 | -139.54 | -0.49% | yfinance ^NDX |
| Dow Jones | 51,969.23 | +257.58 | +0.50% | yfinance ^DJI |
| Brazil IBOV | 174,408.95 | -2,314.67 | -1.31% | yfinance ^BVSP |
Americas data is an intraday quote from the open session on 24 Jul, not the closing print.
Europe
All markets open — today's close.
| Index | Level | Day Chg | Day Chg % | Source |
|---|---|---|---|---|
| Euro STOXX 600 | 644.51 | +5.24 | +0.82% | yfinance ^STOXX |
| CAC 40 | 8,372.28 | +73.19 | +0.88% | yfinance ^FCHI |
| DAX | 25,099.00 | +335.88 | +1.36% | yfinance ^GDAXI |
| FTSE 100 | 10,736.23 | +97.06 | +0.91% | yfinance ^FTSE |
| SMI (Swiss) | 14,327.20 | +112.25 | +0.79% | yfinance ^SSMI |
European data reflects today's close (24 Jul).
Asia-Pacific
All markets open — today's close.
| Index | Level | Day Chg | Day Chg % | Source |
|---|---|---|---|---|
| Nikkei 225 | 64,611.15 | -1,811.45 | -2.73% | yfinance ^N225 |
| Hang Seng | 24,963.23 | -247.58 | -0.98% | yfinance ^HSI |
| Shanghai Comp | 3,814.20 | -62.58 | -1.61% | yfinance 000001.SS |
| ASX 200 | 8,772.30 | -66.70 | -0.75% | yfinance ^AXJO |
| Kospi (Korea) | 6,690.62 | -406.27 | -5.72% | yfinance ^KS11 |
Asia-Pacific data reflects today's close (24 Jul). The Kospi's -5.7% drop is a notably sharp single-day move relative to the rest of the region and is worth independent verification against local news before drawing conclusions.
Emerging Markets
| Index | Level | Day Chg % | Source |
|---|---|---|---|
| MSCI EM (EEM) | 63.73 | -1.35% | yfinance EEM |
| India Nifty 50 | 23,767.45 | -0.43% | yfinance ^NSEI |
| South Africa (EZA) | 61.32 | +1.47% | yfinance EZA |
Index Valuations & Investment Risk
Valuation Table
| Index | Trailing P/E (live) | Hist avg trailing P/E (†) | Premium/discount to hist avg |
|---|---|---|---|
| S&P 500 | 26.65x | ~16-18x | +56.8% |
| Nasdaq 100 | 30.56x | ~25-30x | +11.1% |
| Euro STOXX 600 | 18.63x | ~15-17x | +16.4% |
| CAC 40 | 17.60x | ~14-16x | +17.3% |
| DAX | 18.35x | ~15-17x | +14.7% |
| FTSE 100 | 17.94x | ~13-15x | +28.1% |
| Nikkei 225 | 20.98x | ~20-22x | -0.1% |
| MSCI EM | 16.42x | ~13-15x | +17.3% |
(†) Hist avg trailing P/E: static long-run reference constants.
Trailing P/E (live): sourced from yfinance trailingPE on ETF proxies (SPY, QQQ, EXSA.DE, CAC.PA,
EXS1.DE, ISF.L, 1321.T, EEM). Premium/discount computed vs the midpoint of each historical range.
S&P 500 and FTSE 100 are both flagged (bold) at more than 20% above their historical averages.
Investment Risk Assessment for ETF Investors
United States (S&P 500 / Nasdaq ETFs) SPY's trailing P/E of 26.65x sits nearly 57% above its ~16-18x long-run average — historically stretched territory. Earnings yield is (1÷26.65) = 3.75%, versus the 10Y Treasury at 4.67% (FRED DGS10, 2026-07-22): the Equity Risk Premium is -0.92%, meaning Treasuries currently out-yield S&P 500 earnings — a negative ERP, historically a caution signal for forward equity returns. QQQ's P/E of 30.56x is only 11% above its (wider) 25-30x historical band, but its ERP is even more negative at -1.40% (1÷30.56 = 3.27% vs 4.67%), reflecting persistent AI-driven growth premium pricing, concentration risk in a handful of mega-caps, and rate sensitivity. The S&P 500 is trading about 2.4% below its all-time high of 7,620.90 — elevated but not at a record. Cross-checking against FRED's 10Y TIPS real yield (DFII10) of 2.39% confirms real rates remain well above the post-2008 norm, a structural headwind for further multiple expansion.
Europe (STOXX 600 / CAC 40 / DAX ETFs) EXSA.DE's trailing P/E of 18.63x is about 16% above its ~15-17x historical range — rich, but far less stretched than the US. Earnings yield (1÷18.63) = 5.37% versus the German 10Y Bund at 3.20% (web search, 2026-07-23, its highest level since 2011) gives a Euro ERP of +2.17% — comfortably positive and well above the 1% caution threshold, making European equities look more attractively priced relative to bonds than their US counterparts. DAX (EXS1.DE, 18.35x) and CAC 40 (CAC.PA, 17.60x) show similar dynamics, with DAX ERP at roughly +2.25% against the Bund and CAC 40 ERP at roughly +1.76% against France's own 10Y OAT (3.92%, though that print is from 2026-07-08 and may be stale given the Bund's subsequent rise). FTSE 100 stands out: ISF.L's 17.94x P/E is 28% above its historical 13-15x range — the richest relative valuation in this table — even though UK Gilts now yield over 5% (10Y, highest sustained level since 2008), which argues for caution on UK equities despite the index's traditional "value" reputation. Non-EUR/GBP investors should weigh currency risk (GBP/USD ~1.34, USD/CHF ~0.82) alongside French and Italian fiscal/political risk, where OAT and BTP 10Y yields had converged near 3.90-3.92% in early July — a live, current OAT-Bund spread figure was not retrievable today (ECB API was down; see note below), so this convergence should be treated as dated context rather than a current reading.
Japan (Nikkei / TOPIX ETFs) The Nikkei fell -2.7% today to 64,611, a sharp move that leaves the index about 11% below its all-time high of 72,831.73. 1321.T's trailing P/E of 20.98x is essentially in line with its 20-22x historical range (-0.1%), so valuation itself isn't the story. The bigger risk is monetary: the BOJ hiked its policy rate to 1.00% on 2026-06-16 — the highest since 1995 — after holding at 0.75% through Q1/Q2, driven by yen weakness and inflation pressure partly linked to the Iran conflict. Further hikes are reportedly still in view. This raises both currency-hedge costs for foreign holders and financing costs domestically; combined with a still-elevated real global rate backdrop, it's a genuine headwind despite fair-ish valuation.
Emerging Markets (MSCI EM ETFs) EEM's trailing P/E of 16.42x is about 17% above its ~13-15x historical range, though it remains at a meaningful absolute discount to developed-market multiples (S&P 500 at 26.65x, STOXX 600 at 18.63x). Today's regional action is a reminder of EM idiosyncratic risk: Korea's Kospi fell -5.7%, Hang Seng -1.0%, and Shanghai -1.6%, while India's Nifty was comparatively resilient at -0.4% and South Africa's ETF proxy (EZA) rose +1.5%. China weight and single-market volatility (as seen in Korea today) remain the dominant risk factors for EM allocators.
Overall Risk Score (qualitative, not financial advice): - US large-cap / Nasdaq: High valuation risk / low margin of safety — negative ERP on both measures, valuations well above historical norms. - Europe (ex-UK): Moderate — richer than history but still comfortably ERP-positive versus local bonds; fiscal/political risk in France/Italy and a 15-year-high Bund yield are the swing factors. - UK: Moderate-to-elevated — historically cheap index now trading at its richest premium in this table, against a backdrop of Gilt yields above 5%. - Japan: Moderate — fair valuation, but a live BOJ hiking cycle adds currency and rate risk. - Emerging Markets: Moderate — valuation premium to own history, but still cheap vs. DM, with elevated single-country volatility.
Disclaimer: This is financial information, not personalised investment advice. Past valuations do not guarantee future returns. Consult a financial advisor before investing.
US Economic Indicators (FRED - authoritative)
| Indicator | Current | Prior | Delta | Reference Date | FRED Series |
|---|---|---|---|---|---|
| CPI YoY % | 3.46% | 4.17% | -0.71pp | 2026-06 | CPIAUCSL |
| Core CPI YoY % | 2.57% | 2.82% | -0.26pp | 2026-06 | CPILFESL |
| Unemployment Rate | 4.2% | 4.3% | -0.1pp | 2026-06 | UNRATE |
| Nonfarm Payrolls | 158,984K | 158,927K | +57K | 2026-06 (m/m chg) | PAYEMS |
| 10Y TIPS Real Yield | 2.39% | 2.37% | +0.02pp | 2026-07-22 | DFII10 |
Note: FRED macro data is monthly and typically lags 4-6 weeks; June 2026 is the most recent print for CPI, core CPI, unemployment and payrolls. Headline CPI YoY has eased noticeably from May's 4.17% to June's 3.46%, and core CPI similarly cooled from 2.82% to 2.57% — a disinflationary signal that, if sustained, could ease pressure on the Fed.
Other economic releases today (web search): US Initial Jobless Claims for the week ended 2026-07-18 came in at 187K, sharply below both the 212K consensus and the prior 209K reading — a notably resilient labor-market print that helped support the US dollar earlier this week. No same-day PMI/GDP/PPI releases were identified in today's search results.
Fixed Income & Bond Analysis
All US Treasury yields from FRED. European and Japanese/UK yields from web search (ECB API was unavailable today — see note below).
Policy Rates
| Central Bank | Rate | Source |
|---|---|---|
| Fed Funds (upper) | 3.75% | FRED DFEDTARU |
| Fed Funds (lower) | 3.50% | FRED DFEDTARL |
| Effective FFR | 3.63% | FRED DFF |
| ECB Deposit Rate | 2.25% | FRED ECBDFR |
| BOJ Policy Rate | 1.00% | web search (hiked 2026-06-16, highest since 1995) |
| BOE Bank Rate | ~3.73% | FRED IUDSOIA (SONIA proxy) |
Government Bond Yields
| Country | 2Y Yield | 10Y Yield | 30Y Yield | Day Chg (10Y) | Source |
|---|---|---|---|---|---|
| USA | 4.31% | 4.67% | 5.15% | +4bps | FRED |
| Germany | (not retrieved) | 3.20% | (not retrieved) | — | web (2026-07-23) |
| France | (not retrieved) | 3.92% ‡ | (not retrieved) | — | web (2026-07-08, stale) |
| UK | 4.35% ‡ | ~5.07% | (not retrieved) | — | web (2Y: 2026-07-13, stale; 10Y: this week) |
| Japan | (not retrieved) | 2.82% | (not retrieved) | +4bps | web (2026-07-24) |
| Italy | (not retrieved) | 3.90% ‡ | (not retrieved) | — | web (2026-07-08, stale) |
‡ France 10Y, Italy 10Y, and UK 2Y are the most recent figures found via web search but predate today; treat as directional context, not live quotes.
Yield Curve Spreads (FRED pre-computed): - 10Y-2Y spread: +34bps (FRED T10Y2Y, 2026-07-23) — positive and just outside the ±25bps "flat" threshold, but well short of a historically steep curve (>75bps). The curve has normalized out of inversion into modestly positive territory. - 10Y-3M spread: +76bps (FRED T10Y3M, 2026-07-23) — solidly positive; the classic recession predictor is not currently flashing a warning.
Both spreads read as consistent with a "soft landing" narrative rather than late-cycle stress, though the recent cooling in CPI (above) combined with a still-positive curve suggests the market is not pricing imminent recession risk.
OAT-Bund Spread: A live, current spread was not retrievable today. As of 2026-07-08, French OAT and Italian BTP 10Y yields had both converged to roughly 3.90-3.92%, with the BTP-Bund spread at 81bps — but German Bund yields have since risen roughly 20bps to a 15-year high (3.20% as of 2026-07-23), so any spread computed by combining these two stale/current data points would not be reliable. Flagging as (not retrieved) rather than estimating.
Yield Curve Chart
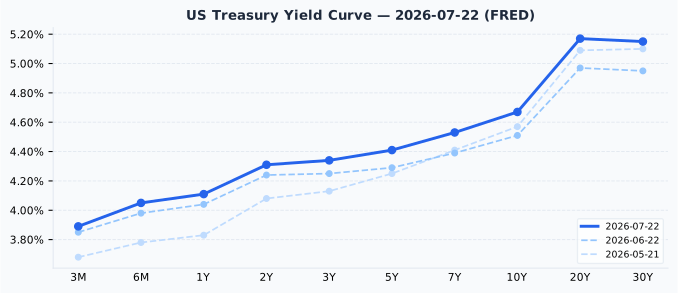
The US curve is upward-sloping across its full length with a modest hump around the 20Y point, consistent with a normal, non-inverted term structure. Versus one month ago (2026-06-22), the entire curve has shifted up by roughly 15-20bps at every maturity — short rates rose from 3.85% to 3.89% (3M) while the 10Y rose from 4.51% to 4.67% and the 30Y from 4.95% to 5.15%, indicating a broad-based repricing higher in Treasury yields over the past month rather than a change in curve shape.
Eurozone yield curve chart omitted today: the ECB Yield Curve API returned an HTTP 503 error at fetch time, and no fallback curve-wide dataset was available via web search (only the 10Y Bund point was retrievable). This will resume automatically once the API is available again.
Credit Markets (from FRED — authoritative)
| Market | OAS Spread | Series ID |
|---|---|---|
| US Investment Grade | 79bps | BAMLC0A0CM |
| US High Yield | 277bps | BAMLH0A0HYM2 |
| Euro High Yield | 250bps | BAMLHE00EHYIOAS |
All three spreads (2026-07-23) sit at or below the low end of their typical historical ranges (US IG: normal 80-150bps; US HY: normal 300-500bps) — both are historically tight, signaling credit-market complacency rather than stress, even after Thursday's equity sell-off. This is a useful cross-check: equity volatility ticked up (VIX to 18.7) but credit markets have not moved to price any deterioration in corporate fundamentals.
Bond Portfolio Implications
With the S&P 500 ERP at -0.92% and the Nasdaq 100 ERP at -1.40% (both negative — see valuation section), Treasuries currently offer a higher income return than US equity earnings yields, a historically rare and cautionary configuration for equity-heavy portfolios. By contrast, European equities (Euro STOXX 600 ERP +2.17% vs Bunds) still offer a meaningful equity risk premium. Given the 10Y Treasury at 4.67%, duration risk remains real: a 100bp rise in yields would imply roughly an 8-9% price loss on a 10-year bond. With yields having already risen ~15-20bps across the curve in the past month, further upside in long rates would compound both bond and equity valuation pressure; shorter-duration positioning continues to look more defensive than long-duration exposure in the current environment.
Currencies & Commodities
Currencies:
| Pair | Rate | Source |
|---|---|---|
| EUR/USD | 1.1440 | FRED DEXUSEU (2026-07-17) |
| USD Index | 120.53 | FRED DTWEXBGS (2026-07-17) |
| USD/JPY | 163.18 | web search (2026-07-21) |
| GBP/USD | 1.3377 | web search (2026-07-21) |
| USD/CHF | 0.8171 | web search (undated, most recent available) |
Commodities (all from yfinance front-month futures):
| Commodity | Price | Day Chg % | Ticker | Source |
|---|---|---|---|---|
| Brent Crude | $96.32 | -4.34% | BZ=F | yfinance |
| WTI Crude | $88.91 | -3.56% | CL=F | yfinance |
| Gold ($/oz) | $4,070.90 | +0.51% | GC=F | yfinance |
| Silver ($/oz) | $58.97 | +1.57% | SI=F | yfinance |
| Copper ($/lb) | $6.36 | +0.20% | HG=F | yfinance |
| Nat Gas ($/MMBtu) | $2.90 | -0.58% | NG=F | yfinance |
Both oil benchmarks are sharply lower today on reports of a possible path back to US-Iran negotiations — WTI is now 39.6% below its all-time high of $147.27, and Brent is 34.7% below its all-time high of $147.43. Gold, at $4,070.90/oz, is 27.1% below its all-time high of $5,586.20 — a meaningful pullback, not "near highs" language, despite the metal's strong multi-year run. Silver at $58.97/oz is 51.4% below its all-time high of $121.30. Copper, at $6.36/lb, is only 4.5% below its all-time high of $6.6525 — slightly below its record. Natural gas at $2.90/MMBtu remains far (81.6%) below its all-time high of $15.78, though that historical peak reflects an extreme spike rather than a typical trading range.
Sector & Theme Highlights
Communications and consumer discretionary stocks led Thursday's US decline, with Alphabet's post-earnings slide — despite beating on both EPS and revenue — the clearest illustration of the market's current unease about AI infrastructure spending outpacing near-term returns. Energy was whipsawed by the Iran conflict headlines: oil spiked on escalation fears earlier in the week, then fell sharply today on de-escalation reports. European cyclicals rallied broadly today alongside the oil pullback. In Asia, South Korea's tech-heavy Kospi suffered an outsized -5.7% drop that diverged sharply from the rest of the region, warranting a closer look at Korea-specific news before drawing broader conclusions. The dominant cross-market theme remains the tension between resilient hard economic data (US jobless claims sharply below consensus, cooling CPI) and rich valuations, with government bond yields (German Bund, UK Gilt) pushing to multi-year/multi-decade highs and starting to offer real competition to historically expensive equities.
Top Stories (Global)
- Alphabet beat on both EPS ($9.11) and revenue ($103.62B) but shares weighed on the broader market after the company raised 2026 capex guidance to $195-205B from $180-190B, intensifying investor concern about AI infrastructure spending.
- US equity indices fell sharply Thursday (Dow -1.0%, Nasdaq -2.2%, S&P 500 -1.2%) before a partial Friday rebound as reports suggested Pakistan is exploring a path to revive US-Iran negotiations.
- Brent crude fell to around $96/bbl and WTI to $88.91 on the de-escalation reports, pulling Treasury yields off their highs for the year.
- German 10-year Bund yields climbed to 3.20% (2026-07-23), the highest level since 2011, as markets price record government debt supply.
- UK 10-year Gilt yields have held above 5% for the longest stretch since 2008, pressured by uncertainty over the new UK Prime Minister's agenda alongside the broader oil-driven rate shock.
- The Bank of Japan's June rate hike to 1.00% — its highest since 1995 — continues to reverberate, with officials reportedly leaving the door open to further hikes given persistent inflation risk.
- South Korea's Kospi fell -5.7% today, a standout single-day move versus the rest of the Asia-Pacific region that merits independent follow-up.
- US Initial Jobless Claims for the week ended July 18 came in at 187K, well below the 212K consensus, reinforcing a resilient US labor market narrative even as headline CPI cools.
Looking Ahead
No major market holidays are scheduled in the next five trading days across the tracked countries (US, UK, Germany, France, Japan, Australia, Switzerland, Canada, South Korea, Brazil; India's 2026 holiday data was not available). The nearest upcoming closures are: Switzerland National Day (2026-08-01), Japan Mountain Day (2026-08-11), France Assumption Day (2026-08-15), UK Summer Bank Holiday (2026-08-31), and US/Canada Labor Day (2026-09-07).
Key items to watch over the coming days: - Continued headlines on the potential US-Iran negotiation track and their effect on oil prices and risk sentiment. - Further BOJ commentary on the pace of additional rate hikes following the June move to 1.00%. - UK political developments under the new Prime Minister and their impact on Gilt yields, which remain above the psychologically important 5% level on the 10-year. - German Bund supply dynamics, with 10Y yields at 15-year highs. - Any follow-through commentary on AI capital-expenditure plans from other large-cap tech earnings, given the market's sensitivity to this theme after Alphabet's report.
Note on data gaps today: the ECB Yield Curve API (data-api.ecb.europa.eu) returned an HTTP 503 error at fetch time; the Eurozone yield curve chart and full ECB curve table were therefore omitted rather than estimated. Several European government bond yields (German 2Y/30Y, French/Italian non-10Y maturities, UK 2Y) were not available from today's web searches at current dates and are marked accordingly above.