2026 07 29
Global Financial Briefing — Wednesday, 29 July 2026
Americas index levels, commodities, US-listed ETFs and day changes reflect the 29 July closing print, and include the FOMC outcome and Meta's post-close earnings. Fixed income, FX and macro figures are dated inline.
Market Overview
Global markets are trading through a genuinely unusual cross-current today. In Seoul, the KOSPI crashed 5.98% to 5,663.24 (FRED cross-checked, yfinance ^KS11) — the second consecutive session in which South Korea's exchange triggered a market-wide circuit breaker, a first in the exchange's history. The index is now down roughly 23% for July alone, its worst month on record, as investors abruptly reassessed whether hyperscalers' AI capital spending will generate returns commensurate with its cost — a doubt sharpened by reports that Chinese firms are mass-producing DUV chipmaking tools, raising competitive pressure on Samsung Electronics and SK Hynix, which together dominate the index's weighting and posted single-day declines of 9–12%.
Wall Street then sold off hard into the close, and the reason was the Fed. The S&P 500 had been down only 0.25% at mid-afternoon; it finished 1.52% lower at 7,316.15 (^GSPC, yfinance; confirmed by FRED SP500). The Dow fell 2.19% (‑1,153.18 points) to 51,594.14 — its worst single-day decline since April 2025 — and the Nasdaq 100 dropped 2.06%. The FOMC held rates, but the hold was read as hawkish: the vote split 9–3, with Neel Kashkari (Minneapolis), Lorie Logan (Dallas) and Beth Hammack (Cleveland) all dissenting in favour of an immediate 25bp hike. In his press conference Chair Kevin Warsh pointed to the volatile energy market — the Iran conflict and disruption around the Strait of Hormuz — as the dominant source of near-term inflation risk. Long yields rose on the view that the Fed may be falling behind the inflation fight, and equities re-rated accordingly. This was a late-session reversal: markets that looked merely soft at 2:00pm ET closed near their lows.
The macro backdrop the Fed was weighing remains one of cooling measured inflation: June CPI eased to 3.46% YoY from 4.17% in May (FRED CPIAUCSL), and core CPI slowed to 2.57% from 2.82% (FRED CPILFESL). Against that, the Middle East violence resurgence pushed oil sharply higher — WTI settled +6.56%, Brent +7.90% — reintroducing exactly the inflationary cross-current Warsh flagged, and explaining why a softening CPI print did not buy the market a dovish tone.
Europe closed softer (STOXX 600 ‑0.29%, CAC 40 ‑0.60%, DAX roughly flat) with the notable exception of the FTSE 100, which added 0.34% to close within half a percent of its all-time high, and the Swiss SMI, which nudged to a fresh record — all of these finished before the US Fed decision landed and so escaped the late sell-off. Asia-Pacific outside Korea was mixed-to-firm: Hang Seng +1.96%, Shanghai +0.40%, ASX 200 +1.01%, Nifty 50 +1.10%, while the Nikkei fell 1.49% in sympathy with the US chip sell-off. Precious metals are a separate story worth flagging: gold and silver have both pulled back sharply from all-time highs reached within the past year (gold ‑26.7%, silver ‑52.1% from ATH) even as the macro backdrop (soft-ish inflation, Fed uncertainty, geopolitical risk) would typically be supportive — a divergence that merits monitoring rather than a single-day read.
Notably, the VIX closed at 18.21 (FRED VIXCLS, 2026-07-28) — still within its moderate 15-20 band, not yet showing the "elevated" or "stress" readings (>20 and >30 respectively) that would normally accompany a historic single-exchange crash, a live FOMC decision, and a Middle East-driven oil spike arriving on the same day. That reading predates Wednesday's close by a session, and the gap between it and the day's news flow is worth watching.
Global Indices Snapshot
All tracked exchanges were open today (no holiday closures per the holiday calendar).
Americas
Americas data reflects the 29 Jul close.
| Index | Level | Day Chg | Day Chg % | Source |
|---|---|---|---|---|
| S&P 500 | 7,316.15 | -112.63 | -1.52% | yfinance ^GSPC |
| Nasdaq 100 | 27,192.31 | -570.83 | -2.06% | yfinance ^NDX |
| Dow Jones | 51,594.14 | -1,153.18 | -2.19% | yfinance ^DJI |
| Brazil IBOV | 173,885.34 | -2,679.41 | -1.52% | yfinance ^BVSP |
Cross-check: FRED SP500 closed 7,316.15 on 2026-07-29 — an exact match to the yfinance close.
Europe
European data reflects today's close (29 Jul).
| Index | Level | Day Chg | Day Chg % | Source |
|---|---|---|---|---|
| Euro STOXX 600 | 645.01 | -1.88 | -0.29% | yfinance ^STOXX |
| Euro STOXX 50 | 6,248.84 | -40.67 | -0.65% | yfinance ^STOXX50E |
| CAC 40 | 8,408.27 | -50.51 | -0.60% | yfinance ^FCHI |
| DAX | 25,460.48 | -3.53 | -0.01% | yfinance ^GDAXI |
| FTSE 100 | 10,908.41 | +37.39 | +0.34% | yfinance ^FTSE |
| SMI (Swiss) | 14,486.10 | -85.23 | -0.58% | yfinance ^SSMI |
FTSE 100 is within 0.24% of its all-time high (10,934.90) — at/near record highs. SMI's close (14,486.10) is marginally above its previously recorded closing ATH (14,472.74) — a fresh record close.
Asia-Pacific
Asia-Pacific data reflects today's local close (29 Jul in each market's timezone).
| Index | Level | Day Chg | Day Chg % | Source |
|---|---|---|---|---|
| Nikkei 225 | 61,434.19 | -930.73 | -1.49% | yfinance ^N225 |
| Hang Seng | 25,807.92 | +497.07 | +1.96% | yfinance ^HSI |
| Shanghai Comp | 3,828.47 | +15.15 | +0.40% | yfinance 000001.SS |
| ASX 200 | 9,038.60 | +90.80 | +1.01% | yfinance ^AXJO |
| Kospi (Korea) | 5,663.24 | -360.42 | -5.98% | yfinance ^KS11 |
Kospi note: this figure was cross-checked against a web search (Korea Herald, Seoul Economic Daily, TechTimes) confirming a genuine crash — not a data error — driven by an AI-capex-return sell-off that triggered market-wide circuit breakers for the second consecutive session, a first in KRX history. The index's 52-week low field returned 0.0 from the data source, a known data artifact (no real index trades at zero); it has been omitted rather than shown.
Emerging Markets
| Index | Level | Day Chg % | Source |
|---|---|---|---|
| MSCI EM (EEM) | 61.07 | -2.07% | yfinance EEM |
| India Nifty 50 | 24,250.20 | +1.10% | yfinance ^NSEI |
| South Africa (EZA) | 62.08 | +0.16% | yfinance EZA |
EEM and EZA are NYSE-listed; both gave up ground into the US close.
Index Valuations & Investment Risk
Valuation Table
| Index | Trailing P/E (live) | Hist avg trailing P/E (†) | Premium/Discount |
|---|---|---|---|
| S&P 500 | 26.24x (‡) | ~16-18x | +54% |
| Nasdaq 100 | 29.37x (‡) | ~25-30x | +7% |
| Euro STOXX 600 | 18.65x | ~15-17x | +17% |
| CAC 40 | 17.68x | ~14-16x | +18% |
| DAX | 18.61x | ~15-17x | +16% |
| FTSE 100 | 18.22x | ~13-15x | +30% |
| Nikkei 225 | 19.98x | ~20-22x | -5% |
| MSCI EM | 15.74x (‡) | ~13-15x | +12% |
(†) Hist avg trailing P/E: static long-run reference constants. Trailing P/E (live): yfinance trailingPE on ETF proxies (SPY, QQQ, EXSA.DE, CAC.PA, EXS1.DE, ISF.L, 1321.T, EEM). Premium/discount computed vs the historical range midpoint; bolded where >20% above average.
(‡) Priced off the 29 Jul close. Trailing P/E is proportional to price for fixed trailing earnings, so these multiples are the intraday figures scaled by each index's close-to-intraday price ratio: S&P 500 26.57x → 26.24x, Nasdaq 100 29.94x → 29.37x, MSCI EM 16.02x → 15.74x.
Two indices remain historically stretched: the S&P 500 at a 54% premium to its long-run average trailing P/E, and the FTSE 100 at a 30% premium (despite FTSE's "value" reputation, its live multiple has re-rated well above its own historical norm as it sits near record highs). The Nikkei 225 is the only index trading at a discount to its own historical average. Wednesday's sell-off trimmed the US premium by roughly two percentage points — a reminder of how little a 1.5% day moves a valuation this extended.
Investment Risk Assessment for ETF Investors
United States (S&P 500 / Nasdaq ETFs) SPY's earnings yield at the close is 1÷26.24 = 3.81%. Against the 10-year Treasury yield of 4.65% (FRED DGS10, 2026-07-27), the S&P 500's Equity Risk Premium is ‑0.84% — still negative, meaning long bonds yield more than S&P 500 earnings. Combined with a 54% valuation premium to history and a 10Y TIPS real yield of 2.44% (FRED DFII10) — itself elevated versus the ~1-2% long-run norm — this is a classic "expensive equities, positive real rates" setup that leaves little margin of safety. The technical picture deteriorated on Wednesday: the index closed at 7,316.15, below its 50-day moving average (7,469.94) for the first time in this sequence, though still above its 200-day (7,012.60) and 4.0% below its 52-week high of 7,620.90. The Nasdaq 100 closed at 27,192.31, likewise below its 50-day (29,456.97) while holding above its 200-day (26,461.22); the broader Nasdaq Composite ended more than 10% below its record, entering correction territory (Bloomberg, CNBC). Concentration in AI/mega-cap names is the single biggest idiosyncratic risk, underscored by the Kospi/chipmaker sell-off spilling into US tech and by Meta's post-close earnings miss.
Europe (STOXX 600 / CAC 40 / DAX ETFs) STOXX 600's earnings yield is 1÷18.65 = 5.36%. Using the ECB AAA euro-area 10-year yield (3.16%, ECB YC API, 2026-07-28) as the euro risk-free proxy, the Euro Risk Premium is +2.20% — meaningfully more attractive than the US figure, and consistent with STOXX 600's smaller (17%) valuation premium versus history. This is the clearest relative-value argument in the developed-market table: European equities offer more compensation per unit of valuation risk than US equities do. European cash markets also closed before the Fed decision, so this comparison understates the gap as of Wednesday evening — the euro-area indices have Thursday's session to absorb the hawkish hold. Currency risk (EUR/USD 1.1385, FRED DEXUSEU) and geopolitical/fiscal risk (unresolved without today's France/Italy spread data — see note below) remain the key non-valuation risks for non-EUR investors.
Japan (Nikkei / TOPIX ETFs) The Nikkei's 19.98x trailing P/E is actually below its own historical range for the first time in this table, despite today's 1.49% pullback tracking the global chip sell-off. The BOJ hiked its policy rate 25bps to 1.00% effective 17 June 2026 — the first move to this level since 1995, a historic and closely watched policy shift — with board member Naoki Tamura publicly advocating further hikes toward a ~2% "neutral" rate. Further BOJ tightening is a real risk to both JPY-hedged and unhedged Nikkei exposure; USD/JPY at 163.55 (web search) remains historically weak for the yen, which has supported exporter earnings but raises reversal risk if BOJ hikes accelerate.
Emerging Markets (MSCI EM ETFs) EEM closed at 15.74x, a 12% premium to its own historical range but still the cheapest developed-vs-emerging comparison in the table relative to the US. The ETF itself fell 2.07% on the day, tracking the US close rather than the firmer Asian cash sessions it holds — a structural feature of a US-listed EM proxy worth understanding. Today's regional picture is a reminder that "EM" is not monolithic: Korea (technically MSCI EM) is in the midst of a historic single-country crash while China, India, and South Africa proxies were all firmer in local trading. Country/index concentration — not a blanket EM view — is the operative risk framework right now.
Overall Risk Score (qualitative, not financial advice): US — high valuation risk / low margin of safety given the negative ERP, a 54% historical premium, and a close below the 50-day moving average with the Fed signalling it may need to tighten rather than ease. Europe — moderate, better relative valuation but real event risk, and it has yet to price Wednesday's Fed outcome. Japan — moderate, valuation supportive but BOJ policy risk rising. Emerging Markets — bifurcated, headline valuation attractive but masks acute single-country risk in Korea.
Disclaimer: This is financial information, not personalised investment advice. Past valuations do not guarantee future returns. Consult a financial advisor before investing.
US Economic Indicators (FRED - authoritative)
| Indicator | Current | Prior | Delta | Reference Date | FRED Series |
|---|---|---|---|---|---|
| CPI YoY % | 3.46% | 4.17% | -0.71pp | 2026-06 | CPIAUCSL |
| Core CPI YoY % | 2.57% | 2.82% | -0.25pp | 2026-06 | CPILFESL |
| Unemployment Rate | 4.2% | 4.3% | -0.1pp | 2026-06 | UNRATE |
| Nonfarm Payrolls | 158,984k | 158,927k | +57k | 2026-06 (m/m chg) | PAYEMS |
| 10Y TIPS Real Yield | 2.44% | 2.43% (07-24) | +0.01pp | 2026-07-27 | DFII10 |
June's data shows headline and core inflation both decelerating faster than expected, alongside a slight improvement in unemployment — a combination that, absent today's oil spike, would have strengthened the case for Fed easing.
Other economic releases today (web search): the FOMC held rates at 2:00pm ET on a 9–3 vote (see Fixed Income below); ISM Manufacturing PMI (10:00am ET) and the ADP National Employment report (8:15am ET) were also scheduled, but their results were not retrieved.
Fixed Income & Bond Analysis
Policy Rates
| Central Bank | Rate | Source |
|---|---|---|
| Fed Funds (upper) | 3.75% | FRED DFEDTARU |
| Fed Funds (lower) | 3.50% | FRED DFEDTARL |
| Effective FFR | 3.63% | FRED DFF |
| ECB Deposit Rate | 2.25% | FRED ECBDFR |
| BOJ Policy Rate | 1.00% | web search — hiked 25bps eff. 17 Jun 2026, first move to this level since 1995 |
| BOE Bank Rate | 3.73% | FRED IUDSOIA (SONIA proxy) |
FOMC outcome (web search): rates held unchanged at today's meeting on a divided 9–3 vote, with Kashkari, Logan and Hammack dissenting in favour of an immediate 25bp hike. Chair Warsh identified energy-market volatility from the Iran conflict and Strait of Hormuz disruption as the leading near-term inflation risk. Markets had priced roughly a 64% probability of a hold going in (CME FedWatch) but read the accompanying message as hawkish.
Government Bond Yields
| Country | 2Y Yield | 10Y Yield | 30Y Yield | Source |
|---|---|---|---|---|
| USA | 4.31% | 4.65% | 5.12% | FRED (2026-07-27) |
| Eurozone (AAA, ECB proxy for Bund) | 2.71% | 3.16% | 3.60% | ECB YC API (2026-07-28) |
| UK | (not retrieved) | 4.97% | (not retrieved) | web search (2026-07-29) |
| Japan | (not retrieved) | 2.76% | (not retrieved) | web search, dated Monday 2026-07-27 — stale, most recent found |
| France | (not retrieved) | (not retrieved) | (not retrieved) | search skipped — ECB AAA curve succeeded, see note below |
| Italy | (not retrieved) | (not retrieved) | (not retrieved) | search skipped, see note below |
Note: the ECB AAA curve substitutes for the German benchmark here, so this briefing carries no standalone France or Italy 10Y yield and no OAT-Bund spread figure.
Yield Curve Spreads (FRED pre-computed): - 10Y-2Y spread: +35 bps (2026-07-28) — no longer inverted, but still well short of a historically "normal" term premium (~100bps+); best characterized as modestly positive / mid-normalization. - 10Y-3M spread: +71 bps (2026-07-28) — similarly positive, consistent with the curve continuing to un-invert as the Fed nears the end of its tightening cycle.
Both spreads support a "soft landing, gradual normalization" reading rather than either an imminent-recession or an overheating signal. Note these are 28 Jul readings and therefore predate Wednesday's hawkish hold, which pushed long yields higher — the 29 Jul curve is not yet in FRED.
Yield Curve Charts
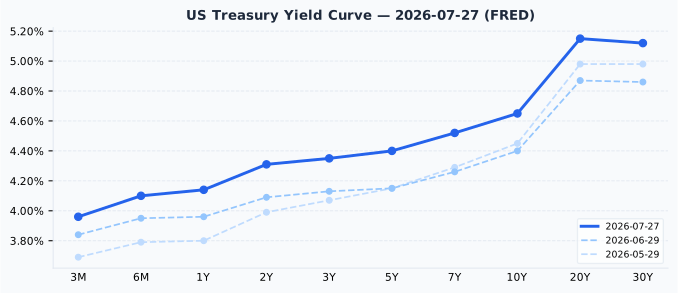
The US curve is upward-sloping across its full length with no inversion at any point from 3-month to 30-year — a normal, if still relatively flat-in-the-belly, shape. Versus one month ago (2026-06-29) and two months ago (2026-05-29), the entire curve has shifted higher by roughly 10-25 bps at the front end and 15-25 bps at the long end, consistent with the market pricing a slower, later path of Fed cuts than it was pricing in late May.
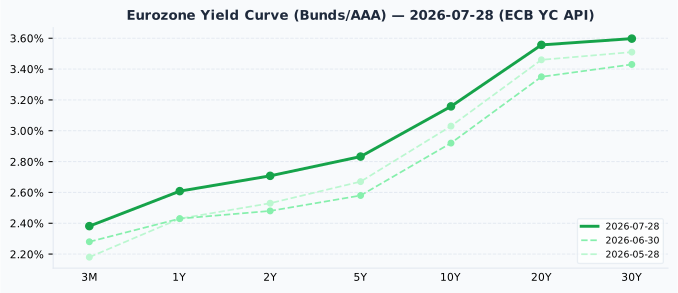
The euro-area AAA curve is also upward-sloping and normal in shape. It has steepened noticeably at the long end since a month ago (2026-06-30: 10Y 2.92% → today 3.16%, 30Y 3.43% → 3.60%), while the front end has moved up by a similar ~10bps — a broad-based rise in euro rates over the past month rather than a curve-shape change.
Credit Markets (from FRED — authoritative)
| Market | OAS Spread | Series ID |
|---|---|---|
| US Investment Grade | 81 bps | BAMLC0A0CM |
| US High Yield | 284 bps | BAMLH0A0HYM2 |
| Euro High Yield | 261 bps | BAMLHE00EHYIOAS |
All three spreads sit at the tight end of, or below, their normal historical ranges (US IG 80-150bps normal; US HY 300-500bps normal). Credit markets are currently pricing very little default or recession risk — a complacency signal worth weighing against the equity market's own stretched valuations, and one that would be the first thing to move if the Kospi-driven AI-capex reassessment broadens into corporate credit.
Bond Portfolio Implications
With the S&P 500's Equity Risk Premium at ‑0.84% (earnings yield 3.81% vs DGS10 4.65%), government bonds still offer a higher stated yield than equity earnings — a historically reliable, if not perfectly timed, warning signal for forward equity returns. Wednesday's equity sell-off narrowed the gap by only 5bps, which is the point: a negative ERP this wide is not closed by a single bad session. By contrast, the Euro Risk Premium of +2.20% argues that European government bonds are not yet as competitive with European equities.
Duration risk is symmetric: at current levels, a 100bp rise in yields implies roughly an 8-9% price loss on a 10-year bond. Given the curve has already backed up 15-25bps over the past month and long yields rose again on the Fed's hawkish hold, investors extending duration purely to "lock in" today's yields should size positions with that mark-to-market sensitivity in mind. Short-duration instruments continue to offer competitive carry (3M at 3.96%) with materially less price risk.
Currencies & Commodities
Currencies:
| Pair | Rate | Source |
|---|---|---|
| EUR/USD | 1.1385 | FRED DEXUSEU (2026-07-24) |
| USD Index | 120.71 | FRED DTWEXBGS (2026-07-24) |
| USD/JPY | 163.55 | web search (2026-07-29) |
| GBP/USD | 1.3315 | web search (2026-07-29) |
| USD/CHF | 0.8156 | web search (2026-07-29) |
Commodities (all from yfinance front-month futures, 29 Jul settlement):
| Commodity | Price | Day Chg % | Ticker | Source |
|---|---|---|---|---|
| Brent Crude | $90.74 | +7.90% | BZ=F | yfinance |
| WTI Crude | $84.46 | +6.56% | CL=F | yfinance |
| Gold ($/oz) | $4,097.00 | -0.04% | GC=F | yfinance |
| Silver ($/oz) | $58.09 | +0.97% | SI=F | yfinance |
| Copper ($/lb) | $6.31 | -0.76% | HG=F | yfinance |
| Nat Gas ($/MMBtu) | $2.72 | +0.77% | NG=F | yfinance |
Oil's sharp jump (WTI +6.6%, Brent +7.9%) is corroborated by web-search reporting of a Middle East violence resurgence pushing Brent above $90, and was singled out by Chair Warsh as the leading near-term inflation risk. Both crudes nonetheless remain far below their respective all-time highs — WTI is 42.6% below its $147.27 ATH and Brent 38.5% below its $147.43 ATH — so the move is a sharp risk-premium spike, not a return to crisis-era price levels.
Gold and silver deserve explicit ATH context given high investor attention: gold at $4,097.00 is 26.7% below its all-time high of $5,586.20 (a level reached within the past 52 weeks); silver at $58.09 is 52.1% below its all-time high of $121.30 (also a within-year record). Both metals have therefore undergone a substantial correction from very recent records rather than trading near highs, despite the current mix of geopolitical risk and easing inflation that might typically be seen as supportive. Copper at $6.31 is 5.1% below its all-time high of $6.6525 — it slipped out of the "slightly below" band into a clearer discount on the day's close. Natural gas remains far below its historical ATH ($15.78), a spike-driven reference point (2022 energy crisis) with limited relevance to current pricing.
Crypto: no moves above 3% today; omitted.
Sector & Theme Highlights
The AI-capital-expenditure debate is today's dominant cross-market theme, and Wednesday's post-close earnings sharpened it considerably. Meta reported Q2 EPS of $6.18 against roughly $7.18 expected — a 14% miss and a 13% decline — while beating on revenue at $60.80bn (+27% YoY) and simultaneously raising the floor of its capex guidance to $135–145bn from $125–145bn. That is the AI-capex thesis stated numerically: revenue is growing, earnings are being consumed by the buildout, and the company is committing to spend more. The stock fell after hours. Microsoft also reported after the close; its results were not retrieved for this briefing.
That theme links the day's otherwise separate stories: Korea's KOSPI/KOSDAQ crash (Samsung Electronics and SK Hynix, both AI-memory suppliers, down 9-12%), the Nasdaq 100's chipmaker-led weakness, and single-stock moves — Nebius Group ‑8.6% (AI-infrastructure "neocloud"), Cognizant +7.7% (AI-partnership revenue beat), Sherwin-Williams +8.3% (EPS beat, unrelated to AI); these three are intraday moves rather than closing prices. The split between AI-infrastructure suppliers selling off and AI-services beneficiaries with earnings beats rallying suggests the market is repricing who captures AI-spending returns rather than rejecting the AI theme outright.
A secondary theme is rates-and-energy, and Wednesday resolved it in the hawkish direction: a divided FOMC holding rates while three members pushed to hike, a Middle East-driven oil spike the Chair named as the primary inflation risk, and a cooling US CPI print that proved insufficient to offset either. BOJ policy normalization (first hike to 1% since 1995) adds a second, independent tightening vector for global yields via JPY funding costs.
Top Stories (Global)
- FOMC holds rates but splits 9–3, with Kashkari, Logan and Hammack dissenting in favour of an immediate 25bp hike; Chair Warsh flagged Iran-driven energy volatility and Strait of Hormuz disruption as the leading inflation risk. Equities fell sharply after the press conference — the Dow's 2.19% drop was its worst since April 2025. (CNBC, Bloomberg, Yahoo Finance, Motley Fool)
- Meta misses on Q2 earnings and raises capex guidance: EPS $6.18 vs ~$7.18 expected, revenue $60.80bn (+27% YoY) ahead of forecasts, capex floor lifted to $135–145bn. Shares fell after hours, crystallising the AI-return debate. (Yahoo Finance, TipRanks)
- KOSPI/KOSDAQ crash for a 2nd consecutive session, triggering back-to-back market-wide circuit breakers for the first time in Korean exchange history; index down ~23% in July, its worst month on record, on AI-capex-return doubts sharpened by reports of Chinese mass production of DUV chipmaking tools. (Korea Herald, Seoul Economic Daily, TechTimes)
- Nasdaq Composite enters correction, closing more than 10% below its record high as the chip complex and mega-cap tech led the decline. (Bloomberg, CNBC)
- Middle East violence resurgence drives Brent crude to a $90.74 settle (+7.9%), lifting bond yields and denting risk appetite alongside the equity-market weakness. (Bloomberg)
- BOJ hiked its policy rate 25bps to 1.00% effective 17 June 2026 — the first move to this level since 1995, on a split 7-1 board vote; dissenting board member Naoki Tamura has since argued for further hikes toward a ~2% neutral rate. (CNBC, Bloomberg)
- US June CPI cooled to 3.46% YoY (core 2.57%) from May's 4.17% (core 2.82%) — a larger-than-typical one-month deceleration that nonetheless failed to buy the market a dovish Fed. (FRED CPIAUCSL/CPILFESL)
Looking Ahead
Key events in the next 1-5 trading days: - Fed repricing: with three FOMC members having voted to hike, watch the front end of the curve and Fed funds futures for how quickly the market abandons its remaining cut expectations. - Microsoft's Q2 results (reported after Wednesday's close, not retrieved here) and the read-across from Meta's capex guidance for the wider AI-infrastructure complex. - BOE meeting Thursday (per web search context) — a live event for GBP and UK Gilts alongside the already-elevated 4.97% 10Y Gilt yield. - European and Asian catch-up: both closed before the FOMC decision, so Thursday's sessions are their first opportunity to price the hawkish hold. - US Q2 GDP (1st release): scheduled 2026-07-30 at 8:30am ET, per web search — the day after this briefing.
Market closures in the next 3 weeks (from the Nager.Date holiday calendar):
| Date | Country | Holiday |
|---|---|---|
| 2026-08-01 | Switzerland | Swiss National Day |
| 2026-08-11 | Japan | Mountain Day |
| 2026-08-15 | France | Assumption Day |
| 2026-08-17 | South Korea | Liberation Day |
No US, UK, Germany, Australia, Canada, Brazil, or India closures are scheduled in this window.