2026 07 28
Global Financial Briefing — Tuesday, 28 July 2026
Market Overview
Global markets are in a holding pattern ahead of tomorrow's FOMC rate decision, with the standout story a sharp divergence between broad-market breadth and mega-cap tech. The Dow Jones is up 1.11% intraday while the Nasdaq 100 is down 0.88%, as a rotation out of chipmakers — driven by China AI-competition concerns and circular-funding worries in the semiconductor supply chain — continues to deepen. Notably, the equal-weighted version of the S&P 500 hit record highs today, a sign that strength is broadening beyond the small group of AI-linked mega-caps that have dominated the rally. Oil fell sharply (Brent −4.4%, WTI −3.8%) on reports of a possible US-Iran de-escalation, which is easing inflation-expectation pressure into the Fed decision.
Europe is broadly firm — every major index in the region is higher, led by the Swiss SMI (+1.04%), which is trading at/near record highs. The Eurozone AAA yield curve (ECB data) has drifted up across all maturities over the past month, mirroring the move in US Treasuries, with the 10Y euro-area yield up roughly 25 bps since late June. Asia-Pacific is where today's biggest story actually is: South Korea's Kospi crashed 10.84% to 6,023.66, briefly breaching the 6,000 level (a ~3-month low) and triggering the country's 8th circuit breaker of the year, as SK Hynix and Samsung — together roughly half the index's weight — were hit hard by the same chipmaker selloff pressuring US and Japanese tech. Japan's Nikkei 225 fell 3.95% for the same reason, and the Bank of Japan's June hike to 1.00% (the first move to this level since 1995) continues to reprice Japanese equities and the yen on top of that. China's Shanghai Composite eased 1.16%, while Hong Kong, Australia, and India were little changed to modestly higher.
Fixed income markets remain calm ahead of the Fed: the 10Y Treasury sits at 4.69%, VIX is at a moderate 18.67, and credit spreads are historically tight (US IG at 81 bps, US HY at 281 bps) — the Kospi's circuit-breaker-triggering plunge reads as a concentrated, chipmaker-specific event rather than the start of systemic contagion, since neither VIX nor global credit spreads are showing stress. The 10Y-2Y curve is modestly positive at 34 bps, well within normal (non-inverted) territory, while the equity risk premium on the S&P 500 has turned negative, a valuation signal worth watching as the market waits on tomorrow's rate decision.
Global Indices Snapshot
Americas
Intraday — US markets are currently in regular session (as of 14:09 ET); levels are live, not closing prices.
| Index | Level | Day Chg | Day Chg % | Source |
|---|---|---|---|---|
| S&P 500 | 7,432.16 | +18.98 | +0.26% | yfinance ^GSPC |
| Nasdaq 100 | 27,792.18 | −247.03 | −0.88% | yfinance ^NDX |
| Dow Jones | 52,789.34 | +579.26 | +1.11% | yfinance ^DJI |
| Brazil IBOV | 176,732.70 | +1,398.25 | +0.80% | yfinance ^BVSP |
Europe
| Index | Level | Day Chg | Day Chg % | Source |
|---|---|---|---|---|
| Euro STOXX 600 | 646.89 | +2.27 | +0.35% | yfinance ^STOXX |
| CAC 40 | 8,458.78 | +52.72 | +0.63% | yfinance ^FCHI |
| DAX | 25,464.01 | +102.98 | +0.41% | yfinance ^GDAXI |
| FTSE 100 | 10,871.02 | +89.27 | +0.83% | yfinance ^FTSE |
| SMI (Swiss) | 14,571.33 | +149.36 | +1.04% | yfinance ^SSMI |
European data reflects today's close (28 Jul). The Swiss SMI is trading at/near record highs, marginally above its last recorded all-time high.
Asia-Pacific
| Index | Level | Day Chg | Day Chg % | Source |
|---|---|---|---|---|
| Nikkei 225 | 62,364.92 | −2,566.28 | −3.95% | yfinance ^N225 |
| Hang Seng | 25,310.85 | +103.65 | +0.41% | yfinance ^HSI |
| Shanghai Comp | 3,813.31 | −44.93 | −1.16% | yfinance 000001.SS |
| ASX 200 | 8,947.80 | +53.80 | +0.60% | yfinance ^AXJO |
| Kospi (Korea) | 6,023.66 | −732.09 | −10.84% | yfinance ^KS11 / confirmed via web search |
Asia-Pacific data reflects today's close (28 Jul). Kospi crash confirmed: yfinance initially flagged as an outlier (no other Asian index showed a comparable move) and cross-checked via web search — the −10.84% decline is real, not a data error. The Kospi briefly dipped below 6,000 intraday (a ~3-month low) and triggered Korea's 8th circuit breaker of 2026, driven by a selloff in SK Hynix and Samsung — together roughly half the index's weight — amid the broader global chipmaker rout also hitting the Nasdaq 100 and Nikkei 225 today. One data quality issue remains genuinely unresolved: yfinance's 52-week-low field for ^KS11 still returned 0.0, which is impossible for an index and has been omitted rather than published.
Emerging Markets
| Index | Level | Day Chg % | Source |
|---|---|---|---|
| MSCI EM (EEM) | 62.38 | −1.95% | yfinance EEM |
| India Nifty 50 | 23,985.35 | −0.04% | yfinance ^NSEI |
| South Africa (EZA) | 62.01 | +0.11% | yfinance EZA |
Index Valuations & Investment Risk
Valuation Table
| Index | Trailing P/E (live) | Hist avg trailing P/E (†) | Premium/Discount |
|---|---|---|---|
| S&P 500 | 26.65x | ~16-18x | +56.8% |
| Nasdaq 100 | 30.00x | ~25-30x | +9.1% |
| Euro STOXX 600 | 18.70x | ~15-17x | +16.9% |
| CAC 40 | 17.78x | ~14-16x | +18.5% |
| DAX | 18.62x | ~15-17x | +16.4% |
| FTSE 100 | 18.16x | ~13-15x | +29.7% |
| Nikkei 225 | 20.26x | ~20-22x | −3.5% |
| MSCI EM | 16.08x | ~13-15x | +14.9% |
(†) Hist avg trailing P/E: static long-run reference constants.
Trailing P/E (live): sourced from yfinance trailingPE on ETF proxies (SPY, QQQ, EXSA.DE, CAC.PA, EXS1.DE, ISF.L, 1321.T, EEM). Premium/discount computed vs the historical-average midpoint; bold = >20% above historical average.
Investment Risk Assessment for ETF Investors
United States (S&P 500 / Nasdaq ETFs) SPY's trailing P/E of 26.65x sits 56.8% above the ~16-18x long-run average — historically stretched territory. Earnings yield is (1÷26.65) = 3.75%, and against the 10Y Treasury yield of 4.69% (FRED DGS10), that produces a negative equity risk premium of about −0.94% — bonds currently yield more than the earnings on offer from the index, a warning signal for forward equity returns historically. QQQ's 30.00x trailing P/E is only modestly above its (wider) 25-30x historical band. The S&P 500 sits 2.5% below its all-time high of 7,620.90, with today's price above both its 50-day (7,471.39) and 200-day (7,009.23) moving averages — an uptrend intact but stretched on valuation. The 10Y TIPS real yield of 2.43% (FRED DFII10) is a meaningful headwind to further multiple expansion. Concentration and AI-capex risk are underscored by today's chip-sector rotation.
Europe (STOXX 600 / CAC 40 / DAX ETFs) European valuations are considerably more reasonable: EXSA.DE's 18.70x trailing P/E is only 16.9% above its ~15-17x historical average. Using the ECB AAA euro-area 10Y yield (3.17%) as the euro risk-free proxy, earnings yield of (1÷18.70) = 5.35% produces a positive equity risk premium of about +2.18% — a meaningfully better risk/reward setup than the US on this metric. CAC 40 (17.78x, +18.5% premium) and DAX (18.62x, +16.4% premium) sit in similar territory. Currency risk for non-EUR investors and ongoing fiscal/political headline risk in France remain considerations; note that individual German Bund and French OAT yields are not available today (see Fixed Income section) — the ECB AAA curve stands in as the best available euro-area risk-free proxy.
Japan (Nikkei / TOPIX ETFs) The Nikkei's 20.26x trailing P/E is actually 3.5% below its historical 20-22x range, but today's price action illustrates the two live risks: a 3.95% single-day decline tied to chip-sector weakness, and the BOJ's June hike to 1.00% (first time at this level since 1995), which is repricing both yen-hedge costs and export-heavy earnings. Currency-hedge decisions matter more than usual here given the active BOJ normalization path.
Emerging Markets (MSCI EM ETFs) EEM's 16.08x trailing P/E is 14.9% above its ~13-15x historical average — not stretched, but no longer the deep discount to developed markets it once was. China policy and currency risk remain the dominant swing factors for the asset class.
Overall Risk Score (qualitative, not financial advice): - United States: High valuation risk / low margin of safety — negative ERP and a historically stretched P/E premium. - Europe: Attractive relative valuation — modest P/E premiums and a positive, meaningfully larger ERP than the US. - Japan: Moderate — fair valuation on P/E, but active policy-normalization and currency risk. - Emerging Markets: Moderate — fair value, mixed signals from China exposure.
Disclaimer: This is financial information, not personalised investment advice. Past valuations do not guarantee future returns. Consult a financial advisor before investing.
US Economic Indicators (FRED - authoritative)
| Indicator | Current | Reference Date | FRED Series |
|---|---|---|---|
| CPI YoY % | 3.46% | 2026-06 | CPIAUCSL |
| Core CPI YoY % | 2.57% | 2026-06 | CPILFESL |
| Unemployment Rate | 4.2% | 2026-06 | UNRATE |
| Nonfarm Payrolls | 158,984k (+57k m/m) | 2026-06 | PAYEMS |
| 10Y TIPS Real Yield | 2.43% | 2026-07-24 | DFII10 |
FRED macro data is monthly and lags 4-6 weeks; the June reading is the most recent available.
Other economic releases today (web search): US Consumer Confidence and the Richmond Fed Manufacturing Survey were both scheduled for 10:00 AM ET; results were not yet available. The dominant calendar event is the two-day FOMC meeting, which began today and concludes tomorrow (2026-07-29) with the rate decision.
Fixed Income & Bond Analysis
Policy Rates
| Central Bank | Rate | Source |
|---|---|---|
| Fed Funds (upper) | 3.75% | FRED DFEDTARU |
| Fed Funds (lower) | 3.50% | FRED DFEDTARL |
| Effective FFR | 3.63% | FRED DFF |
| ECB Deposit Rate | 2.25% | FRED ECBDFR |
| BOJ Policy Rate | 1.00% | web search (hiked 25bps 2026-06-17, first time at this level since 1995) |
| BOE Bank Rate | ~3.73% | FRED IUDSOIA (SONIA proxy) |
Government Bond Yields
| Country | 2Y Yield | 10Y Yield | 30Y Yield | Source |
|---|---|---|---|---|
| USA | 4.33% | 4.69% | 5.16% | FRED |
| Germany (AAA euro-area proxy) | 2.73% | 3.17% | 3.59% | ECB YC API |
| France | (not retrieved) | (not retrieved) | — | web |
| UK | (not retrieved) | 4.96% | — | web |
| Japan | — | 2.76% | — | web |
| Italy | (not retrieved) | (not retrieved) | — | web |
No separate Germany, France or Italy sovereign yields today. The ECB Yield Curve API provides the AAA euro-area curve, a close German-Bund proxy, but not the individual France and Italy series.
Yield Curve Spreads (FRED pre-computed): - 10Y-2Y spread: 34 bps (2026-07-27) — positive/normal, not inverted; the curve is only modestly upward-sloping and well below historically "steep" levels (~75 bps+). - 10Y-3M spread: 69 bps (2026-07-27) — positive; no recession signal from this metric currently.
Yield Curve Charts
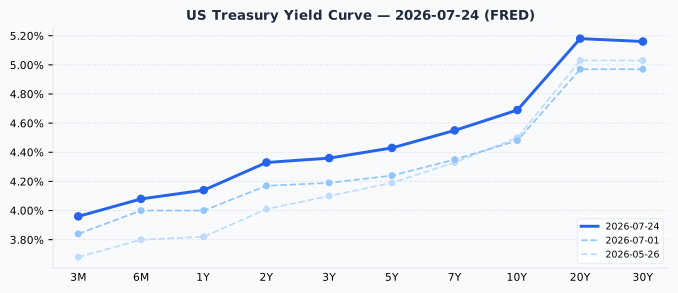
The US curve is upward-sloping across its full length with no inversion, consistent with the positive 10Y-2Y and 10Y-3M spreads above. Versus one month ago (2026-07-01), the entire curve has shifted up in a broadly parallel fashion — the front end (3M) rose about 12 bps while the 10Y and 30Y rose 21 bps and 19 bps respectively, a mild bear-steepening as the market prices in a slower Fed cutting path ahead of tomorrow's decision.
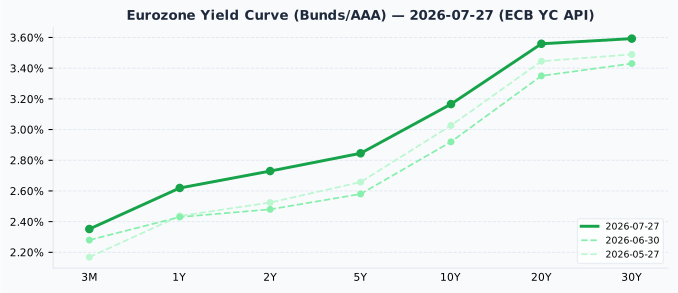
The eurozone AAA curve is also cleanly upward-sloping with no inversion. Since one month ago (2026-06-30), yields have risen across the curve as well — the 10Y point moved from 2.92% to 3.17% (+25 bps), broadly tracking the parallel upward shift seen in US Treasuries over the same window.
Credit Markets (from FRED — authoritative)
| Market | OAS Spread | Series ID |
|---|---|---|
| US Investment Grade | 81 bps | BAMLC0A0CM |
| US High Yield | 281 bps | BAMLH0A0HYM2 |
| Euro High Yield | 258 bps | BAMLHE00EHYIOAS |
Both US IG (80-150 bps normal range) and US HY (300-500 bps normal range) spreads sit at the tight end of or below their typical historical bands — signaling credit-market complacency/strong risk appetite rather than any visible stress, even with today's tech-sector rotation.
Bond Portfolio Implications
The S&P 500's equity risk premium is negative (−0.94%, see Valuation section above) — historically a signal that bonds are offering more compensation than equities at current prices, a headwind for further US equity multiple expansion. Europe's equity risk premium is meaningfully positive (+2.18%), a more constructive setup. With the 10Y Treasury at 4.69%, a 100 bps rise in yields would translate to roughly an 8-9% price loss on a 10-year bond — duration risk remains a live consideration given the FOMC decision lands tomorrow. Short-duration positioning limits that mark-to-market risk but sacrifices yield-curve carry if the Fed's path turns more dovish than priced.
Currencies & Commodities
Currencies:
| Pair | Rate | Source |
|---|---|---|
| EUR/USD | 1.1385 | FRED DEXUSEU |
| USD Index | 120.71 | FRED DTWEXBGS |
| USD/JPY | 163.68 | web search |
| GBP/USD | 1.3315 | web search |
| USD/CHF | 0.8156 | web search |
Commodities (all from yfinance front-month futures):
| Commodity | Price | Day Chg % | Ticker | Source |
|---|---|---|---|---|
| Brent Crude | $84.46/bbl | −4.41% | BZ=F | yfinance |
| WTI Crude | $79.48/bbl | −3.79% | CL=F | yfinance |
| Gold ($/oz) | $4,028.00 | −1.20% | GC=F | yfinance |
| Silver ($/oz) | $57.35 | −2.32% | SI=F | yfinance |
| Copper ($/lb) | $6.3395 | −0.62% | HG=F | yfinance |
| Nat Gas ($/MMBtu) | $2.711 | −2.76% | NG=F | yfinance |
Both crude benchmarks fell sharply on reports of a possible US-Iran de-escalation, easing an inflation risk premium into tomorrow's FOMC decision. WTI is 46.0% below its all-time high of $147.27/bbl, and Brent is 42.7% below its all-time high of $147.43/bbl — both well within normal historical trading ranges, not near any stress level.
Gold is at $4,028.00/oz, 27.9% below its all-time high of $5,586.20/oz — a notable pullback, and worth flagging that this ATH was also this year's 52-week high, meaning the current price reflects a real retracement from a very recent record rather than a long-past peak. Silver shows the same pattern: $57.35/oz is 52.7% below its all-time high of $121.30/oz, which was also set within the past 52 weeks.
Copper is $6.3395/lb, just 4.7% below its all-time high of $6.6525/lb — slightly below its record. Natural gas at $2.711/MMBtu is far below its nominal all-time high of $15.78/MMBtu, but that figure dates to a historic 2005/2008 supply-shock spike and is not representative of the current market regime; the 52-week range ($2.483-$7.827) is the more meaningful reference, and today's price sits near the low end of that band.
Crypto: No moves above 3% were flagged today; omitted.
Sector & Theme Highlights
The dominant cross-market theme today is a rotation out of AI/semiconductor names and into more economically sensitive, broad-market exposure — and Korea is where it hit hardest. The Kospi's 10.84% crash (circuit-breaker-triggering, driven by SK Hynix and Samsung, roughly half the index) is the most acute expression of a global chip selloff that also weighed on Japan's Nikkei 225 (−3.95%) and the Nasdaq 100 (−0.88%) even as the Dow outperformed and the S&P 500 equal-weight index hit record highs — a sign that non-tech breadth is broadening even as chip-specific names sell off hard. Falling oil prices are a second cross-market theme, easing inflation-expectation pressure into the Fed decision and likely weighing on energy-sector performance globally. Central-bank policy divergence is a third: the Fed is mid-meeting with a decision due tomorrow, the BOJ has just begun a historic tightening cycle (first hike to 1.00% since 1995), while the ECB and BOE remain on hold at 2.25% and ~3.73% respectively.
Top Stories (Global)
- Kospi crashes 10.8%, triggers circuit breaker: South Korea's Kospi plunged 10.84% to 6,023.66, briefly dipping below 6,000 for the first time in ~3.5 months, as SK Hynix and Samsung — roughly half the index — were hit by heavy selling amid the global chipmaker rout. It was Korea's 8th circuit breaker of 2026. (US News, Korea Herald, Wolf Street)
- Fed decision looms: The FOMC's two-day meeting began today, with the rate decision due tomorrow (2026-07-29) — the dominant catalyst for markets this week. (Kiplinger)
- Chip-sector rotation deepens: Investors continued rotating out of high-profile semiconductor names amid China AI-competition concerns and circular-funding worries within the sector, dragging the Nasdaq 100 lower even as the broader market advanced. (TheStreet, 247WallSt)
- Oil slides on Iran de-escalation hopes: Brent crude sank roughly 5% after reports of progress in US-Iran talks, easing inflation worries and pulling bond yields lower ahead of the Fed decision. (Bloomberg)
- Breadth improving beneath the surface: The S&P 500's equal-weight index — which strips out mega-cap concentration bias — hit a record high today even as the cap-weighted index and Nasdaq 100 lagged, a sign of broadening market participation. (Yahoo Finance)
- Big Tech earnings on deck: Four of the "Magnificent Seven" — Microsoft, Meta, Apple, and Amazon — report earnings this Wednesday and Thursday, a major catalyst for mega-cap tech sentiment. (Kiplinger)
- BOJ's historic tightening continues to reverberate: Japan's June rate hike to 1.00% — the first time at this level since 1995 — remains a live driver of yen and Nikkei price action, plausibly a contributor to today's sharp Nikkei decline. (CNBC)
Looking Ahead
Key events in the next 1-5 trading days: - FOMC rate decision — tomorrow, 2026-07-29 (meeting concludes; decision and press conference due). - Big Tech earnings — Microsoft, Meta, Apple, and Amazon report this Wednesday/Thursday (2026-07-29/2026-07-30). - BOJ policy watch — ongoing repricing following the June hike to 1.00%; any further commentary from BOJ officials is a watch item for JPY and Nikkei positioning.
Market closures (from holiday calendar, next dates across tracked markets): - Switzerland — Swiss National Day, Saturday 2026-08-01 (falls on a weekend; limited market impact). - Japan — Mountain Day, Tuesday 2026-08-11. - France — Assumption Day, Saturday 2026-08-15 (weekend). - South Korea — Liberation Day, Monday 2026-08-17. - UK — Summer Bank Holiday, Monday 2026-08-31.
Note: the Nager.Date holiday calendar does not carry India holiday data for 2026 — Indian market closures could not be checked.