2026 09 07
Global Financial Briefing — Monday, 7 September 2026
US, Canadian and Brazilian markets are closed today (Labor Day, Labour Day, Independence Day). Americas index levels and all commodity prices in this briefing are Friday 4 September settlements. European figures are as of 17:15 CEST, minutes before the cash close, so they may differ slightly from the final prints.
Market Overview
With Wall Street shut for Labor Day, the day belonged to Asia, and Asia delivered a semiconductor melt-up. South Korea's Kospi jumped 4.61% to 6,995.39 and Japan's Nikkei 225 added 2.12% to 66,399.84, both driven by chipmakers: SK Hynix rose 8.26%, Samsung 5.68%, SoftBank 11.22% and Advantest 4.20%, extending Friday's strength in US semiconductors. The move is large enough to warrant scepticism, so both were checked against independently held prior closes of 6,687.21 and 65,020.94; the percentages are genuine. Europe could not follow. The STOXX 600 finished the session essentially flat at 650.21 (+0.05%), the DAX slipped 0.19% and the Swiss SMI lost 0.66%, with the CAC 40 the region's best performer at +0.34%.
The larger story is in rates, and it is a story about oil. The United States struck three Iranian oil tankers over the weekend in response to ballistic missile attacks on US Navy warships, and Tehran has responded by attacking US-linked vessels and signalling a "restricted" maritime zone beyond the Strait of Hormuz. Brent gained 7.8% last week and WTI nearly 10% before this weekend's escalation. That energy shock is now feeding directly into policy expectations on three continents at once. Euro area HICP accelerated to 3.3% in August, and consensus has the ECB raising its deposit rate 25 bp to 2.50% on Thursday. Futures imply roughly a 65% chance the Fed hikes 25 bp on 16 September, after a 9 to 3 hold in July with three dissents in favour of a hike, and Chair Warsh's judgement that underlying inflation has not "meaningfully improved". The BOJ, which took its policy rate to a 31-year high of 1.00% in June, is priced at about 63% for another quarter point on 18 September. Three of the four major central banks are being pushed the same direction by the same barrel of crude.
The bond market has already moved. The US 30-year settled at 5.24% and the 20-year at 5.25% on Friday, the 10-year at 4.78%, up 15 bp in a month. The euro area AAA 10-year at 3.35% is just short of a 15-year high, and the UK is the standout: a 10-year gilt at 5.15% sits 37 bp above the equivalent Treasury, which is a remarkable place for a G7 sovereign to trade. Note that the US Treasury market was also closed today, so there are no live intraday yields to report; every US yield below is Friday's settled print. Equities, meanwhile, are behaving as though none of this is happening. The VIX at 14.32 is squarely in complacent territory, US high yield trades at 265 bp and investment grade at 81 bp, both at or inside the tight end of their historical ranges. The gap between what the rates market is pricing and what the equity and credit markets are pricing is the single most interesting feature of this session.
Global Indices Snapshot
Americas
| Index | Level † | Source |
|---|---|---|
| S&P 500 | 7,718.60 | yfinance ^GSPC |
| Nasdaq 100 | 29,544.15 | yfinance ^NDX |
| Dow Jones | 53,414.25 | yfinance ^DJI |
| Brazil IBOV | 185,147.16 | yfinance ^BVSP |
† All levels reflect the 4 September close. US and Canadian markets are closed today for Labor Day / Labour Day (7 September) and Brazil for Independence Day (7 September), per Nager.Date public holiday data.
Europe
| Index | Level | Day Chg | Day Chg % | Source |
|---|---|---|---|---|
| Euro STOXX 600 | 650.21 | +0.33 | +0.05% | yfinance ^STOXX |
| CAC 40 | 8,307.29 | +28.52 | +0.34% | yfinance ^FCHI |
| DAX | 25,996.47 | -49.93 | -0.19% | yfinance ^GDAXI |
| FTSE 100 | 10,821.41 | -9.68 | -0.09% | yfinance ^FTSE |
| SMI (Swiss) | 14,301.28 | -94.66 | -0.66% | yfinance ^SSMI |
European data reflects today's session (7 Sep), as of 17:15 CEST. The Euro STOXX 50 closed at 6,403.88, up 0.17%.
Asia-Pacific
| Index | Level | Day Chg | Day Chg % | Source |
|---|---|---|---|---|
| Nikkei 225 | 66,399.84 | +1,378.90 | +2.12% | yfinance ^N225 |
| Hang Seng | 25,413.12 | -237.75 | -0.93% | yfinance ^HSI |
| Shanghai Comp | 3,932.70 | +2.58 | +0.07% | yfinance 000001.SS |
| ASX 200 | 9,010.90 | +5.00 | +0.06% | yfinance ^AXJO |
| Kospi (Korea) | 6,995.39 | +308.18 | +4.61% | yfinance ^KS11 |
Asia-Pacific data reflects today's close (7 Sep).
Emerging Markets
| Index | Level | Day Chg % | Source |
|---|---|---|---|
| MSCI EM (EEM) | 68.70 † | — | yfinance EEM |
| India Nifty 50 | 23,779.15 | -0.50% | yfinance ^NSEI |
| South Africa | 71.64 † | — | yfinance EZA |
† EEM and EZA are US-listed ETFs: levels reflect the 4 September close, NYSE is closed today for Labor Day.
Index Valuations & Investment Risk
Valuation Table
| Index | Trailing P/E (live) | Hist avg trailing P/E (†) | Premium to hist avg midpoint |
|---|---|---|---|
| S&P 500 | 24.88x | ~16-18x | +46.4% |
| Nasdaq 100 | 29.30x | ~25-30x | +6.6% |
| Euro STOXX 600 | 17.92x | ~15-17x | +12.0% |
| CAC 40 | 17.03x | ~14-16x | +13.6% |
| DAX | 18.81x | ~15-17x | +17.6% |
| FTSE 100 | 18.19x | ~13-15x | +30.0% |
| Nikkei 225 | 22.35x | ~20-22x | +6.4% |
| MSCI EM | 14.61x | ~13-15x | +4.4% |
(†) Hist avg trailing P/E: static long-run reference constants, the one figure here not fetched live. Trailing P/E (live): yfinance trailingPE on ETF proxies (SPY, QQQ, EXSA.DE, CAC.PA, EXS1.DE, ISF.L, 1321.T, EEM), fetched today. Bold marks a premium above 20%.
Two indices are flagged. The S&P 500 at 24.88x carries a 46% premium to its long-run average, which crosses the "historically stretched" threshold. The FTSE 100 at 18.19x is the surprise: a 30% premium on an index whose reputation is built on being cheap. Everything else sits in the 4% to 18% band, which is a premium but not an extreme one.
Investment Risk Assessment for ETF Investors
United States (S&P 500 / Nasdaq ETFs)
The S&P 500 earnings yield is 4.02% (1÷24.88), against a 10-year Treasury at 4.78%. The earnings yield gap is therefore -0.76 pp: the government bond currently offers more contractual income than the index offers in trailing earnings, and the equity holder receives only the dividend and buyback portion of that 4.02% as cash in any case. The Nasdaq 100 is worse on this measure at -1.37 pp. Corrected onto a real basis, using the TIPS yield of 2.43% rather than the nominal, the gap flips to +1.59 pp. The size of that correction, 2.35 pp, is the point worth noting: it is larger than the gap itself, which is exactly why the nominal version should not be read on its own.
Positionally, the index closed Friday 1.26% below its all-time high, 1.7% above its 50-day moving average and 8.1% above its 200-day, with a 52-week range of 6,316.91 to 7,816.70. That is a market in an uptrend, priced for continuation, with a valuation premium of 46% and a real risk-free rate of 2.43% working against it. Concentration in a handful of AI-linked names remains the specific vulnerability: today's Asian session shows how much index direction now depends on the semiconductor complex.
Europe (STOXX 600 / CAC 40 / DAX ETFs)
The STOXX 600 earnings yield is 5.58% (1÷17.92) against a euro area AAA 10-year of 3.35%, a nominal gap of +2.23 pp. On a real basis, against a euro real 10-year of 1.31%, the gap is +4.27 pp. The CAC 40 is more generous still at +2.52 pp nominal and +4.56 pp real, though that partly reflects the index having lagged: it sits 5.11% below its all-time high and 1.73% below its 50-day moving average, the only major European index trading under its own short-term trend.
Comparing the US gap of -0.76 pp with the euro gap of +2.23 pp is tempting and partly misleading. Some of that 3 pp difference is simply the gap between US and euro-area inflation and policy paths rather than a difference in risk compensation. On the real-yield version, which is the correct check, the comparison is +1.59 pp against +4.27 pp, so Europe still looks better, but by 2.7 pp rather than 3.0 pp. The remainder is a genuine valuation difference: 24.88x against 17.92x.
For a euro-based investor holding EUR-quoted European funds, there is no FX effect on the quoted value of the holding, but there is real currency exposure inside the earnings. CAC 40 and STOXX 600 constituents are multinationals with substantial revenue outside the euro area, so the exposure is smaller, slower and partly hedged by foreign cost bases, not absent.
The specific European risk right now is the ECB. A hike on Thursday is close to fully expected, so the market reaction will turn on the guidance rather than the decision, and euro yields are already at 15-year highs. German industrial production falling 1.1% in July, against a +0.2% consensus, is an uncomfortable backdrop for a tightening decision.
Japan (Nikkei / TOPIX ETFs)
At 22.35x the Nikkei carries only a 6.4% premium to its long-run average, and the earnings yield of 4.47% against a 10-year JGB at 2.91% gives a positive gap of about 1.6 pp. The index is 8.83% below its all-time high and closed today fractionally below its 50-day moving average despite the 2.12% jump, which tells you how far it had fallen in the preceding week. The currency decision dominates everything else here: at 159.36 the yen is weak enough that an unhedged euro or dollar investor has been paying for Japanese equity gains in translation, and a BOJ hike on 18 September, priced at about 63%, is the obvious catalyst for that to reverse. Corporate governance reform continues to support the domestic re-rating story, but it is a slow variable against a fast one.
Emerging Markets (MSCI EM ETFs)
MSCI EM at 14.61x is the cheapest major index on the table, a 4.4% premium to its own history and a 41% discount to the S&P 500. The earnings yield of 6.84% is the highest available here. EEM closed Friday 4.01% below its all-time high, 4.4% above its 50-day and 11.3% above its 200-day, so the discount is not the result of a collapse. The offsetting risks are the usual ones: China's index weight, currency exposure that is unhedged in a strong-dollar environment, and this cycle's specific complication that emerging market energy importers are on the wrong side of the Hormuz risk premium.
Overall Risk Score (qualitative, not financial advice): - United States: high valuation risk, low margin of safety. A 46% premium, a negative nominal earnings yield gap and a real risk-free rate of 2.43%. - Europe: moderate. Fair-to-slightly-rich valuations with a genuinely positive real earnings yield gap, offset by an ECB tightening into weakening industrial data. - Japan: moderate. Reasonable valuation, but the outcome is dominated by the yen and BOJ path rather than by earnings. - Emerging markets: attractive relative valuation, with concentrated country and currency risk.
Disclaimer: This is financial information, not personalised investment advice. Past valuations do not guarantee future returns. Consult a financial advisor before investing.
US Economic Indicators (FRED - authoritative)
| Indicator | Current | Prior | Delta | Reference Date | FRED Series |
|---|---|---|---|---|---|
| CPI YoY % | 3.30% | 3.46% | -0.16pp | Jul 2026 | CPIAUCSL |
| Core CPI YoY % | 2.47% | 2.57% | -0.10pp | Jul 2026 | CPILFESL |
| Unemployment Rate | 4.1% | 4.1% | 0.0pp | Aug 2026 | UNRATE |
| Nonfarm Payrolls | +162k | +21k | +141k | Aug 2026 (m/m) | PAYEMS |
| 10Y TIPS Real Yield | 2.43% | 2.42% | +1 bp | 4 Sep 2026 | DFII10 |
Note: FRED macro data is monthly and lags 4 to 6 weeks. July CPI at 3.30% is the most recent print; the August figure lands Friday. The real yield current value is 2.43% (US Treasury real curve, 4 September); the prior is FRED DFII10's own latest observation of 2.42% on 3 September, so the two legs of that row come from feeds a day apart.
The employment row is the one that changed the policy debate. August payrolls at +162k against July's +21k is a sharp rebound from what had looked like a stalling labour market, and it removes the softening-jobs argument against a September hike while unemployment holds at 4.1%.
Other economic releases today (from web search):
| Release | Actual | Consensus | Prior | Reaction |
|---|---|---|---|---|
| Germany industrial production, July (m/m) | -1.1% | +0.2% | 0.0% (revised from +0.2%) | Large miss. Automotive output fell 9.2% on a multi-week production shutdown, capital goods -3.4%, consumer goods -2.2%. Output was 1.6% lower than July 2025 on a calendar-adjusted basis. The less volatile three-month comparison was still +0.4%. The DAX ended the session down 0.19%. |
For context on releases already in hand: euro area manufacturing PMI was 52.7 in August, up from 51.9, with the strongest new-order growth since early 2022, and euro area HICP accelerated to 3.3% in August on energy.
Fixed Income & Bond Analysis
US Treasury yields below come from the US Treasury's own daily par curve feed, dated 4 September, with the 10-year TIPS real yield from Treasury's real curve of the same date. The US bond market was closed today for Labor Day, so the most recent prints available are Friday's and there are no intraday figures to quote. European and Asian yields are from web search.
Policy Rates
| Central Bank | Rate | Source |
|---|---|---|
| Fed Funds (upper) | 3.75% | FRED DFEDTARU (7 Sep) |
| Fed Funds (lower) | 3.50% | FRED DFEDTARL (7 Sep) |
| Effective FFR | 3.63% | FRED DFF (3 Sep) |
| ECB Deposit Rate | 2.25% | FRED ECBDFR (7 Sep) |
| BOJ Policy Rate | 1.00% | web search |
| BOE Bank Rate | ~3.73% | FRED IUDSOIA (SONIA proxy, 3 Sep) |
All four are now priced for tightening rather than easing: the ECB on 10 September (+25 bp to 2.50%, near-consensus), the Fed on 16 September (about 65% implied), and the BOJ on 18 September (about 63% implied).
Government Bond Yields
| Country | 2Y Yield | 10Y Yield | 30Y Yield | Day Chg (10Y) | Source |
|---|---|---|---|---|---|
| USA | 4.37% | 4.78% | 5.24% | +1 bp | US Treasury par curve (4 Sep) |
| Germany | 2.88% | 3.35% | 3.75% | — | ECB YC API (AAA, 4 Sep) |
| France | — | 4.19% | — | — | web (4 Sep) |
| UK | — | 5.15% | — | — | web (4 Sep) |
| Japan | — | 2.91% | — | — | web (7 Sep) |
| Italy | — | 4.15% | — | — | web (4 Sep) |
The USA row is single-dated: all three maturities and the day change share us_curve_date of 4 September, with the change computed against the 3 September par curve (10Y 4.77%). This is a settled figure and does not describe today, when the market was shut. The Germany row uses the ECB AAA-rated euro area curve rather than a Bund-specific quote, which is why it can show all three maturities on one date; a web-sourced Bund 10-year print of 3.36% on the same day corroborates it to within a basis point, and that level was described as just below Wednesday's 15-year high of 3.395%. French, UK, Italian and Japanese 2-year and 30-year yields were not retrieved and are marked accordingly rather than estimated.
Yield Curve Spreads (US Treasury par curve, 4 September, recomputed from the levels above):
- 10Y-2Y spread: +41 bps. Positively sloped but modestly so, well short of the roughly 75 bp that would count as steep. The curve has disinverted and normalised, but the front end is not being priced for cuts.
- 10Y-3M spread: +87 bps. Comfortably positive, which removes the classic recession signal that an inverted 10Y-3M carries. On its own this says the market expects growth to hold up.
Read together, these say something specific: the front end is anchored because the Fed is not expected to cut, and the long end is being pushed up by inflation and supply rather than by growth optimism. The 3-month bill at 3.91% sits 28.5 bp above the current Fed funds target midpoint of 3.625%, which is exactly what you would expect from a market assigning roughly two-thirds probability to a hike inside the bill's life. That is a coherent signal, not a data anomaly.
OAT-Bund Spread: 84.7 bps as of 4 September, down 0.7 bp on the session. France's 10-year OAT at 4.19% is close to multi-decade highs in yield terms. The detail a French investor should notice is the comparison: Italy's 10-year BTP is at 4.15%, roughly 79 bp over the AAA curve. France is now paying more than Italy to borrow for ten years. That inversion of the traditional core-periphery ordering is a slow-burning fiscal story rather than a market event, and it has persisted rather than corrected.
Yield Curve Charts
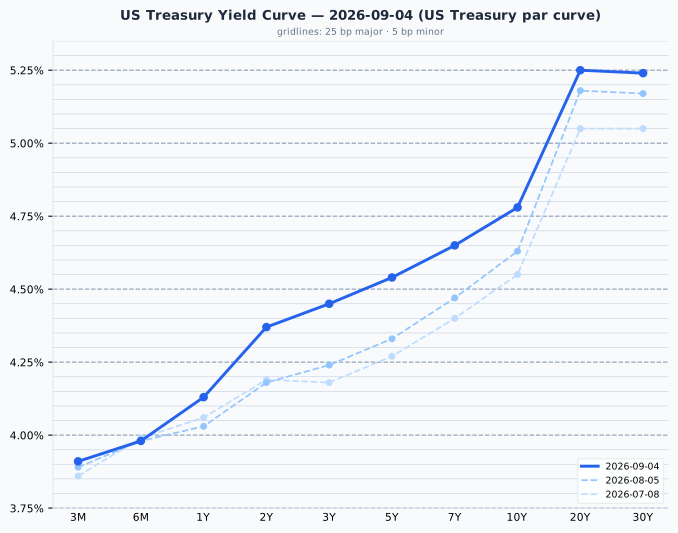
The US curve is positively sloped throughout with a pronounced steepening beyond ten years, rising from 3.91% at three months to 4.78% at ten years and then jumping 47 bp more to 5.25% at twenty, where it flattens and ticks down a basis point into the thirty-year. Against a month ago (5 August), the whole curve has shifted up, but the move is concentrated in the belly: the front end is nearly unchanged (3M +2 bp), the 2-year to 7-year sector is 18 to 21 bp higher (2Y +19 bp, 3Y +21 bp, 5Y +21 bp, 7Y +18 bp), and the move fades out along the long end (10Y +15 bp, 20Y +7 bp, 30Y +7 bp). The net effect is a bear flattening rather than a steepening: 2s10s narrowed from 45 bp to 41 bp and 10s30s from 54 bp to 46 bp over the month. That is the signature of a market repricing the near-term policy path higher, which compresses the belly against a long end that has already absorbed its inflation and supply premium, rather than one reassessing long-run growth.
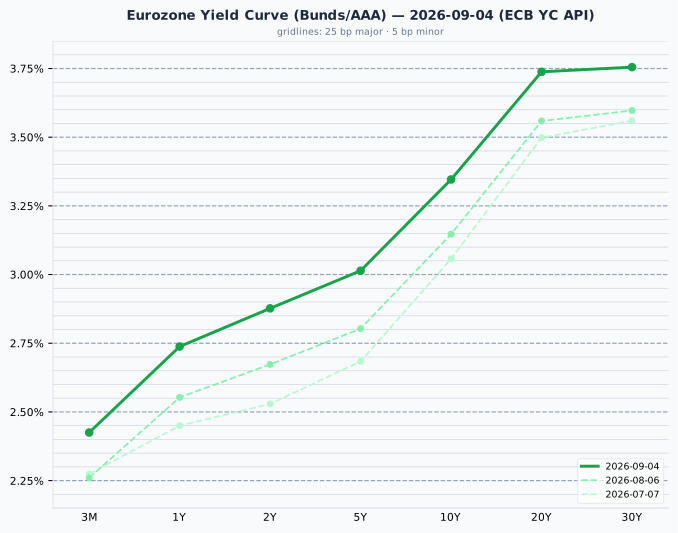
The euro area AAA curve is positively sloped and considerably steeper than the US curve in relative terms, running from 2.42% at three months to 3.35% at ten years and 3.75% at thirty, a 133 bp spread from three months to thirty years. Against a month ago (6 August), the shift is both larger and more uniform than in the US: the 3-month is up 17 bp, the 2-year up 20 bp, the 10-year up 20 bp and the 30-year up 16 bp, which is close to a parallel shift and reflects a market that has moved from expecting the ECB to hold to expecting it to hike.
Credit Markets (from FRED)
| Market | OAS Spread | Series ID |
|---|---|---|
| US Investment Grade | 81 bps | BAMLC0A0CM |
| US High Yield | 265 bps | BAMLH0A0HYM2 |
| Euro High Yield | 265 bps | BAMLHE00EHYIOAS |
All three dated 3 September. US investment grade at 81 bps sits at the very tight edge of its 80 to 150 bp normal range, and US high yield at 265 bps is inside the 300 to 500 bp band that counts as normal, which puts it in historically tight territory rather than merely comfortable. Euro high yield is at the same 265 bps. This is a credit market pricing essentially no default risk premium above the cycle norm, at a moment when the risk-free rate is expected to rise and an energy shock is working through corporate cost bases. Tight spreads of this kind signal complacency at least as readily as they signal strength, and they leave very little cushion: there is far more room for spreads to widen than to compress from here.
Real Yields (US and Euro Area)
| Region | Nominal 10Y | Expected inflation | Real 10Y | How the real yield is obtained |
|---|---|---|---|---|
| United States | 4.78% | 2.35% (residual) | 2.43% | Measured. TIPS trade, so the market quotes a real yield directly; expected inflation is the residual, the breakeven |
| Euro area | 3.35% | 2.04% (measured) | 1.31% | Constructed. No euro inflation-linked benchmark is published, so the ECB SPF long-term HICP expectation is subtracted from the nominal yield |
The two rows are built in opposite directions. The US measures the real yield in the market and infers expected inflation from it; the euro area measures expected inflation in a survey and infers the real yield by subtraction. Only the US figure of 2.43% is a price anyone actually trades, so the euro figure of 1.31% is the softer of the two and should be treated as such. Two mismatches follow from this whenever the pair is compared: the US breakeven of 2.35% includes an inflation risk premium that a survey response does not, and the SPF horizon is five calendar years ahead against the bond's ten.
Decomposing the 143 bp nominal gap between the two 10-year yields: only 31 bp is a difference in expected inflation (2.35% against 2.04%), and 112 bp is a difference in real rates (2.43% against 1.31%). The gap is overwhelmingly a real-rate story, not an inflation story, and the split is worth recomputing each time because it moves with the cycle.
The US to euro real rate gap is not an investment opportunity
The US real yield has exceeded the euro one in every quarter since 2014, averaging about 1.5 pp and never turning negative. That persistence is the proof that it is not capturable: a genuine 112 bp of free real return would have been arbitraged away long ago. It reflects structural features, higher US trend growth, euro area excess savings, Bund scarcity and US fiscal supply, and hedging the currency cancels it almost exactly, because the forward rate is constructed to remove the interest differential. Unhedged, buying Treasuries for the real yield is a bet on the dollar, not a bond decision. A real yield is real in its own currency: 2.43% means 2.43% above US inflation, which is not a real return for anyone who spends euros.
Bond Portfolio Implications
The honest summary is that bonds are the more straightforward proposition right now, at least in the United States. A 10-year Treasury at 4.78% and a 30-year at 5.24% are contractual, and the S&P 500's trailing earnings yield of 4.02% is not, which is what the -0.76 pp earnings yield gap says.
Earnings yield gap: what it is good for, and what it is not
This is the earnings yield gap, not the equity risk premium. The two are different: the equity risk premium is expected total return on equities minus the risk-free rate and requires a forecast of earnings growth, which this measure omits entirely.
What the gap does honestly is compare the income the two instruments offer today, using nothing but quoted prices. No growth forecast, no assumptions. So it tells an investor: right now you can lock a 4.78% Treasury coupon, or accept equity risk at a 4.02% trailing earnings yield. That is a real and useful statement about today's trade-off.
What it cannot do is forecast whether equities will beat bonds. Adding the bond yield to the equity signal empirically makes the equity forecast worse than the earnings yield alone, because the bond leg imports long inflation-driven swings that swamp the signal. Nothing about a negative gap today should be read as a prediction about forward returns.
Two structural biases matter when the number carries weight:
- It ignores growth. A bond coupon is fixed for a decade; the earnings behind the equity yield grow roughly with inflation. Quoting the real-yield version corrects for this: 4.02% against DFII10 at 2.43% gives +1.59 pp. The interesting part is the size of that correction, 2.35 pp, which is large enough to flip the sign of the gap. When a correction exceeds the quantity being corrected, the uncorrected version should not be quoted alone.
- An equity holder does not receive the full earnings yield. Only the dividend and buyback portion arrives as cash; the rest is retained and reinvested at whatever return management can achieve.
Cross-country comparison needs the same care. The euro gaps of +2.23 pp nominal and +4.27 pp real look better than the US on both bases, and the real-basis version is the one to lean on, since it strips out the inflation and policy-path difference between the currencies. For a forward-looking valuation argument, earnings yield against its own history carries predictive power where the gap does not.
Duration risk. With the 10-year at 4.78%, a further 100 bp rise costs roughly 8% to 9% in price on a 10-year bond, and considerably more at the long end where the 30-year sits at 5.24%. That is the live risk in this environment, because the direction of policy surprise has flipped: six months ago the tail risk for a bond holder was a hawkish surprise against an easing base case, and now the base case is tightening, with an oil shock behind it that no central bank controls. Short duration is compensated at 4.37% for two years with far less convexity risk, and the 41 bp pickup for extending from two years to ten is thin payment for eight extra years of exposure. The steepness beyond ten years, 47 bp from the 10-year to the 20-year, is where the term premium has actually rebuilt, but it is also where a further inflation repricing would hurt most.
Currencies & Commodities
Currencies:
| Pair | Rate | Source |
|---|---|---|
| EUR/USD | 1.1598 | FRED DEXUSEU (28 Aug) |
| USD Index | 118.75 | FRED DTWEXBGS (28 Aug) |
| USD/JPY | 159.36 | web search (7 Sep) |
| GBP/USD | 1.3522 | web search (4 Sep) |
| USD/CHF | 0.8088 | web search (7 Sep) |
The two FRED series are ten days stale (28 August is the latest published observation), so treat EUR/USD and the broad dollar index as reference levels rather than current quotes. The USD/JPY figure is today's, against a previous close of 159.18.
The yen at 159.36 is the pair to watch. It is weak enough that a BOJ hike on 18 September has a real chance of producing a disorderly reversal, and it is weak despite the BOJ having already reached a 31-year-high policy rate, which tells you how much the differential against a possibly-hiking Fed still dominates. The Swiss franc at 0.8088 per dollar continues to trade with its usual haven bid, unsurprising with the Hormuz situation escalating.
Commodities (all front-month futures):
| Commodity | Price † | Day Chg % | Ticker | Source |
|---|---|---|---|---|
| Brent Crude | 96.28 | — | BZ=F | yfinance |
| WTI Crude | 91.48 | — | CL=F | yfinance |
| Gold ($/oz) | 4,476.60 | — | GC=F | yfinance |
| Silver ($/oz) | 66.748 | — | SI=F | yfinance |
| Copper ($/lb) | 6.6825 | — | HG=F | yfinance |
| Nat Gas ($/MMBtu) | 2.975 | — | NG=F | yfinance |
† All six prices are the 4 September settlements. The US futures complex has no settlement today because of the Labor Day holiday: every contract shows a last-trade value identical to Friday's settlement, so the day change is not a measurement of anything and has been suppressed rather than printed as 0.00%. News reports indicate crude extended its gains today on the Hormuz escalation; that move is not reflected in this table.
Contract months in use are CLV26.NYM (WTI, October), BZX26.NYM (Brent, November), GCZ26.CMX and SIZ26.CMX (gold and silver, December), HGZ26.CMX (copper, December) and NGV26.NYM (natural gas, October). None is close enough to expiry to warrant a roll warning.
On levels, with the age of each record taken into account:
- Gold at $4,476.60 is 19.9% below its all-time high of $5,586.20, set on 29 January 2026, which is also its 52-week high. The 52-week low is $3,590.00. That is a substantial drawdown from a recent peak, and it is worth stating plainly because gold is often described as being at records when it is not.
- Silver at $66.748 is 45.0% below its all-time high of $121.30, also set on 29 January 2026, against a 52-week low of $40.878. Silver's peak-to-present decline is more than twice gold's, which is its usual behaviour: it moves further in both directions.
- Copper at $6.6825 is at all-time highs, 1.0% below a record of $6.75 set on 26 August 2026, less than two weeks ago. This is the one commodity here genuinely at a record, and it is the industrial metal, which is worth pausing on given the growth signals elsewhere.
- Brent at $96.28 trades in a 52-week range of $58.72 to $126.10, in the upper half but well below the highs reached earlier in this conflict. WTI at $91.48 sits in a 52-week range of $54.98 to $119.48. Both contracts' record prints date from July 2008 and belong to a differently structured market, so no drawdown framing is applied to them.
- Natural gas at $2.975 is near the bottom of a 52-week range of $2.483 to $7.827. Its record dates from December 2005 and carries no information about today's market.
Crypto: Bitcoin traded around $79,350 and Ethereum around $2,498 this morning, both moving less than 2% on the day, below the threshold that would make them worth reporting in detail.
Sector & Theme Highlights
Semiconductors and AI dominated the session and were essentially the entire story of the Asian rally. SK Hynix +8.26%, Samsung +5.68%, SoftBank +11.22% and Advantest +4.20% carried the Kospi and Nikkei almost single-handedly, following Friday's strength in US chipmakers. The concentration is the point: two national indices moved 2% to 5% on the performance of a handful of names in one supply chain.
Energy and the Hormuz risk premium is the theme with the broadest reach. It is no longer just an oil story: it is now the proximate cause of euro area inflation at 3.3%, of a probable ECB hike on Thursday, and of a repricing of the Fed toward tightening. An energy shock that transmits into three central bank reaction functions inside a month is a macro event, not a sector event.
European autos were the day's clear laggard theme in the data if not in the tape. German industrial production fell 1.1% in July almost entirely because automotive output dropped 9.2% on a multi-week production shutdown. Whether that reverses in August is the question that determines how much of the German industrial weakness is genuine.
Industrial metals versus precious metals is an unusual divergence to note. Copper is at an all-time high while gold sits 20% and silver 45% below records set in January. If the copper signal is about physical demand and electrification, it argues against the growth pessimism implied elsewhere; if it is about supply constraint, it says less. The two metals are telling different stories and the resolution matters for the reflation trade.
Top Stories (Global)
-
The US struck three Iranian oil tankers over the weekend, in retaliation for ballistic missile attacks on US Navy warships, and Tehran has responded by attacking US-linked vessels and signalling a "restricted" maritime zone beyond the Strait of Hormuz. Crude extended gains on Monday after rising 7.8% (Brent) and nearly 10% (WTI) last week.
-
Asian chip stocks staged a sharp rally, taking the Kospi up 4.61% to 6,995.39 and the Nikkei 225 up 2.12% to 66,399.84. SK Hynix gained 8.26% and Samsung 5.68% in Seoul; SoftBank rose 11.22% and Advantest 4.20% in Tokyo.
-
German industrial production fell 1.1% in July, against a +0.2% consensus, the biggest monthly drop in almost a year. Automotive output fell 9.2% on a production shutdown, and June was revised down to flat from +0.2%.
-
The ECB is widely expected to raise its deposit rate 25 bp to 2.50% on Thursday 10 September, after euro area HICP accelerated to 3.3% in August on energy prices tied to the Middle East conflict. Euro area AAA yields are at 15-year highs.
-
Markets price roughly a 65% chance of a Fed hike on 16 September. Chair Warsh has said underlying inflation has not "meaningfully improved"; the July FOMC held 9 to 3 with three dissents in favour of hiking. August payrolls at +162k, well above July's +21k, removed the labour-market argument against moving.
-
The Bank of Japan is priced at about 63% for a 25 bp hike on 18 September, which would take the policy rate above the 1.00% level reached in June, itself a 31-year high. The yen at 159.36 gives the decision unusual weight.
-
France now borrows more expensively than Italy at ten years. The OAT yields 4.19% against the BTP's 4.15%, with the OAT-Bund spread at 84.7 bp, and French borrowing costs are near multi-decade highs.
Looking Ahead
Central banks - Thursday 10 September: ECB Governing Council monetary policy decision and press conference. Consensus expects +25 bp to a 2.50% deposit rate; the guidance on whether a further hike follows this year is the live question. - Tuesday to Wednesday 15-16 September: FOMC meeting, decision Wednesday 16 September at 2:00pm ET, accompanied by the Summary of Economic Projections and dot plot. About 65% implied probability of +25 bp. - Friday 18 September: Bank of Japan Monetary Policy Meeting concludes. About 63% implied probability of +25 bp from 1.00%.
Economic releases - Tuesday 8 September: US NFIB small business optimism, US consumer inflation expectations. - Thursday 10 September: German final CPI for August, alongside the ECB decision. - Friday 11 September: US CPI for August, 8:30am ET. Consensus is +0.4% m/m and 3.4% y/y headline (from 0.1% m/m and 3.3% y/y), with core at +0.2% m/m and 2.4% y/y. Coming five days before the FOMC, this is the most consequential number of the week.
Market closures (Nager.Date public holiday data) - No closures in the next five trading days in any of the tracked markets. The next are Japan on Monday 21 September (Respect for the Aged Day) and Wednesday 23 September (Autumnal Equinox Day), followed by Korea for Chuseok on 24, 25 and 26 September, Canada on 30 September, and Germany on 3 October. - Note that Indian holiday data is unavailable for 2026, so Indian closures cannot be confirmed here.
What to watch The week's asymmetry is unusual. Three central bank decisions and a US CPI print all land inside twelve days, all of them pointing the same direction, into a credit market at 265 bp and a VIX at 14.32. Equity and credit are priced for none of it to matter. The rates market has already moved; the risk assets have not.