2026 08 27
Global Financial Briefing — Thursday, 27 August 2026
Americas index levels, commodities and day changes reflect the 27 August closing print; US Treasury figures, the curve spreads, the real yields and the US yield curve chart use Treasury's settled 27 August par curve. Euro area bond rows, the ECB curve chart, FX and macro figures are dated inline.
Market Overview
Today split cleanly along a single fault line: American technology earnings against European fiscal politics. Nvidia's fiscal Q2 beat, and guidance pointing to roughly 70% revenue growth next fiscal year, lifted the entire AI complex, carrying the Nasdaq 100 up 1.43% and the S&P 500 up 0.72% at the close. Salesforce (about +23%) and CrowdStrike (about +20.5%) broadened the bid beyond semiconductors, and AI infrastructure names such as Micron, Marvell, SanDisk, Palo Alto and GE Vernova added between 3% and 6%. The Dow, with less technology weight, managed only +0.20%, and that dispersion is the day's clearest signal: this was a sector move, not a market move. The Special Analysis section below puts a number on it: these three stocks contributed more than the whole of the S&P 500's gain, which leaves the other 502 companies collectively negative on the day. Both software names accelerated through the afternoon: Salesforce and CrowdStrike roughly doubled their midday gains into the bell.
Europe went the other way, and France went furthest. The CAC 40 fell 1.68%, by far the worst performance among major indices, with investors positioning ahead of Fitch's scheduled review of France on 28 August against an unresolved budget and a presidential cycle already pulling attention away from fiscal repair. The divergence within Europe is the striking part: the DAX actually rose 0.31% on the same session, so this is a French risk premium being repriced rather than a European growth scare. The STOXX 600 lost 0.69%, the FTSE 100 0.79% and the Swiss SMI 1.09%. Confirming the same story from the bond side, the 10-year BTP-OAT spread was reported near 5.5 bp today, among the narrowest in two decades, and the narrowing came from French bonds cheapening rather than Italian bonds richening. France is losing the yield advantage over Italy that it held for a generation.
The 10-year Treasury settled at 4.67% and the 30-year at 5.19%, both up 1 bp, so the long end did nothing at all while equities rallied. That matters: with the discount rate unmoved, the whole of the day's index move came from expected cash flows in one sector, which is why the Nasdaq-Dow dispersion is the number to read rather than either index on its own. Asia was mixed and mostly small: the Kospi gained 1.53% and Shanghai 1.13%, while the Nikkei slipped 0.20%, the ASX 200 0.98% and the Hang Seng 0.34%. The VIX at 15.21 sits at the low end of the moderate band, consistent with a market absorbing good news rather than one repricing risk.
Global Indices Snapshot
Americas
| Index | Level | Day Chg | Day Chg % | Source |
|---|---|---|---|---|
| S&P 500 | 7,730.99 | +55.29 | +0.72% | yfinance ^GSPC |
| Nasdaq 100 | 29,641.56 | +417.04 | +1.43% | yfinance ^NDX |
| Dow Jones | 53,569.44 | +105.56 | +0.20% | yfinance ^DJI |
| Brazil IBOV | 175,135.40 | +549.14 | +0.31% | yfinance ^BVSP |
Americas data reflects the 27 Aug close. The S&P 500 close is confirmed against FRED SP500 (7,730.99, 2026-08-27).
Europe
| Index | Level | Day Chg | Day Chg % | Source |
|---|---|---|---|---|
| Euro STOXX 600 | 651.85 | -4.56 | -0.69% | yfinance ^STOXX |
| Euro STOXX 50 | 6,424.73 | -46.01 | -0.71% | yfinance ^STOXX50E |
| CAC 40 | 8,319.87 | -142.52 | -1.68% | yfinance ^FCHI |
| DAX | 26,367.24 | +81.28 | +0.31% | yfinance ^GDAXI |
| FTSE 100 | 10,792.54 | -85.58 | -0.79% | yfinance ^FTSE |
| SMI (Swiss) | 14,384.37 | -158.53 | -1.09% | yfinance ^SSMI |
European data reflects today's close (27 Aug).
Asia-Pacific
| Index | Level | Day Chg | Day Chg % | Source |
|---|---|---|---|---|
| Nikkei 225 | 66,131.98 | -130.18 | -0.20% | yfinance ^N225 |
| Hang Seng | 25,565.74 | -87.23 | -0.34% | yfinance ^HSI |
| Shanghai Comp | 3,956.57 | +44.05 | +1.13% | yfinance 000001.SS |
| ASX 200 | 9,038.20 | -89.60 | -0.98% | yfinance ^AXJO |
| Kospi (Korea) | 6,912.37 | +104.16 | +1.53% | yfinance ^KS11 |
Asia-Pacific data reflects today's close (27 Aug).
Emerging Markets
| Index | Level | Day Chg % | Source |
|---|---|---|---|
| MSCI EM (EEM) | 67.61 | +0.66% | yfinance EEM |
| India Nifty 50 | 24,090.85 | -0.48% | yfinance ^NSEI |
| South Africa | 71.56 | -0.17% | yfinance EZA |
EEM and EZA are US-listed ETFs and reflect the 27 Aug close; the Nifty 50 reflects the Indian close. EZA reversed into the bell, closing 0.17% lower after trading 0.14% higher at midday.
Index Valuations & Investment Risk
Valuation Table
| Index | Trailing P/E (live) | Hist avg trailing P/E (†) | Premium to hist avg midpoint |
|---|---|---|---|
| S&P 500 | 26.00x | ~16-18x | +53.0% |
| Nasdaq 100 | 30.78x | ~25-30x | +11.9% |
| Euro STOXX 600 | 17.98x | ~15-17x | +12.4% |
| CAC 40 | 17.06x | ~14-16x | +13.7% |
| DAX | 19.08x | ~15-17x | +19.2% |
| FTSE 100 | 18.15x | ~13-15x | +29.7% |
| Nikkei 225 | 22.26x | ~20-22x | +6.0% |
| MSCI EM | 17.52x | ~13-15x | +25.1% |
(†) Hist avg trailing P/E: static long-run reference constants. Live trailing P/E from Yahoo Finance on ETF proxies (SPY, QQQ, EXSA.DE, CAC.PA, EXS1.DE, ISF.L, 1321.T, EEM). Bold marks a premium above 20%.
The headline is that the S&P 500 at 26.00x trailing sits 53% above the midpoint of its long-run range, which is past the 40% threshold that counts as historically stretched. The Nasdaq 100, at 30.78x, is only 11.9% above its own (much higher) historical band, so the concentration problem in US equities is better described as the broad index having re-rated toward technology multiples than as technology itself being at an extreme.
Investment Risk Assessment for ETF Investors
United States (S&P 500 / Nasdaq ETFs)
Earnings yield on the S&P 500 is (1÷26.00) = 3.85%, against a 10-year Treasury at 4.67%. The earnings yield gap is therefore -0.82 pp: bonds currently offer more contractual income than equities offer in earnings. Measured against the real yield instead, which is the cleaner statement of the trade-off because equity earnings grow roughly with inflation while a coupon does not, the gap is (3.85% − 2.34%) = +1.51 pp. The correction is 2.33 pp, large enough to flip the sign, and that magnitude is the point worth carrying away rather than either number on its own.
This describes today's trade-off and nothing else. It is not a forecast of whether equities will beat bonds, and it should not be read as one. Note also that an equity holder does not actually receive 3.85%; only the dividend and buyback portion arrives as cash, and the remainder is retained by the company.
The index closed 1.1% below its 52-week high of 7,816.70, above both its 50-day (7,557.96) and 200-day (7,114.32) averages, so the technical picture is intact. The risks are the familiar ones: concentration in a handful of AI-levered names, and sensitivity to the real yield, which at 2.34% remains historically high and caps how far multiples can expand. Today's session is a live demonstration of the first, and the Special Analysis section below measures it: 8.2% of the index by weight delivered more than 100% of its gain.
Europe (STOXX 600 / CAC 40 / DAX ETFs)
The STOXX 600 earnings yield is (1÷17.98) = 5.56% against a euro AAA 10-year of 3.25%, a euro earnings yield gap of +2.31 pp, and +4.35 pp against the euro real yield of 1.21%. Both are substantially wider than the US equivalents, and European indices trade at 12% to 19% premiums to their own history rather than 53%.
That comparison needs a caveat, though. Part of the difference between a US gap of -0.82 pp and a euro gap of +2.31 pp is simply the gap between US and euro-area inflation and policy paths, not a difference in risk compensation. The real-yield versions (+1.51 pp US, +4.35 pp euro) narrow the distance but do not close it, so a genuine valuation advantage for Europe survives the correction. See the Real Yields section for how differently the two real yields are constructed.
The France-specific risk is live rather than theoretical today. The CAC 40 has now fallen below its 50-day average (8,466.40) and sits only 1.1% above its 200-day (8,227.44), with Fitch's review tomorrow and a budget still unresolved. A euro investor in a CAC 40 or STOXX 600 ETF holds a EUR-quoted fund, so there is no FX effect on the quoted value of the holding, but there is still real currency exposure inside the earnings: these are multinationals earning substantially abroad. The exposure is smaller, slower and partly hedged by foreign cost bases, not absent.
Japan (Nikkei / TOPIX ETFs)
At 22.26x the Nikkei is only 6% above its historical band, the least stretched major market in the table. The dominant variable is policy: the BOJ is at 1.00% after June's hike, the 10-year JGB is near 2.88% at multi-decade highs, and markets price roughly 80% odds of a further hike on 18 September. For a euro-based investor the currency decision is likely to matter more than the equity call, since a tightening BOJ and a yen near 159 to the dollar cut both ways depending on whether the holding is hedged.
Emerging Markets (MSCI EM ETFs)
At 17.52x, MSCI EM no longer carries its traditional discount to developed markets; it is 25% above its own long-run range and trades close to European multiples. The historic case for EM as the cheap allocation has weakened considerably on this measure. China weight remains the swing factor, and Shanghai's 1.13% gain today sits against an index still below its 200-day average.
Overall Risk Score (qualitative, not financial advice): - United States: high valuation risk, low margin of safety. 53% premium to history and a negative nominal earnings yield gap. - Europe: moderate, with a specific French political overlay. Better relative valuation, wider earnings yield gap, but a live sovereign event tomorrow. - Japan: moderate. Least stretched multiple, offset by policy and currency uncertainty. - Emerging Markets: moderate. The valuation discount that justified the allocation has largely gone.
Disclaimer: This is financial information, not personalised investment advice. Past valuations do not guarantee future returns. Consult a financial advisor before investing.
US Economic Indicators (FRED - authoritative)
| Indicator | Current | Prior | Delta | Reference Date | FRED Series |
|---|---|---|---|---|---|
| CPI YoY % | 3.30% | 3.46% | -0.16 pp | Jul 2026 | CPIAUCSL |
| Core CPI YoY % | 2.47% | 2.57% | -0.10 pp | Jul 2026 | CPILFESL |
| Unemployment Rate | 4.1% | 4.2% | -0.1 pp | Jul 2026 | UNRATE |
| Nonfarm Payrolls | -23k | +20k | -43k | Jul 2026 (m/m) | PAYEMS |
| 10Y TIPS Real Yield | 2.34% | 2.34% | 0 bp | 27 Aug / 26 Aug | DFII10 |
Note: FRED macro data is monthly and typically lags four to six weeks. The real yield row is daily, and both legs now come from the US Treasury real curve: current is 2.34% (2026-08-27) against 2.34% (2026-08-26), so the real yield was unchanged on the day.
The labour market is the softening story here. Payrolls turned negative in July at -23k after +20k in June and +63k in May, a clear three-month deceleration, even as the unemployment rate ticked down to 4.1%. Headline CPI at 3.30% is falling but remains well above target, and core at 2.47% is closer to it. That combination, a cooling labour market with inflation not yet at target, is precisely the tension the Fed is navigating with the target range still at 3.50% to 3.75%.
Other economic releases: July PCE, released 26 August, held at 3.7% year on year with core at roughly 3.3% (web), so the Fed's preferred gauge is running a good deal hotter than the 3.30% CPI headline in the table above and has stopped falling. Initial jobless claims reported on 27 August came in at 228k against 232k the week before (web), a labour market still tight on the claims measure even as payrolls contract. German GfK consumer confidence for September was due this week; no print was retrieved.
Fixed Income & Bond Analysis
Policy Rates
| Central Bank | Rate | Source |
|---|---|---|
| Fed Funds (upper) | 3.75% | FRED DFEDTARU (2026-08-27) |
| Fed Funds (lower) | 3.50% | FRED DFEDTARL (2026-08-27) |
| Effective FFR | 3.63% | FRED DFF (2026-08-25) |
| ECB Deposit Rate | 2.25% | FRED ECBDFR (2026-08-27) |
| BOJ Policy Rate | 1.00% | web search (hiked +25 bp June 2026) |
| BOE Bank Rate | ~3.73% | FRED IUDSOIA (SONIA proxy, 2026-08-25) |
Government Bond Yields
| Country | 2Y Yield | 10Y Yield | 30Y Yield | Day Chg (10Y) | Source |
|---|---|---|---|---|---|
| USA | 4.20% | 4.67% | 5.19% | +1.0 bp | US Treasury par curve (2026-08-27) |
| Germany | 2.76% | 3.25% | 3.70% | — | ECB AAA curve (2026-08-26) |
| France | — | 4.08% ‡ | — | — | web (2026-08-21) |
| UK | — | 5.03% | — | — | web (2026-08-27) |
| Japan | — | 2.88% | — | — | web (2026-08-27) |
| Italy | — | — | — | — | web (no firm level retrieved) |
The USA row is the settled Treasury par curve for 27 Aug; the day change compares it to the 26 Aug curve from the same feed. Germany is the ECB AAA euro area curve used as the Bund proxy, which is a composite rather than the Bund itself.
‡ The French 10-year is stale by several sessions and predates today's selloff; the current level is very likely higher. Treat it as a floor, not a quote.
The UK is the outlier in this table: a 10-year gilt above 5% is 37 bp over the equivalent Treasury and near a 14-month high, which is a remarkable place for a G7 curve to sit. Japan at 2.88% is at multi-decade highs and is the quiet structural story of the year, since a JGB yielding close to 3% changes the arithmetic for the Japanese institutions that have been the marginal buyer of foreign long bonds for two decades.
On France: a firm 10-year level for today was not retrievable, but the reported BTP-OAT spread of roughly 5.5 bp is the more informative number in any case. France borrowing at essentially Italy's cost is a repricing of a relationship that held for twenty years, and it happened through French yields rising rather than Italian yields falling.
Yield Curve Spreads: - 10Y-2Y spread: +47 bp (US Treasury par curve, 2026-08-27). Positively sloped and clearly not inverted, but below the roughly 75 bp that would count as steep. The curve has normalised without yet becoming expansionary in shape. - 10Y-3M spread: +83 bp (US Treasury par curve, 2026-08-27). Comfortably positive, so the classic recession signal is not flashing. This spread inverted through much of 2023 and 2024, and its return to a healthy positive reading reflects front-end easing rather than long-end rallying.
OAT-Bund Spread: 83.6 bp as of 21 August (web), against a longer-run post-2024 norm of around 70 bp and roughly 50 bp before the 2024 dissolution. Given today's move in French equities and the BTP-OAT convergence, this figure almost certainly understates the current spread.
Yield Curve Charts
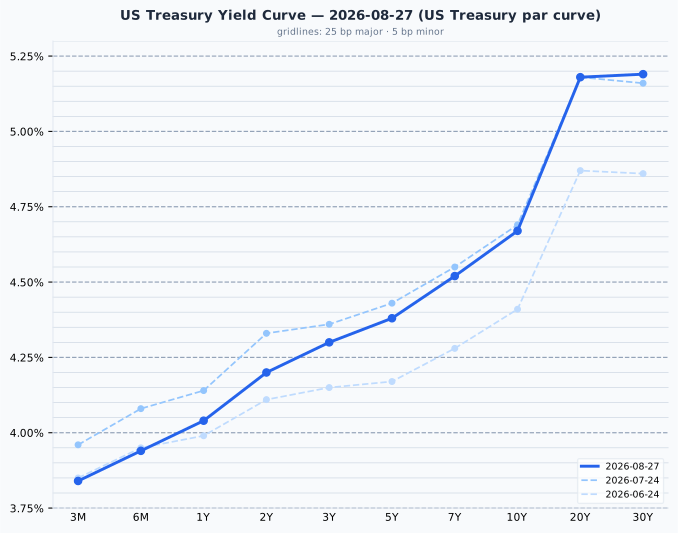
The US curve is upward sloping across its whole length with a pronounced steepening beyond 10 years: the 30-year at 5.19% sits 52 bp above the 10-year, which is where the fiscal supply concern shows up most clearly. Against a month ago (24 July), the front end has fallen (3M down 12 bp, 2Y down 13 bp) while the long end is unchanged to slightly higher, so the past month has been a bull steepening driven entirely by the short end.
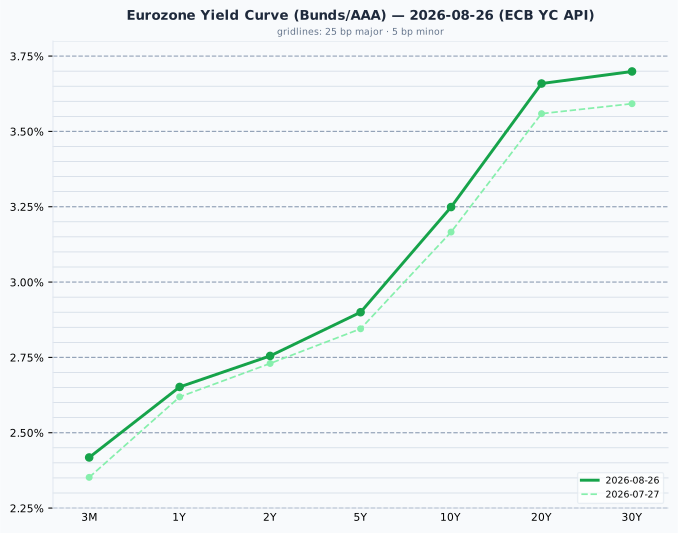
The euro AAA curve is smoothly upward sloping from 2.42% at 3 months to 3.70% at 30 years, a 128 bp span that is considerably flatter than the US equivalent's 135 bp over a much lower base. Against 27 July the whole curve has shifted up, and the shift grows with maturity (10Y up 8 bp, 20Y up 10 bp, 30Y up 11 bp), so Europe has had a modest bear steepening over the past month while the US had a bull steepening. The two long ends are moving for the same reason even as the front ends diverge.
Credit Markets (from FRED - authoritative)
| Market | OAS Spread | Series ID |
|---|---|---|
| US Investment Grade | 80 bps | BAMLC0A0CM |
| US High Yield | 267 bps | BAMLH0A0HYM2 |
| Euro High Yield | 258 bps | BAMLHE00EHYIOAS |
All three observations are dated 2026-08-26. Every one of these is at or below the bottom of its normal range: US IG at 80 bp sits exactly at the floor of the 80 to 150 bp band, and US high yield at 267 bp is below the 300 to 500 bp normal range, which puts it in historically tight territory. Euro high yield at 258 bp is tighter still than its US counterpart, which is unusual.
The interpretation is worth stating carefully. Tight spreads mean credit markets see no stress, and that is genuinely reassuring about near-term default expectations. But spreads this compressed also mean investors are being paid very little to bear credit risk, so the asymmetry is poor: there is far more room to widen than to tighten. Note the contrast with the equity market's own signal, where the VIX at 15.21 says much the same thing. Neither market is pricing much that could go wrong.
Real Yields (US and Euro Area)
| Region | Nominal 10Y | Expected inflation | Real 10Y | How the real yield is obtained |
|---|---|---|---|---|
| United States | 4.67% | 2.33% (residual) | 2.34% | Measured. TIPS trade, so the market quotes a real yield directly; expected inflation is the residual (the breakeven) |
| Euro area | 3.25% | 2.04% (measured) | 1.21% | Constructed. No euro inflation-linked benchmark is published, so a survey expectation is subtracted from the nominal yield |
US figures are the Treasury par and real curves for 2026-08-27; the euro nominal is the ECB AAA curve for 2026-08-26 and the expectation is the ECB Survey of Professional Forecasters long-term HICP point forecast for 2026 Q3 (2.037%).
The two rows are built in opposite directions, and only the US real yield is something anyone actually trades. The euro figure is the softer of the two and should be treated as such. Two mismatches follow from that: the US breakeven carries an inflation risk premium that a survey does not, and the SPF horizon is five years against the bond's ten.
Decomposing the 142 bp nominal gap between the two regions: only 29 bp is a difference in expected inflation (2.33% against 2.04%), while 113 bp is a difference in real rates (2.34% against 1.21%). This is overwhelmingly a real-rate story, not an inflation story, and anyone attributing the transatlantic yield gap to US inflation is misreading it by a factor of four.
On the US-euro real rate gap
That 113 bp real gap is a structural feature reflecting higher US trend growth, euro-area excess savings, Bund scarcity and US fiscal supply. It is not a trade a euro-based reader can capture. Hedging the currency cancels it almost exactly, because the forward rate is set precisely to remove the interest differential; unhedged, it is a currency bet rather than a bond decision. A real yield is real in its own currency, so 2.34% means 2.34% above US inflation, which is not a real return for someone who spends euros. The gap is best read as a descriptive macro fact about relative policy stance and growth expectations, with no portfolio conclusion drawn from it.
Bond Portfolio Implications
The core question is whether yields are now high enough to compete with equities, and for a dollar investor the honest answer today is yes on current income. A 10-year Treasury at 4.67% pays more than the S&P 500's 3.85% earnings yield, and it pays it contractually rather than as an accounting figure that is mostly retained by companies rather than distributed. Corrected to a real basis the comparison reverses (+1.51 pp for equities), which is the more appropriate framing over a long horizon, but the nominal picture explains why bonds have been competing successfully for allocation.
For a euro investor the calculus differs. The euro earnings yield gap of +2.31 pp nominal and +4.35 pp real means European equities still offer a clear yield advantage over euro AAA paper at 3.25%, so the equity-versus-bond call is far less finely balanced in Europe than in the US.
On duration: a 100 bp rise in yields implies roughly an 8% to 9% price loss on a 10-year bond, and more at the long end where the US 30-year at 5.19% carries duration near 15. That long-end steepness is the risk to respect. The front end is where the reward-to-risk is better: a 2-year at 4.20% captures most of the yield with a fraction of the duration, giving up only 47 bp against the 10-year for far less price sensitivity. In a curve this shallow, extending duration is poorly compensated.
Currencies & Commodities
Currencies:
| Pair | Rate | Source |
|---|---|---|
| EUR/USD | 1.1684 | FRED DEXUSEU (2026-08-21) |
| USD Index | 118.06 | FRED DTWEXBGS (2026-08-21) |
| USD/JPY | ~159.20 | web search (approx. 22-23 Aug) |
| GBP/USD | ~1.3650 | web search (approx. 22-23 Aug) |
| USD/CHF | ~0.8013 | web search (approx. 22-23 Aug) |
All currency figures are stale by several sessions. FRED's daily FX series lag by a few business days, and no 27 August print was retrievable for the non-euro pairs. Treat these as reference levels rather than today's quotes.
Commodities (front-month futures):
| Commodity | Price | Day Chg % | Ticker | Source |
|---|---|---|---|---|
| Brent Crude | 88.52 | +1.82% | BZ=F | yfinance |
| WTI Crude | 83.53 | +1.58% | CL=F | yfinance |
| Gold ($/oz) | 4,664.00 | +0.23% | GC=F | yfinance |
| Silver ($/oz) | 70.24 | +2.06% | SI=F | yfinance |
| Copper ($/lb) | 6.689 | -0.19% | HG=F | yfinance |
| Nat Gas ($/MMBtu) | 2.914 | +1.39% | NG=F | yfinance |
Prices are the 27 Aug settlements, and day changes are settlement to settlement against 26 Aug. No contract rolled between the two sessions.
Silver was the day's standout at +2.06%, though it remains 42.1% below its all-time high of $121.30 set on 29 January 2026, within a 52-week range of $38.68 to $121.30. Gold settled at $4,664.00 for a 0.23% gain and is 16.5% below its own all-time high of $5,586.20, also set on 29 January 2026. Both metals are therefore well off the January spike rather than near it, and the gap between silver's 42% drawdown and gold's 16% is the more interesting fact: the gold-silver ratio has widened sharply since January, and silver's higher beta has cut both ways.
Copper is the exception. At $6.689 per pound it is 0.9% below its all-time high of $6.75, set yesterday (26 August), so copper is genuinely at all-time highs despite today's small 0.19% dip. That is a notable divergence from the precious metals and speaks to industrial and electrification demand rather than a monetary bid.
Crude firmed decisively on both benchmarks, and by more than the midday quotes suggested: Brent settled at $88.52 (+1.82%) inside a 52-week range of $58.72 to $126.10, and WTI at $83.53 (+1.58%) within $54.98 to $119.48, so both sit in the middle of their yearly ranges. Natural gas rose 1.39% to $2.914 but remains close to the bottom of its 52-week range of $2.483 to $7.827.
One mechanical note: Brent's generic contract has already rolled to BZX26 (November), though the reported expiry field still points at the previous contract, so no imminent roll discontinuity is expected in the Brent quote. WTI's generic is on CLV26 (October), expiring 22 September.
Crypto: no confirmed crypto moves today; omitted.
Sector & Theme Highlights
AI and semiconductors dominated everything else. Nvidia's results and its guidance to roughly 70% revenue growth next fiscal year did not merely lift Nvidia; the read-through ran through Micron, Marvell, SanDisk, Palo Alto and GE Vernova, all up 3% to 6%. The inclusion of GE Vernova is the tell: the AI trade has extended into the power generation and grid equipment needed to run the data centres, which is a meaningfully different exposure from chip design.
Enterprise software rejoined the trade. Salesforce's 23% gain and CrowdStrike's 20.5% matter because software had lagged semiconductors for much of the year. Two large beats on the same day suggest the AI capital cycle is beginning to show up in application-layer revenue rather than only in infrastructure spending.
European sovereign risk is idiosyncratic, not systemic. The CAC 40 down 1.68% against a DAX up 0.31% on the same session is about as clean a separation as markets produce. Euro high yield at 258 bp shows no contagion into credit. This is a French fiscal story, being priced in French assets.
The long end is a global theme. US 30-year at 5.19%, UK 10-year above 5%, JGB 10-year near 2.88% at multi-decade highs, and a euro curve that bear-steepened over the past month. Different causes in each jurisdiction, but the common thread is that long-dated government debt is repricing for supply in a way that front ends are not.
Top Stories (Global)
- Nvidia beat on fiscal Q2 and guided to roughly 70% revenue growth next fiscal year, closing about 9% higher and driving the Nasdaq 100 to a 1.43% gain against the Dow's 0.20%. This was the single dominant market event of the day.
- Salesforce closed about 23% higher and CrowdStrike about 20.5% on their own results, broadening the technology bid beyond semiconductors into enterprise software. Salesforce also announced an integration with Anthropic's Claude models alongside raised full-year guidance.
- French assets sold off ahead of Fitch's scheduled review of France on 28 August, with the CAC 40 falling 1.68%, the worst performance among major global indices, against an unresolved budget and a presidential cycle absorbing political attention.
- The 10-year BTP-OAT spread was reported near 5.5 bp, among the narrowest in two decades, with the convergence driven by French bonds cheapening rather than Italian bonds richening. France is losing a yield advantage over Italy that held for a generation.
- The UK 10-year gilt held around 5.03%, near a 14-month high and 37 bp above the equivalent Treasury, leaving gilts as the highest-yielding major developed-market curve.
- The 10-year JGB sits near 2.88%, at multi-decade highs, with roughly 80% odds priced for a BOJ hike at the 18 September meeting after June's move to 1.00%.
- US payrolls contracted by 23k in July after +20k in June and +63k in May, a three-month deceleration that sits awkwardly against headline CPI still at 3.30%.
- July PCE held at 3.7% year on year with core near 3.3%, released 26 August, leaving the Fed's preferred inflation gauge stalled well above target while the labour market cools.
Looking Ahead
Next 1-5 trading days:
- Friday 28 August: Fitch review of France. The most immediate scheduled risk event, and the one today's CAC 40 move was positioning for. A downgrade or negative outlook change would likely widen the OAT-Bund spread further from its already elevated level.
- German GfK consumer confidence for September was scheduled this week.
- Late September: French budget proposal. The Lecornu minority government is expected to present its full budget, which is the substantive event behind the current OAT repricing.
- 18 September: Bank of Japan decision. Markets price roughly 80% odds of a hike from the current 1.00%. Relevant to yen-hedged and unhedged Japanese equity positions alike, and to global long-end demand.
Market closures:
- Monday 31 August: United Kingdom, Summer Bank Holiday. London markets closed.
- Monday 7 September: United States, Canada and Brazil, Labour Day (Independence Day in Brazil). Wall Street, Toronto and São Paulo closed.
- No closures are scheduled in Germany, France, Japan, Australia, Switzerland or Korea over the next five trading days. Indian holiday data is unavailable for 2026, so Indian closures could not be checked.
Special Analysis: The S&P 500's Entire 27 August Gain Came From Three Stocks
Added 28 August 2026. The S&P 500 rose 0.72% on 27 August, and Nvidia, CrowdStrike and Salesforce, together 8.2% of the index by weight, contributed 0.79 percentage points of that, which means the other 502 companies were collectively negative on the day. This section decomposes both the S&P 500 and the Nasdaq 100 into per-stock contributions, and shows why the Nasdaq 100 turns out to be far less overweight the megacaps than its reputation suggests.
The question
The briefing above notes that the Nasdaq 100 rose 1.43% against the Dow's 0.20%, and calls that dispersion the day's clearest signal: a sector move rather than a market move. That is a qualitative claim. The quantitative version of it asks exactly how much of each index's move came from the three stocks that carried the day's news. The answer is stronger than the original phrasing suggested.
How a contribution is computed
For a capitalisation-weighted index, the return over a single session is exactly the weighted sum of its constituents' returns, with each weight taken at the start of the session:
r_index = sum over i of w_i(start) * r_i
so one stock's contribution, expressed in index percentage points, is simply its starting weight multiplied by its return. Contributions add up: the whole index return is the sum of them.
The trap is the weights. Published holdings files are struck at the close, which is the end of the session being measured, so using them directly overstates every stock that rose during it. Moving between the two is exact arithmetic once the stock return and the index return are known:
w_i(start) = w_i(end) * (1 + r_index) / (1 + r_i)
Weights below come from the published holdings of the funds tracking each index, and prices are closing prices from Yahoo Finance.
What each index actually did
Index moves on the day: S&P 500 +0.7203%, Nasdaq 100 +1.4270%. Stock returns, close to close: Nvidia +8.738%, CrowdStrike +20.499%, Salesforce +22.580%.
| S&P 500, +0.7203% | Weight (start of day) | Return | Contribution |
|---|---|---|---|
| Nvidia | 7.6785% | +8.738% | +0.6709 pp |
| CrowdStrike | 0.2912% | +20.499% | +0.0597 pp |
| Salesforce | 0.2543% | +22.580% | +0.0574 pp |
| Three stocks | 8.2240% | +0.7881 pp | |
| Other 502 constituents | 91.78% | -0.0678 pp |
| Nasdaq 100, +1.4270% | Weight (start of day) | Return | Contribution |
|---|---|---|---|
| Nvidia | 8.1427% | +8.738% | +0.7115 pp |
| CrowdStrike | 0.8549% | +20.499% | +0.1752 pp |
| Salesforce | 0.0000% | +22.580% | 0.0000 pp |
| Two stocks | 8.9976% | +0.8867 pp | |
| Other 99 constituents | 91.00% | +0.5403 pp |
Salesforce is in the S&P 500 but not in the Nasdaq 100, which admits only Nasdaq-listed companies, so its weight in the latter is exactly zero, not merely small. The largest single stock move of the day was invisible to one of the two indices.
The S&P 500's whole advance, and a little more
The three stocks contributed 0.7881 pp to an index that rose 0.7203%. They therefore accounted for more than the entire gain, and the arithmetic requires the rest to have gone the other way: the other 502 companies, 91.8% of the index by weight, were collectively negative on the day at -0.0678 pp.
That is a stronger statement than "a sector move, not a market move", and it is the one worth carrying. It was not that technology led a broad advance. Technology was the advance, and the rest of the market drifted slightly lower underneath it. An investor holding the index gained 0.72%; an investor holding the average company in it did not gain at all.
Why the Nasdaq 100 amplifies less at the top than expected
Both indices hold most of the same companies, so both register the same corporate news, but not equally. If a stock is held at weight w(Nasdaq) in one and w(S&P) in the other, a return of r on that stock adds w(Nasdaq) times r to the first index and w(S&P) times r to the second. The ratio of those two weights is that stock's amplification factor: how many times more heavily the Nasdaq 100 feels the same move.
The natural assumption is that amplification is largest at the top, since the Nasdaq 100 is the technology index. The weights say otherwise:
| Nasdaq 100 | S&P 500 | Amplification | |
|---|---|---|---|
| Nvidia | 8.50% | 8.29% | 1.03 |
| Micron | 4.61% | 1.58% | 2.91 |
| AMD | 3.39% | 1.17% | 2.91 |
| Palo Alto Networks | 1.39% | 0.47% | 2.98 |
| SanDisk | 0.97% | 0.33% | 2.94 |
| CrowdStrike | 0.99% | 0.35% | 2.84 |
Every name below the top sits at almost exactly the same factor, between 2.84 and 2.98, which is what proportionality produces: two indices holding the same company on the same share count differ only by the ratio of their total sizes, and that ratio is a constant. Nvidia at 1.03 is the sole departure, and a large one.
The cause is that the Nasdaq 100 is modified capitalisation weighted. Its methodology constrains how much weight its largest members may carry, so that funds tracking it can satisfy the diversification tests they are subject to. Weight removed from the top is redistributed across everyone else, which lifts the middle of the index by the same total amount it takes off the summit. The constraint therefore binds on precisely the names most people assume drive the index, and leaves untouched the tier below.
The practical consequence is that the Nasdaq 100's extra punch comes from its second tier and not from its megacaps. On 27 August, Nvidia contributed 0.71 pp to the Nasdaq 100 and 0.67 pp to the S&P 500, almost the same in both, while CrowdStrike contributed 0.18 pp against 0.06 pp, nearly three times as much. A reader treating the Nasdaq 100 as a levered Nvidia position has the wrong model of it.