2026 08 19
Global Financial Briefing — Wednesday, 19 August 2026
Americas index levels, commodities and day changes reflect the 19 August closing print, and the US Treasury curve is the settled 19 August par curve. FX, macro, credit, the VIX and the euro area bond rows are dated inline.
Market Overview
The bond-market storm that has driven markets all week broke today — and it broke on a technical announcement rather than an economic one. The US Treasury said it would increase the size of its liquidity-support buyback operations for longer-dated nominal coupon securities, and the long end rallied hard into the close: the 30-year settled at 5.19%, −9 bp on the day, and the 10-year at 4.65%, −6 bp (US Treasury par curve, 19 Aug). The 3-month bill and the 2-year both finished unchanged, so this was a pure long-end story about who buys duration, not a repricing of the policy path. The rally also extended beyond the intraday quotes earlier in the session, which had the 30-year at 5.21% and the 10-year at 4.67%.
The dollar took the brunt of it. The broad dollar index fell 0.87% to around 98.80, its lowest since 29 May, with EUR/USD at 1.1663 — a three-month high — GBP/USD at 1.3597 (+0.47%), USD/CHF down 1.51% to 0.8001 and USD/JPY down 0.69% to 158.53. Gold settled 2.82% higher at $4,545/oz and silver 2.79%. Traders also trimmed the odds of a September Fed hike to roughly 32% (CME FedWatch) — note the direction: the market's live question this cycle is whether the Fed tightens again, not when it eases.
None of that reached Asia in time. The region took the full force of Tuesday's US semiconductor unwind, and the damage was severe: the Kospi fell 5.80%, enough to trigger the Korea Exchange's sidecar mechanism suspending program sell orders, with Samsung Electronics down 7.5% and SK hynix down 9.9%. The Nikkei lost 3.16% as SoftBank fell 8% and Kioxia more than 10%, compounded by a JGB long end that had hit a 1996 high on Monday. Shanghai fell 2.40%. Europe then traded flat to marginally lower, and the US session split along exactly the fault line you would expect: the Dow closed +0.22% and the S&P 500 +0.21%, but the Nasdaq 100 −0.22% — the megacap tech complex still digesting the memory-chip de-rating while the rest of the market took the yield relief. The S&P faded through the afternoon, giving back two-thirds of the +0.31% it showed at the early-afternoon capture, so the Dow finished marginally ahead of it and the Dow-Nasdaq gap widened to 44 bp. Two very different markets are living inside the same indices.
Global Indices Snapshot
Americas
| Index | Level | Day Chg | Day Chg % | Source |
|---|---|---|---|---|
| S&P 500 | 7,707.98 | +16.22 | +0.21% | yfinance ^GSPC |
| Nasdaq 100 | 29,426.02 | −64.93 | −0.22% | yfinance ^NDX |
| Dow Jones | 53,463.05 | +119.65 | +0.22% | yfinance ^DJI |
| Brazil IBOV | 167,830.27 | +1,495.41 | +0.90% | yfinance ^BVSP |
Americas data reflects the 19 Aug close.
Cross-check: FRED SP500 for 19 Aug 2026 reports 7,707.98, matching the ^GSPC close to the cent.
Europe
| Index | Level | Day Chg | Day Chg % | Source |
|---|---|---|---|---|
| Euro STOXX 600 | 651.16 | −0.74 | −0.11% | yfinance ^STOXX |
| Euro STOXX 50 | 6,444.46 | −23.71 | −0.37% | yfinance ^STOXX50E |
| CAC 40 | 8,501.91 | −7.45 | −0.09% | yfinance ^FCHI |
| DAX | 26,091.33 | −37.03 | −0.14% | yfinance ^GDAXI |
| FTSE 100 | 10,743.35 | +15.31 | +0.14% | yfinance ^FTSE |
| SMI (Swiss) | 14,386.58 | +65.68 | +0.46% | yfinance ^SSMI |
European data reflects today's close (19 Aug).
Asia-Pacific
| Index | Level | Day Chg | Day Chg % | Source |
|---|---|---|---|---|
| Nikkei 225 | 65,326.42 | −2,134.30 | −3.16% | yfinance ^N225 |
| Hang Seng | 25,495.07 | +23.92 | +0.09% | yfinance ^HSI |
| Shanghai Comp | 3,894.42 | −95.88 | −2.40% | yfinance 000001.SS |
| ASX 200 | 9,053.80 | −16.20 | −0.18% | yfinance ^AXJO |
| Kospi (Korea) | 6,471.17 | −398.66 | −5.80% | yfinance ^KS11 |
Asia-Pacific data reflects today's close (19 Aug); local time in those markets is already 20 Aug. Kospi's 52-week low is reported as 0.0 by the data source — a clear error — so the 52-week range for that index is omitted throughout. The −5.80% day change is genuine: it reproduces exactly against the 18 Aug close of 6,869.83 and is corroborated by press reports of the Korea Exchange sidecar being triggered.
Emerging Markets
| Index | Level | Day Chg % | Source |
|---|---|---|---|
| MSCI EM (EEM) | 66.11 | +1.18% | yfinance EEM |
| India Nifty 50 | 24,078.30 | −0.32% | yfinance ^NSEI |
| South Africa | 70.29 | +4.75% | yfinance EZA |
EZA's 4.75% jump is the mirror image of the gold move — the South African index is heavily weighted to precious-metals miners, and a weaker dollar lifts the USD-quoted ETF on top of the underlying. EEM up 1.18% while the Kospi fell 5.80% is not a contradiction: EEM is USD-denominated and priced during New York hours, so it is reading the dollar's fall and the US session, not Seoul's close.
Index Valuations & Investment Risk
Valuation Table
| Index | Trailing P/E (live) | Hist avg trailing P/E (†) | Premium to hist avg |
|---|---|---|---|
| S&P 500 | 25.93x | ~16-18x | +52.5% |
| Nasdaq 100 | 30.64x | ~25-30x | +11.4% |
| Euro STOXX 600 | 17.96x | ~15-17x | +12.2% |
| CAC 40 | 17.44x | ~14-16x | +16.3% |
| DAX | 18.89x | ~15-17x | +18.1% |
| FTSE 100 | 18.04x | ~13-15x | +28.9% |
| Nikkei 225 | 22.02x | ~20-22x | +4.8% |
| MSCI EM | 17.13x | ~13-15x | +22.4% |
(†) Hist avg trailing P/E: static long-run reference constants, measured
against the midpoint of each range. Trailing P/E (live) from yfinance trailingPE on ETF proxies
(SPY, QQQ, EXSA.DE, CAC.PA, EXS1.DE, ISF.L, 1321.T, EEM).
Reference benchmarks (†): S&P 500 long-run avg trailing P/E ~16-18x, Shiller CAPE long-run avg ~17x; Euro STOXX 600 ~15-17x; MSCI EM ~13-15x. A premium above 20% counts as elevated, above 40% as historically stretched.
Investment Risk Assessment for ETF Investors
United States (S&P 500 / Nasdaq ETFs)
At 25.93x trailing, the S&P 500 sits 52.5% above the midpoint of its long-run range — the historically stretched band. The earnings yield is 3.86% (1÷25.93), against a settled 10-year of 4.65% (US Treasury par curve, 19 Aug): an earnings yield gap of −0.79 pp. On the day's closing prices, a Treasury pays more current income than the index earns. Corrected onto a real basis — earnings yield less the 10-year TIPS real yield of 2.35% (US Treasury real curve, 19 Aug) — the gap is +1.51 pp. That correction is worth 2.30 pp and flips the sign, which is the point worth noticing: the nominal comparison charges equities for a decade of inflation that the bond coupon must absorb and earnings do not.
The index closed 2.39% above its 50-day moving average and 8.75% above its 200-day, inside a 52-week range of 6,316.91-7,816.70. The Nasdaq 100 is a different picture beneath the surface: only 0.41% above its 50-day, against a 52-week range of 22,841.42-30,762.20, having given back the memory-chip run that had carried Micron, SanDisk and Western Digital to triple-digit year-to-date gains. That concentration is the live risk here — the index-level P/E disguises how much of both the gain and the current wobble sits in a handful of names. Real yields at 2.35% remain the binding constraint on the multiple; the 9 bp long-end rally the 30-year settled with is welcome but does not change that.
Europe (STOXX 600 / CAC 40 / DAX ETFs)
The STOXX 600 at 17.96x is 12.2% above its long-run midpoint — elevated but nowhere near the US. Its earnings yield is 5.57% (1÷17.96) against a 10-year Bund at 3.27%, a euro earnings yield gap of +2.29 pp; against the euro real 10-year of 1.25% the real version is +4.32 pp. Europe therefore offers materially more current income relative to its own bond market than the US does.
Some of that difference is not a difference in risk compensation at all — it is the gap between US and euro-area inflation and policy paths, which is why the real-basis pair above is the more honest comparison. Even on that basis Europe's advantage survives (+4.32 pp vs +1.51 pp), but the euro figure rests on a survey-derived real yield rather than a traded one; see the Real Yields section for why that matters.
The CAC 40 at 17.44x carries a 16.3% premium and France's specific risk is visible in its bond market rather than its equity multiple: the 10-year OAT at 4.12% is at its highest since October 2008, and the OAT-Bund spread sits at 84 bps. The DAX at 18.89x is the most expensive of the three.
A note for a euro-based holder: EUR-quoted European funds carry no FX effect on the quoted value of the holding, but real currency exposure lives inside the earnings — CAC 40 and STOXX 600 constituents are multinationals earning substantially abroad. Today's 0.76% rise in EUR/USD is a headwind to those translated earnings even though the fund price shows nothing.
Japan (Nikkei / TOPIX ETFs)
At 22.02x the Nikkei is only 4.8% above its long-run midpoint — the least stretched market in the table on this measure — but today it fell 3.16% and now sits 2.90% below its 50-day moving average. The risk here is not valuation, it is the BOJ. Policy is at 1.00% with the July hold decided 8-1 (Takata dissenting for 1.25%), the Bank has said core inflation is likely to run "clearly above" 2% from the second half of its fiscal year, and the 10-year JGB touched a 1996 high on Monday. A September hike is live. For a euro investor, the yen leg cuts both ways: USD/JPY fell 0.69% today, and an unhedged position in Japanese equities has been carrying a currency bet that has recently been the larger part of the return.
Emerging Markets (MSCI EM ETFs)
EEM at 17.13x is 22.4% above its long-run midpoint — the discount to developed markets that EM has historically offered has largely closed on this measure. The index gained 1.18% on the day on dollar weakness, but the Korean and Chinese components had a very poor session in local terms, and Korea in particular is now 12.3% below its 50-day moving average after a violent round trip. China's weight remains the dominant single exposure and Shanghai closed below both its 50-day and 200-day averages.
Overall Risk Score (qualitative, not financial advice): - United States — high valuation risk / low margin of safety. A 52.5% premium to the long-run average, a negative nominal earnings yield gap, and concentration risk concentrated in exactly the names now de-rating. - Europe — moderate. Elevated but not stretched multiples, a clearly positive earnings yield gap in both nominal and real terms, offset by French fiscal risk and a long end under pressure. - Japan — moderate. Cheapest relative to its own history, but with genuine policy-rate and currency risk attached. - Emerging Markets — moderate. The valuation discount has narrowed, and today demonstrated how quickly the Asian technology weight can transmit a US sector move.
Disclaimer: This is financial information, not personalised investment advice. Past valuations do not guarantee future returns. Consult a financial advisor before investing.
US Economic Indicators (FRED - authoritative)
| Indicator | Current | Prior | Delta | Reference Date | FRED Series |
|---|---|---|---|---|---|
| CPI YoY % | 3.30% | — | — | Jul 2026 | CPIAUCSL |
| Core CPI YoY % | 2.47% | — | — | Jul 2026 | CPILFESL |
| Unemployment Rate | 4.1% | — | — | Jul 2026 | UNRATE |
| Nonfarm Payrolls | 158,858k | 158,881k | −23k | Jul 2026 | PAYEMS |
| 10Y TIPS Real Yield | 2.35% | — | — | 19 Aug 2026 | DFII10 * |
* DFII10 is sourced from the US Treasury real curve (19 Aug), not the FRED series. The rest of the table is monthly data.
Note: FRED macro data is monthly and typically lags 4-6 weeks. Headline CPI at 3.30% with core at 2.47% is the tension the Fed is sitting on — the gap is energy and tariff pass-through, and the July payroll print was negative 23k, the kind of combination that makes a "hike vs hold" argument genuinely hard.
Other economic releases today (from web search):
| Release | Actual | Consensus | Prior | Reaction |
|---|---|---|---|---|
| UK CPI YoY (Jul) | 2.9% | 2.9% | 2.6% | In line; third consecutive acceleration |
| UK Core CPI YoY (Jul) | 2.6% | 2.5% | 2.5% | Slight upside surprise |
| UK PPI Input m/m (Jul) | −1.7% | 0.0% | — | Large downside — pipeline disinflation |
| Euro area HICP final (Jul) | released | — | — | No revision of note |
| Euro area current account (Jun) | released | — | — | — |
| FOMC minutes (Jul meeting) | Hawkish; hike support beyond the 3 dissenters | — | 9-3 hold | Released after the original cut-off; see Top Stories |
| US Treasury buyback sizing | Increased for long-dated coupons | — | — | The day's dominant market driver |
Fixed Income & Bond Analysis
Policy Rates
| Central Bank | Rate | Source |
|---|---|---|
| Fed Funds (upper) | 3.75% | FRED DFEDTARU (2026-08-19) |
| Fed Funds (lower) | 3.50% | FRED DFEDTARL (2026-08-19) |
| Effective FFR | 3.63% | FRED DFF (2026-08-17) |
| ECB Deposit Rate | 2.25% | FRED ECBDFR (2026-08-19) |
| BOJ Policy Rate | 1.00% | web search (held 31 Jul 2026, 8-1) |
| BOE Bank Rate | ~3.73% | FRED IUDSOIA (SONIA proxy, 2026-08-17) |
Government Bond Yields
| Country | 2Y Yield | 10Y Yield | 30Y Yield | Day Chg (10Y) | Source |
|---|---|---|---|---|---|
| USA | 4.19% | 4.65% | 5.19% | −6.0 bp | US Treasury par curve (2026-08-19) |
| Germany | 2.86% | 3.27% | 3.77% | +1.4 bp | web (tradingeconomics, 19 Aug) |
| France | 3.05% | 4.12% | 4.88% | −0.1 bp | web (tradingeconomics, 19 Aug) |
| UK | 4.38% | 5.06% | 5.81% | −2.5 bp | web (tradingeconomics, 19 Aug) |
| Japan | 1.68% | 2.90% | 4.09% | −4.2 bp | web (tradingeconomics, 19 Aug) |
| Italy | 3.07% | 4.06% | 4.86% | −1.7 bp | web (tradingeconomics, 19 Aug) |
The USA row is settled data for 19 Aug throughout, with the day change measured against the 18 Aug par curve. It covers the same session as the rest of the table. Across the whole curve the move was 3M and 2Y unchanged, 5Y −2 bp, 7Y −5 bp, 10Y −6 bp, 30Y −9 bp and 20Y −11 bp — a clean long-end rally.
The non-US rows are intraday quotes for 19 Aug and therefore already reflect part of the Treasury buyback rally; the German 10-year touched above 3.25% earlier in the session, its highest since March 2011, before easing back. The UK 30-year gilt reached 5.747% intraday, the highest since 1998 — the global long-end supply problem is not solved by one buyback announcement, it has just been given a day off.
Yield Curve Spreads (US Treasury par curve, 19 Aug 2026): - 10Y-2Y spread: +46 bps — positively sloped, but not steep. On the usual reckoning, "flat" is within ±25 bps and "steep" is above roughly 75 bps; 46 bps sits between the two. Not an inversion, and not the sharply upward-sloping curve that normally accompanies an easing cycle. The buyback announcement took 6 bps out of this spread in one session, from +52 bps on 18 Aug, entirely through the 10-year leg — the 2-year did not move at all. - 10Y-3M spread: +79 bps — comfortably positive, so no recession signal from this indicator.
The shape is telling you something specific: the front end is anchored by a Fed that markets think might raise rates, and the long end is being driven by supply and term premium rather than by growth expectations. That is a different animal from the growth-driven steepening that usually follows an inversion.
OAT-Bund Spread: 84 bps (France 4.12% − Germany 3.27%, both 19 Aug). The BTP-Bund spread is 79 bps — Italy continues to trade inside France, an inversion of the historical ordering that has now persisted for months and is the cleanest single read on French fiscal risk available.
Yield Curve Charts
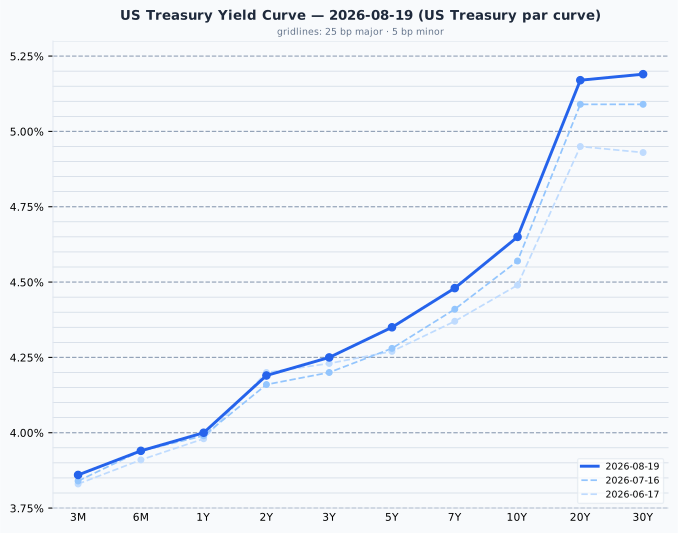
The US curve is positively sloped throughout with a pronounced steepening beyond 10 years — the 20-year at 5.17% and the 30-year at 5.19% against 4.65% at 10 years, a 52-54 bp pickup for the last two decades of duration. Against a month ago (20 Jul) the whole curve has shifted up, but overwhelmingly at the long end: 3M is +2 bp and 2Y +3 bp, while 10Y is +8 bp and 30Y +10 bp. This is still a term-premium move rather than a policy move — but the day's settled rally took roughly half of the month's long-end rise back out, the 30-year having stood +19 bp above its 20 July level as recently as 18 Aug.
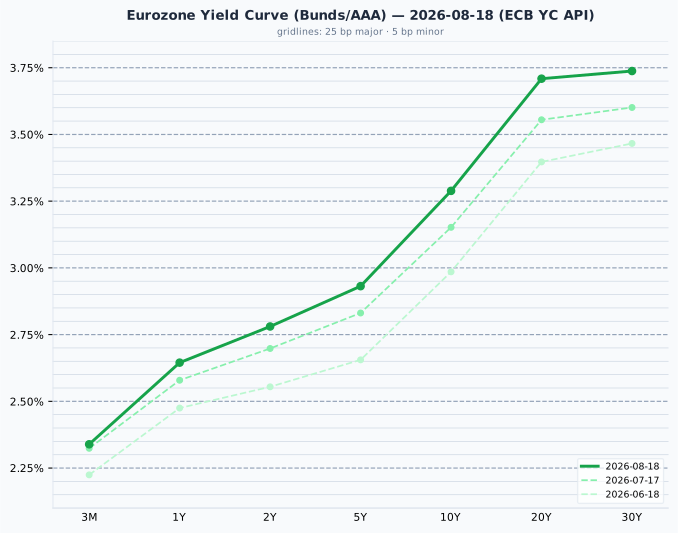
The euro AAA curve is smoothly upward-sloping from 2.34% at 3 months to 3.74% at 30 years, with the steepest segment between 5 and 20 years. Since 17 July it has risen across every maturity and, as in the US, most at the back: +2 bp at 3M and +8 bp at 2Y against +14 bp at 10Y and +15 bp at 20Y. The two curves are being pushed by the same force.
Sanity check: the 3-month Treasury at 3.86% is 23.5 bp above the Fed funds target midpoint of 3.625% — at the upper edge of the normal band, consistent with a market that assigns meaningful odds to a hike rather than a cut.
Credit Markets (from FRED — authoritative)
| Market | OAS Spread | Series ID | Observation |
|---|---|---|---|
| US Investment Grade | 82 bps | BAMLC0A0CM | 2026-08-18 |
| US High Yield | 275 bps | BAMLH0A0HYM2 | 2026-08-18 |
| Euro High Yield | 255 bps | BAMLHE00EHYIOAS | 2026-08-18 |
All three are historically tight. US high yield at 275 bps is below the 300-500 bps range that counts as normal, and investment grade at 82 bps is at the very bottom of its 80-150 bps band. Equity volatility agrees with them: the VIX closed at 15.84 (FRED VIXCLS, 2026-08-18), in the moderate 15-20 band rather than anything approaching stress. This is the most striking disconnect in today's data: equity markets in Seoul and Tokyo fell hard, the long end of every major sovereign curve has been under sustained pressure, and yet credit is priced for no trouble at all. Tight spreads of this order are a statement about complacency and about how much money is chasing carry, not a forecast of calm. They also leave very little cushion: at 275 bps, high yield has almost no room to absorb a genuine deterioration without meaningful price loss.
Real Yields (US and Euro Area)
| Region | Nominal 10Y | Expected inflation | Real 10Y | How the real yield is obtained |
|---|---|---|---|---|
| United States | 4.65% | 2.30% (residual) | 2.35% | Measured. TIPS trade, so the market quotes a real yield directly; expected inflation is the residual (the breakeven) |
| Euro area | 3.29% | 2.04% (measured) | 1.25% | Constructed. No euro inflation-linked benchmark is published, so the ECB SPF long-term HICP expectation is subtracted from the nominal AAA yield |
The two rows are built in opposite directions. The US real yield of 2.35% is a price at which securities actually change hands, with the 2.30% breakeven inferred from it. The euro real yield of 1.25% is not traded by anyone — it is the AAA 10-year (3.29%, ECB YC API, 18 Aug) less a survey mean (2.04%, ECB SPF 2026-Q3). Treat the euro figure as the softer of the two.
Two mismatches to keep in view when comparing them: the US breakeven embeds an inflation risk premium that a survey does not, so the US expected-inflation figure is biased slightly high and the real yield correspondingly low; and the SPF horizon is five calendar years ahead against the bond's ten.
Decomposing the 136 bp nominal gap between the US 10-year (4.65%) and the euro AAA 10-year (3.29%): only 26 bp is a difference in expected inflation (2.30% vs 2.04%). The remaining 110 bp is real. As on 7 August, this is overwhelmingly a real-rate story rather than an inflation story, and reasoning from the two central banks' 2% targets would have got it almost entirely wrong.
The US-euro real rate gap is not an investment opportunity
The US real yield has exceeded the euro one in every quarter since 2014. It is a structural feature — higher US trend growth, euro-area excess savings, Bund scarcity, US fiscal supply — not something a EUR-based reader can capture. Hedging the currency cancels it almost exactly, because the forward rate is set to remove the interest differential; on the most recent calculation a 10-year Treasury hedged into EUR returned less on a rolling 3-month hedge than the euro AAA bond outright, and roughly the same on a 10-year lock. Unhedged, buying the gap is a currency bet, not a bond decision. A real yield is real in its own currency: 2.35% means 2.35% above US inflation, which is not a real return for someone who spends euros.
Bond Portfolio Implications
S&P 500 earnings yield gap = (1÷25.93) − 4.65% = 3.86% − 4.65% = −0.79 pp. Euro gap = (1÷17.96) − 3.27% = 5.57% − 3.27% = +2.29 pp.
What this measure is good for: it compares the income the two instruments offer today, using nothing but quoted prices — no growth forecast, no assumptions. Read it in that spirit. At the 19 August close a US investor could lock a 4.65% Treasury coupon or accept equity risk at a 3.86% earnings yield; a euro investor faced 3.27% on the Bund against 5.57% on the STOXX 600. That is a real and useful statement about the choice available on the day.
What it cannot do is forecast which will win. Adding the bond yield to the earnings yield makes the equity-return forecast empirically worse than the earnings yield alone, because the bond leg imports long inflation-driven swings that swamp the signal. Nothing about the negative US gap predicts poor US equity returns.
Two structural biases worth stating, given how much weight the number carries above:
- It ignores growth. A bond coupon is fixed for a decade; the earnings behind the equity yield grow roughly with inflation. Stating the gap on a real basis corrects for this: US 3.86% − 2.35% = +1.51 pp, euro 5.57% − 1.25% = +4.32 pp. The size of that correction is the interesting part — 2.30 pp in the US, enough to flip the sign of the gap from negative to positive.
- An equity holder does not receive the full earnings yield. Only the dividend and buyback portion arrives as cash; the remainder is retained and reinvested at whatever return management can find. Framing the gap as a comparison of income overstates what actually reaches the investor.
The cross-country comparison (US −0.79 pp vs euro +2.29 pp) partly measures the difference between the two currencies rather than relative risk compensation, which is why the real-basis pair above matters — and on that basis, as shown in the decomposition, the difference is 110 bp of real rate against only 26 bp of inflation.
Duration risk: a 100 bp rise in yields costs roughly 8-9% in price on a 10-year bond, and appreciably more at 30 years. This week has been a live demonstration: the US 30-year has run from 5.09% in mid-July to 5.31% on Monday before settling back to 5.19% on Wednesday, and the UK 30-year gilt touched a level last seen in 1998. Today's buyback announcement is a technical support for the long end, not a fix for the supply picture behind the move. The short-to-intermediate part of the curve — where 4.19% at 2 years and 4.35% at 5 years is available with a fraction of the duration risk — continues to look like the better-compensated place to sit, though it gives up the 54 bp of extra yield on offer beyond 10 years.
Currencies & Commodities
Currencies:
| Pair | Rate | Day Chg % | Source |
|---|---|---|---|
| EUR/USD | 1.1663 | +0.76% | web (tradingeconomics, 19 Aug) |
| EUR/USD | 1.1581 | — | FRED DEXUSEU (2026-08-14) |
| USD Index | 118.90 | — | FRED DTWEXBGS (2026-08-14) |
| DXY | ~98.80 | −0.87% | web (19 Aug) |
| USD/JPY | 158.53 | −0.69% | web (tradingeconomics, 19 Aug) |
| GBP/USD | 1.3597 | +0.47% | web (tradingeconomics, 19 Aug) |
| USD/CHF | 0.8001 | −1.51% | web (tradingeconomics, 19 Aug) |
The two EUR/USD rows are shown together deliberately: the FRED series is authoritative but runs several days behind, and today's move is precisely what it has not yet captured. The dollar fell against every major — the 1.51% drop against the Swiss franc is the largest single-day move in the table — with EUR/USD reaching a three-month high. This is the buyback announcement working through the currency: lower long-end US yields reduce the dollar's carry advantage.
Commodities (all front-month futures):
| Commodity | Price | Day Chg % | Ticker | Source |
|---|---|---|---|---|
| Brent Crude | $91.62 | +0.66% | BZ=F | yfinance |
| WTI Crude | $84.39 | +0.39% | CL=F | yfinance |
| Gold ($/oz) | $4,545.30 | +2.82% | GC=F | yfinance |
| Silver ($/oz) | $65.825 | +2.79% | SI=F | yfinance |
| Copper ($/lb) | $6.4960 | +0.05% | HG=F | yfinance |
| Nat Gas ($/MMBtu) | $2.814 | +1.37% | NG=F | yfinance |
Day changes are 19 Aug settlement vs 18 Aug settlement — the exchange's official settlement price on both legs, which is the basis the wires print for a completed session.
Gold settled at $4,545.30, 18.6% below its all-time high of $5,586.20, set on 29 January 2026 — a record recent enough that it also marks the 52-week high, so the distance is meaningful rather than archaeological. The 2.82% gain is a bounce inside a large drawdown, driven by the falling dollar and the long-end rally, not a new leg higher. Silver settled at $65.825, 45.7% below its all-time high of $121.30, also set on 29 January 2026 — a far deeper unwind than gold's, which is characteristic of silver's higher beta in both directions. Neither metal is anywhere near its record despite today's move.
Copper settled at $6.4960/lb, 3.4% below its all-time high of $6.728 set on 6 August 2026 — two weeks ago, so still in the "slightly below" band — but was essentially unchanged on the day (+0.05%), a striking non-participation in a session where the dollar fell nearly 1% and the other metals rallied hard. Crude rose for a fourth session on continued Middle East tension, though by far less on settlement than the last trade suggested: WTI settled +0.39% and Brent +0.66%, against the +1.4% both showed on the post-settlement tape. The 52-week range runs $54.98-$119.48 for WTI and $58.72-$126.10 for Brent. Natural gas settled at $2.814, near the bottom of its $2.483-$7.827 52-week range despite the 1.37% gain.
Contract note: the WTI generic (CL=F) has just rolled to the October contract (CLV26.NYM) — the
reported expiry of 20 August belongs to the September contract it has already left, so no further
roll discontinuity is imminent. The natural gas generic is on NGU26.NYM, expiring 27 August, so a
roll there is about a week out.
Crypto: no notable moves retrieved.
Sector & Theme Highlights
Worst: Asian memory semiconductors, comfortably. SK hynix −9.9%, Samsung Electronics −7.5%, Kioxia −10%+, SoftBank −8%. This is the second day of an unwind that began with a US session in which Micron, SanDisk and Western Digital fell 5-7%. The trigger was rates rather than fundamentals — higher discount rates applied to a group that had run up 200-650% year to date makes for a crowded exit.
Best: precious metals and everything geared to them. Gold +2.82%, silver +2.79%, and South African equities +4.75% as a direct consequence. Rate-sensitive value in the US also did well relative to growth, which is what the Dow's +0.22% close against the Nasdaq 100's −0.22% is measuring.
Cross-market themes: - The long end is the market. Every major asset today — the dollar, gold, the Nasdaq's underperformance, the Asian rout — traces back to the price of duration. That has been true for a week and is unlikely to change before Jackson Hole. - The AI financing question is becoming a rates question. The "tidal wave" of debt issuance associated with the AI capex cycle is now being cited as a driver of long-end supply pressure, which then feeds back into the valuation of the AI complex itself. That circularity is new and worth watching. - Credit is not corroborating any of it. Spreads at multi-year tights alongside an equity market that just triggered a circuit breaker in Korea is the disconnect of the moment. - The Fed's next move is priced as a hike. ~32% for September. This reframes almost every asset-allocation assumption carried over from the easing cycle.
Top Stories (Global)
- The US Treasury increased the size of its liquidity-support buyback operations for longer-dated nominal coupon securities — an unscheduled, technical announcement that became the day's single largest market driver. The 30-year settled 9 bp lower at 5.19% and the 10-year 6 bp lower at 4.65%, the dollar index fell 0.87% to its lowest since 29 May, and gold gained 2.82%.
- The Kospi plunged 5.80%, triggering the Korea Exchange's sidecar mechanism suspending program sell orders. Samsung Electronics fell 7.54% and SK hynix 9.93%, tracking the previous session's US semiconductor losses.
- The Nikkei 225 fell 3.16%, with SoftBank down 8% and Kioxia over 10%, as the tech unwind compounded pressure from a JGB market whose 10-year had hit a 1996 high on Monday.
- UK July CPI accelerated to 2.9% from 2.6%, in line with consensus, with core at 2.6% slightly above expectations. The 30-year gilt touched 5.747%, its highest since 1998, before easing.
- Traders trimmed the odds of a September Fed hike to roughly 32% (CME FedWatch), citing softer labour-market and inflation data since the July meeting — at which the committee voted 9-3 to hold.
- The FOMC's July minutes came out hawkish. Released after this briefing's original cut-off, they showed the case for an immediate hike circulating well beyond the three dissenters — Hammack (Cleveland), Kashkari (Minneapolis) and Logan (Dallas), each of whom preferred a quarter point — with participants recording that further tightening would likely be needed if inflation did not come down. The minutes also documented a discussion opened by Chair Warsh on cutting the number of scheduled FOMC meetings from eight a year to six. Markets nonetheless kept trimming September hike odds, on the softer payroll and core inflation prints that have landed since the meeting.
- Trump announced a three-day pause on 50% Canadian tariffs, pushing USD/CAD below 1.3900 and offering modest relief on trade risk.
- Middle East tension continued to support crude for a fourth session, following Monday's seizure of a UAE-owned tanker in the Strait of Hormuz. On settlement the gains were modest — WTI +0.39% and Brent +0.66% — with the larger 1.4% moves coming only on the post-settlement tape.
Looking Ahead
Central banks - Jackson Hole Economic Policy Symposium, 27-29 August — this year's theme is "Financial Innovation: Implications for Payments and Policy." Kevin Warsh delivers his first keynote as Fed chair on Friday 28 August; the Kansas City Fed typically publishes the full agenda the evening before the symposium opens. Given that the market is pricing a possible September hike, this is the most consequential scheduled event in the calendar. - FOMC decision, 16 September. Also in September: a live BOJ meeting, with the Bank having signalled that upside inflation risk could justify a move.
Economic releases (next 1-5 sessions) - Flash PMIs for the euro area, UK, US and Japan are due in the coming days — the first read on whether the bond-market stress and the energy price rise have touched activity. - US weekly jobless claims (Thursday) carry more weight than usual given the −23k July payroll print. - Any further Treasury announcements on buyback sizing, which today proved capable of moving every major asset class.
Market closures (from the Nager.Date holiday calendar) - Monday 31 August — Summer Bank Holiday (UK): London closed. - Monday 7 September — Labour Day (US and Canada), Independence Day (Brazil): New York, Toronto and São Paulo closed. - No closures in the next five trading days in any covered market. India's holiday data is absent from the calendar for this period and could not be verified — treat Indian market closures as unchecked rather than confirmed clear.
Special Analysis: Why a Treasury Buyback Announcement Rallied the Long End 9 bp
Added 20 August 2026. A buyback swaps one liability for another and leaves total debt outstanding unchanged, so on the face of it there was nothing in Wednesday's announcement for the bond market to celebrate. The rally makes sense once you separate the quantity of debt from the quantity of interest-rate risk it forces private balance sheets to hold — but the scale of the move relative to the scale of the operation shows the market was pricing a reaction function, not a supply change.
The binding constraint was duration, not debt
Debt outstanding is a stock of dollars. Duration outstanding is a stock of interest-rate risk that private balance sheets have to warehouse. Conflating the two is what makes the rally look unjustified.
This week's selloff was a term-premium event: investors demanding more compensation to hold rate risk, with the 2-year unmoved throughout and the move growing monotonically with maturity. That is a risk-absorption problem, not a solvency problem. A swap that leaves dollars unchanged while removing risk relaxes precisely the constraint that was binding.
The securities eligible for these operations are the most duration-dense in existence. Retiring $1bn face of a 1.25%-coupon 2050 bond — the kind of low-coupon long paper issued in 2020–21, priced at 45.53 today — costs $455.3m in cash and removes $83.1m of dollar duration (value change per 100 bp). Refunding the same $455.3m:
| Funded with | Duration | $dur per 100 bp | Net change |
|---|---|---|---|
| 24-year par bond | 13.52 | 61.5 | −21.6 |
| 5-year par bond | 4.45 | 20.3 | −62.8 |
| 6-month bill | 0.49 | 2.2 | −80.9 |
Note the first row. Even refunding at the same 24-year maturity strips out 26% of the rate risk, because the retired bond's 1.25% coupon back-loads its cash flows while a par bond pays along the way. Maturity-neutral is not duration-neutral. "Swapping long for short" therefore understates what the operation does: almost any funding choice reduces the risk the market must hold.
Three amplifiers on top of the arithmetic
Dealer balance sheet. This is why the programme is called liquidity support rather than debt management. In a selloff dealers accumulate long-bond inventory they cannot hedge cheaply, and against leverage constraints that inventory crowds out their capacity to intermediate. Bid-ask widens and the market gaps rather than trades. Buybacks take inventory off dealer books and restore market-making capacity. The relief operates on the marginal intermediary, not on the debt stock.
Breaking a forced-seller spiral. Long-end routs recruit mechanical sellers — mortgage hedgers shedding duration as convexity turns against them, LDI funds meeting margin, risk-parity strategies deleveraging on the volatility spike. All of them sell more as prices fall. A credible buyer breaks the loop; once broken, realised volatility falls, and falling volatility lets leveraged holders re-add risk. The move overshoots the fundamentals in both directions.
The reaction function. Treasury revealed that it has a pain threshold and will act on it. That reprices the distribution of future outcomes, not merely today's supply. Part of the term premium investors were demanding is compensation for the tail risk of a disorderly long end; cap that tail and the required compensation falls immediately.
The scale check shows which of these mattered
Empirical term-premium elasticities from the QE literature run roughly 1–2 bp per $100bn of 10-year-equivalent duration removed. Generating 9 bp from flow alone would require something on the order of $450–900bn of 10-year equivalents. Liquidity-support operations run in low single-digit billions each — two orders of magnitude short.
The arithmetic above therefore explains why the announcement was credible, not why it moved 9 bp. Almost the entire move was the signal. The market was not repricing supply; it was repricing the probability that someone shows up when the long end breaks.
Why to be sceptical on the fundamentals
The relief is real but borrowed, and on the fundamentals the operation arguably leaves things slightly worse:
- Nothing fiscal has changed. Same deficit, same financing need, same trajectory. The buyback is funded by issuing other debt, so it consumes no net borrowing capacity and provides none.
- Reported interest outlays rise. Retiring a 1.25% coupon and refinancing at 5.28% roughly doubles the annual cash interest on the repurchased line, and interest outlays flow straight into the deficit. The operation makes the near-term fiscal picture marginally worse on the measure that matters for the headline.
- Duration risk is traded for rollover risk. Lower term premium today is bought with more frequent returns to a market that may be less accommodating later. This is the "activist Treasury issuance" critique — that managing the maturity profile to suppress long yields is monetary easing in a debt-management costume, borrowing stability from the future.
- The supply problem is global and untouched. The same session had the UK 30-year gilt at a 1998 high and the German 10-year at a 2011 high. A US buyback does nothing for either.
The signal that would distinguish genuine relief from a pause is whether the long end holds these levels without further announcements. A rally that requires periodic reassurance from the issuer is not a repriced term premium; it is a supported one.