2026 10 27
Global Financial Briefing — Tuesday, 27 October 2026
Figures reflect the 27 Oct close wherever close data exists. FX quotes and the French, UK, Japanese and Italian bond yields are evening quotes from the 27 October session; other figures are dated inline. The US Treasury curve is the 27 Oct close; the euro AAA curve is the 26 Oct curve, the ECB not having published 27 Oct yet.
Market Overview
Chip and AI-related shares rebounded around the world. Korea's Kospi rose 3.09% to 5,638.34 as foreign investors returned to Samsung Electronics (+4.23%) and SK hynix (+5.18%) a day before SK hynix's results (Digital Today; Korea JoongAng Daily; CoinCentral). Several reports tied the move to Anthropic's public filing on 26 October for a Nasdaq listing, which showed revenue of $16.3 billion in the six months to June and which analysts said restored momentum to AI-related shares (IBTimes; BFM Bourse; Yahoo Finance). Tokyo's Nikkei 225 rose 1.73%, with the chip-testing equipment maker Advantest up 7.8% (Trading Economics), ending three days of falls from its 21 October close of 64,621.24. In Paris STMicroelectronics rose 7.1% and Schneider Electric 3% (BFM Bourse), and in New York the Nasdaq 100 rose 1.29% and the S&P 500 0.60%. China went the other way: the Shanghai Composite fell 1.33% and the Shenzhen Component 2.50%, with more than 4,900 stocks lower and the CSI Semiconductor Index, which tracks Chinese chip makers, down 2.2% at a six-month low, while the Communist Party's leadership met behind closed doors (IBTimes, citing Reuters; AP).
Two results weighed on the indices that held the companies. HSBC fell 5.42% in London after third-quarter revenue of $18.6 billion missed the roughly $19 billion analysts expected and the bank left its targets unchanged (RTE; Bloomberg; Yahoo Finance quotes), helping take the FTSE 100 down 0.75%, the only major European index to fall. Boeing fell 10.69% to $168.18 after a larger-than-expected loss and a warning that 737 MAX deliveries this year would fall short of the roughly 500 it had targeted (CNBC; Yahoo Finance quotes), which kept the Dow almost flat (+0.03%). Oil eased for a second day, after Monday's 1.46% fall in WTI, as officials from Saudi Arabia, Turkey and Pakistan met Iran's leaders in Tehran and Oman said it had agreed an outline for restoring free navigation through the Strait of Hormuz (MoneyCheck, citing the Wall Street Journal): the December WTI contract (CLZ26) settled at $99.90, 1.83% below Monday's settlement, and US energy shares (XLE) were the weakest sector, down 2.05%.
Bonds barely moved on the first day of the Fed's two-day meeting: the 10-year Treasury yield settled at 4.99%, down 1 bp on the day, while the 2-year rose 2 bp to 4.70% (US Treasury par curve). On 27 October Fed funds futures implied about a 10% chance of a rate rise on Wednesday (CME FedWatch via CNBC) and more than 80% for December (CNBC; CBS put it at 71%). US consumer confidence rose 7.5 points to 91.7 in October, its first rise after three monthly declines and the highest reading since June (The Conference Board). The dollar firmed against every currency in the table, the ICE dollar index rising 0.32% to 102.28, and the euro slipped 0.33% to $1.1142.
Global Indices Snapshot
Americas
| Index | Level | Day Chg | Day Chg % | Source |
|---|---|---|---|---|
| S&P 500 | 7,722.60 | +45.83 | +0.60% | yfinance ^GSPC |
| Nasdaq 100 | 29,651.44 | +378.04 | +1.29% | yfinance ^NDX |
| Dow Jones | 52,377.60 | +16.00 | +0.03% | yfinance ^DJI |
| Brazil IBOV | 175,710.05 | −898.19 | −0.51% | yfinance ^BVSP |
Americas data reflects the 27 Oct close.
The S&P 500 is 0.33% above its 50-day average, 5.81% above its 200-day average and 1.55% below its 52-week high of 7,844.52. The Nasdaq 100 is 0.52% below its 50-day average and 5.45% below its 52-week high of 31,361.37; Nvidia rose 0.90% (Yahoo Finance quotes). In the Dow, which weights each stock by its share price rather than its company's size, Boeing's fall of $20.13 a share offset gains elsewhere. UPS rose before the open after beating forecasts and raising its full-year guidance (TheStreet via Yahoo Finance). Brazil's Ibovespa fell 0.51% after Monday's 13.88% fall on President Lula's re-election, and is 6.52% below its 50-day average.
Europe
| Index | Level | Day Chg | Day Chg % | Source |
|---|---|---|---|---|
| Euro STOXX 600 | 643.68 | +3.02 | +0.47% | yfinance ^STOXX |
| CAC 40 | 7,887.14 | +39.82 | +0.51% | yfinance ^FCHI |
| DAX | 25,590.77 | +179.93 | +0.71% | yfinance ^GDAXI |
| FTSE 100 | 10,686.54 | −80.79 | −0.75% | yfinance ^FTSE |
| SMI (Swiss) | 14,597.63 | +58.68 | +0.40% | yfinance ^SSMI |
European data reflects today's close (27 Oct).
Continental Europe rose for a second day, after Monday's 0.77% gain in the STOXX 600. The CAC 40 gained 0.51% to 7,887.14, after trading between 7,810.92 and 7,909.74 (JKN), led by the AI-related industrials STMicroelectronics (+7.1%), Schneider Electric (+3%) and Legrand (+2.5%); the banks BNP Paribas (+1.65%) and Société Générale (+1.22%) also rose, while Carrefour fell 3.45% and Valeo 3.66% (BFM Bourse). Orange was unchanged although its third-quarter results beat expectations and it raised a target, which BFM Bourse put down to investors avoiding companies whose business is mainly in France. The CAC 40 remains 2.49% below its 50-day average and 3.89% below its 200-day, the weakest major European index against its trend. The DAX rose 0.71% and sits at its 50-day average. In London, HSBC fell 5.42% to 1,291.4p, BP 2.87% and Shell 1.80% as oil eased (Yahoo Finance quotes; Proactive Investors), and the FTSE 100 fell 0.75% the day before the UK budget. Switzerland's SMI is within 0.5% of its record.
Asia-Pacific
| Index | Level | Day Chg | Day Chg % | Source |
|---|---|---|---|---|
| Nikkei 225 | 63,268.37 | +1,078.72 | +1.73% | yfinance ^N225 |
| Hang Seng | 23,041.32 | −170.49 | −0.73% | yfinance ^HSI |
| Shanghai Comp | 3,648.30 | −49.22 | −1.33% | yfinance 000001.SS |
| ASX 200 | 8,850.10 | +40.20 | +0.46% | yfinance ^AXJO |
| Kospi (Korea) | 5,638.34 | +168.87 | +3.09% | yfinance ^KS11 |
Asia-Pacific data reflects today's close (27 Oct).
The Kospi rose as much as 4.9% during the session, to 5,737.61, before closing 3.09% higher; foreign investors bought a net 835.9 billion won ($631 million) of Kospi shares by one count, after selling a net 816.5 billion won on Monday, when the index closed at its lowest since 6 April (CoinCentral; Digital Today; Aju Press, as cited in the 26 Oct briefing). Even after today's gain it is 14.35% below its 50-day average and 39.93% below its 52-week high of 9,385.59. The Nikkei 225 is 4.25% below its 50-day average. In mainland China the selling was concentrated in technology: Shanghai's STAR50 index of AI and chip companies is about 40% below its July peak (IBTimes, citing Reuters). The Shanghai Composite is 2.07% above its 52-week low and 5.82% below its 50-day average. The Hang Seng fell 0.73%, with HSBC, one of its largest members, down about 5% in Hong Kong (South China Morning Post); it is 2.32% above its 52-week low of 22,518.00. Australia's ASX 200 rose 0.46%.
Emerging Markets
| Index | Level | Day Chg % | Source |
|---|---|---|---|
| MSCI EM (EEM) | 62.52 | +1.13% | yfinance EEM |
| India Nifty 50 | 22,749.75 | −0.02% | yfinance ^NSEI |
| South Africa | 64.02 | +0.83% | yfinance EZA |
EEM, EZA and the Nifty reflect the 27 Oct close.
EEM trades in New York after Asia has closed, so its 1.13% gain is New York's valuation of emerging markets today, not the sum of the local closes, which diverged: Korea rose 3.09%, while Shanghai fell 1.33%, Hong Kong 0.73% and India was flat. EEM's rise is closer to Korea's and to the US chip rally than to China's fall; Taiwan's close is not covered here. For a euro investor, the euro's 0.33% fall against the dollar added to the gain, about +1.5% in euros. India's Nifty closed unchanged at 22,749.75, and South Africa's fund rose 0.83%.
Index Valuations & Investment Risk
Valuation Table
| Index | Trailing P/E (live) | 50-day avg | 100-day avg | 200-day avg |
|---|---|---|---|---|
| S&P 500 | 24.4x | 25.0x | 25.8x | — |
| Nasdaq 100 | 27.6x | 29.5x | 30.7x | — |
| Euro STOXX 600 | 17.8x | 17.7x | 18.1x | — |
| CAC 40 | 16.6x | 16.7x | 17.2x | — |
| DAX | 18.1x | 18.3x | 18.4x | — |
| FTSE 100 | 16.6x | 16.6x | 17.2x | — |
| Nikkei 225 | 16.6x | 20.8x | 21.8x | — |
| MSCI EM | 13.4x | 14.9x | 16.1x | — |
Averages of the daily trailing P/E readings recorded since 1 May 2026 (n = 119; 115 for the Nikkei proxy); shown for reference only. Trailing P/E is Yahoo Finance's trailing P/E for the ETF proxies SPY, QQQ, EXSA.DE, CAC.PA, EXS1.DE, ISF.L, 1321.T and EEM; the US-listed proxies are priced at the 27 Oct close.
Investment Risk Assessment for ETF Investors
United States (S&P 500 / Nasdaq ETFs)
The S&P 500's trailing P/E of 24.4x gives an earnings yield of 4.09% (1÷24.44). Against the settled 10-year Treasury yield of 4.99% (US Treasury par curve, 27 Oct) the earnings yield gap is −0.90 pp: a 10-year government bond pays more income than the index's earnings come to per dollar invested. Against the real 10-year yield of 2.64% (US Treasury real curve, 27 Oct) the gap is +1.45 pp; the 2.35 pp between the two is the correction for company earnings growing with inflation while a bond coupon is fixed. Only the part of earnings paid out as dividends and buybacks reaches a holder as cash. The Nasdaq 100 at 27.6x has an earnings yield of 3.62%, 1.37 pp below the 10-year Treasury. The S&P 500 at 7,722.60 sits just above its 50-day average. Both legs of the comparison face a test in the next three days: the Fed decides on 28 October, after raising its target range to 3.75–4.00% at its 15–16 September meeting (as cited in the 20 Oct briefing), and Microsoft, Alphabet and Amazon report, with investors watching how much they plan to spend on AI (Marc to Market, as cited in the 26 Oct briefing).
Europe (STOXX 600 / CAC 40 / DAX ETFs)
The STOXX 600 at 17.8x gives an earnings yield of 5.62% (1÷17.79); against the euro AAA 10-year yield of 3.37% (ECB YC API, 26 Oct) the euro earnings yield gap is +2.25 pp, and today's 10-year Bund quote of 3.36% (Trading Economics) gives +2.26 pp. Against the euro-area real 10-year yield of 1.34% (see Real Yields below) it is +4.28 pp. The S&P 500 trades at a 37.4% P/E premium to the STOXX 600 (24.4x against 17.8x). Part of the difference between the US and euro gaps reflects different inflation and policy paths rather than different compensation for risk, which is why the real-yield versions are shown alongside.
France remains the region's main risk. The CAC 40 at 16.6x has an earnings yield of 6.02% (1÷16.61), 1.10 pp above the French 10-year yield of 4.92%; the DAX at 18.1x yields 5.52%, 2.16 pp over the Bund, and the FTSE 100 at 16.6x yields 6.03%, 0.68 pp above the 10-year gilt at 5.35%. French 10-year yields rose about 1 bp today after Monday's 13 bp fall, which Trading Economics described as profit-taking. The National Assembly resumed debating the 2027 budget's revenue measures today, with more than 2,000 amendments still to examine; its vote on that part of the budget, first planned for 20 October, is now set for 3 November (Assemblée nationale; NosParlementaires). A euro investor in euro-quoted funds has no exchange-rate effect on the quoted value, but the constituents earn much of their profit abroad, so their earnings in euros still move with the currency.
Japan (Nikkei / TOPIX ETFs)
The Nikkei proxy's P/E is 16.6x (earnings yield 6.03%), 3.24 pp above the 10-year Japanese government bond at 2.79% (Trading Economics). The Bank of Japan announces its decision on 30 October and is expected to hold its rate at 1.25% (Nikkei, 22 Oct, via web search), with officials possibly signalling a rise in December (Trading Economics). The yen weakened 0.25% against the dollar but edged up about 0.1% against the euro, so a euro investor in an unhedged Japan fund kept slightly more than the index's 1.73% gain.
Emerging Markets (MSCI EM ETFs)
EEM trades at 13.4x, the cheapest index in the table and a 45.1% discount to the S&P 500. Today showed how far the index depends on a handful of Asian chip makers: Korea's 3.09% rise outweighed China's falls in EEM's New York price. Those companies face their own test this week, with SK hynix reporting on 28 October and Samsung Electronics on 29 October (Digital Today). A US rate rise in December, which futures priced at more than 80% on 27 October (CNBC; CBS put it at 71%), would tend to draw money out of emerging markets and raise the cost of their dollar debts, whatever the investor's home currency; the currency conversion matters less for a euro holder, because the euro tends to fall against the dollar at the same time, as it did today.
Overall Risk Score: - United States: High valuation risk / low margin of safety. A negative nominal earnings yield gap, a 10-year yield of 4.99%, and the Fed's decision and the largest technology companies' results due in the next three days. - Europe: Moderate. Positive earnings yield gaps on both measures and a P/E well below the US; French 10-year yields of 4.92%, about 156 bp over Germany, with the budget not yet passed. - Japan: Moderate. A P/E of 16.6x, with a BOJ decision on 30 October. - Emerging Markets: Attractive relative valuation, with Korean chip makers' results this week and mainland Chinese technology shares still falling.
US Economic Indicators (FRED - authoritative)
| Indicator | Current | Prior | Delta | Reference Date | FRED Series |
|---|---|---|---|---|---|
| CPI YoY % | 3.72% | 3.35% | +0.36 pp | Sep 2026 (prior Aug) | CPIAUCSL |
| Core CPI YoY % | 2.57% | 2.45% | +0.12 pp | Sep 2026 (prior Aug) | CPILFESL |
| Unemployment Rate | 4.2% | 4.1% | +0.10 pp | Sep 2026 (prior Aug) | UNRATE |
| Nonfarm Payrolls | +29k | +133k | −104k | Sep 2026 (prior Aug), monthly chg | PAYEMS |
| 10Y TIPS Real Yield | 2.64% | 2.66% | −2 bp | 27 Oct 2026 (prior 26 Oct) | DFII10 (US Treasury real curve) |
Other economic releases today (web search)
| Release | Actual | Consensus | Prior | Note |
|---|---|---|---|---|
| US Conference Board consumer confidence, Oct | 91.7 | — | 84.2 (revised from 81.9) | above expectations (BFM Bourse); present situation 120.4 (+8.6), expectations 72.6 (+6.9); 12-month inflation expectations 5.8% (The Conference Board; FXStreet) |
The Conference Board asks households how they see business conditions and jobs now and over the next six months. October's 7.5-point rise, the first after three monthly declines, came from both parts of the survey: the assessment of the present rose 8.6 points to 120.4 and expectations 6.9 points to 72.6. The Board linked the improvement to petrol prices easing from September to October, but households said they planned to spend less on services and durable goods over the next six months, and the expectations index stays below 80, a level the Board has long associated with a risk of recession ahead. Its economist Fergus McCormick said confidence remained on its long-term downward trend. Consumers' expected inflation over the next year fell but, at 5.8%, is well above September's 3.7% CPI rate. The survey closed on 21 October. The dollar index rose above 102 after the release (FXStreet).
Fixed Income & Bond Analysis
Policy Rates
| Central Bank | Rate | Source |
|---|---|---|
| Fed Funds (upper) | 4.00% | FRED DFEDTARU (27 Oct 2026) |
| Fed Funds (lower) | 3.75% | FRED DFEDTARL (27 Oct 2026) |
| Effective FFR | 3.88% | FRED DFF (26 Oct 2026) |
| ECB Deposit Rate | 2.50% | FRED ECBDFR (27 Oct 2026) |
| BOJ Policy Rate | 1.25% | web search (raised to 1.25% in September; decision 30 Oct, expected hold) |
| BOE Bank Rate | 3.73% | FRED IUDSOIA (SONIA proxy, 23 Oct 2026) |
The Fed raised its target range to 3.75–4.00% at its 15–16 September meeting (as cited in the 20 Oct briefing) and announces its decision on 28 October; on 27 October futures implied about a 10% chance of a rise then (CME FedWatch via CNBC) and more than 80% for December (CNBC; CBS put it at 71%). The ECB raised its deposit rate to 2.50% on 10 September, its second rise this year after June's move to 2.25% (as cited in the 20 Oct briefing), and decides on 29 October, when it is expected to hold (Trading Economics). The BOJ raised its rate to 1.25% on 18 September by a 7–2 vote (as cited in the 21 Oct briefing; Anadolu) and announces its decision on 30 October. The Bank of England held Bank Rate at 3.75% on 17 September (as cited in the 21 Oct briefing) and meets next on 5 November.
Government Bond Yields
| Country | 2Y Yield | 10Y Yield | 30Y Yield | Day Chg (10Y) | Source |
|---|---|---|---|---|---|
| USA | 4.70% | 4.99% | 5.30% | −1 bp | US Treasury par curve (27 Oct 2026) |
| Germany | 3.06% | 3.36% | 3.69% | +1 bp | web (Trading Economics, 27 Oct 2026 intraday) |
| France | 3.73% | 4.92% | 5.42% | +1 bp | web (Trading Economics, 27 Oct 2026 intraday) |
| UK | 4.95% | 5.35% | 5.74% | 0 bp | web (Trading Economics, 27 Oct 2026 intraday) |
| Japan | 1.88% | 2.79% | 3.82% | +1 bp | web (Trading Economics, 27 Oct 2026 intraday) |
| Italy | 3.47% | 4.51% | 5.08% | +1 bp | web (Trading Economics, 27 Oct 2026 intraday) |
The USA row is the 27 Oct 2026 settled curve, and its day change is against the 26 Oct 2026 curve from the same feed. The European and Japanese day changes are Trading Economics' and round moves of −0.1 to +1.3 bp.
Yield Curve Spreads (US Treasury par curve, 27 Oct 2026): - 10Y-2Y spread: +29 bp, positive, 4 bp outside the ±25 bp flat band and under the 75 bp steep threshold, −3 bp against 26 Oct. - 10Y-3M spread: +77 bp, positive, no recession signal, −1 bp against 26 Oct.
OAT-Bund Spread: 156 bp (10-year OAT 4.92% against Bund 3.36%, Trading Economics, 27 Oct 2026 intraday), against about 154 bp on Monday's quotes.
The US spreads are what investors normally demand for lending for longer and do not signal an expected recession. On the day the 2-year rose 2 bp to 4.70% while the 5-year fell 2 bp to 4.82%, the 10-year 1 bp to 4.99% and the 30-year 1 bp to 5.30%: moves of a basis point or two, as the market waited for the Fed rather than moving ahead of it.
In Europe, yields were nearly unchanged. Germany's 10-year Bund held near 3.36%, close to its lowest since early September, which Trading Economics attributed to demand for safe assets on worries that the Middle East conflict could drag on despite the talks, and to caution before Thursday's ECB decision. France's 10-year rose about 1 bp to 4.92% after Monday's 13 bp fall following Moody's decision to keep France's rating, and its premium over Germany widened to about 156 bp. Italy's 10-year, at 4.51%, is about 115 bp over Germany. The UK 10-year gilt was flat at 5.35% the day before the budget, and Japan's 10-year, at 2.79%, is near its lowest since early August, supported by Japanese investors bringing money home in volatile markets (Trading Economics).
Yield Curve Charts
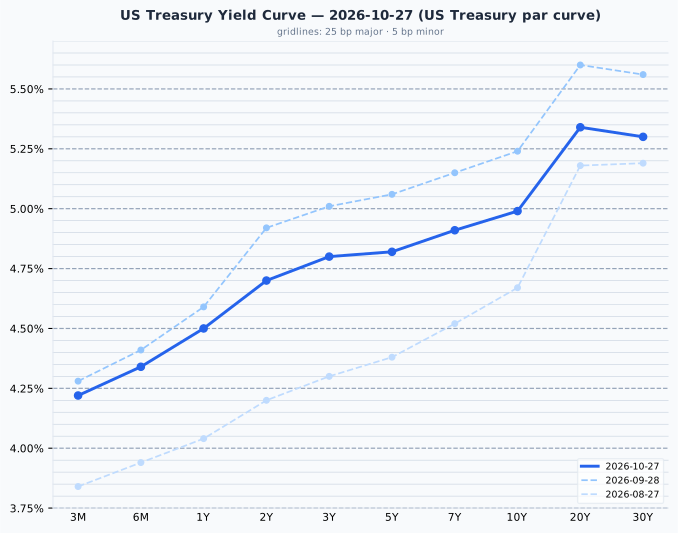
US Treasury par curve, 27 Oct 2026: 3M 4.22%, 6M 4.34%, 1Y 4.50%, 2Y 4.70%, 3Y 4.80%, 5Y 4.82%, 7Y 4.91%, 10Y 4.99%, 20Y 5.34%, 30Y 5.30%; 2-to-10 slope +29 bp. Prior curves: 28 Sep and 27 Aug 2026. The 3-month bill at 4.22% is 34.5 bp above the Fed Funds midpoint of 3.875%.
The US curve rises from 4.22% at three months to 5.34% at 20 years, with the 30-year 4 bp below the 20-year. Against 28 September the whole curve from two years out has fallen by about a quarter point (2-year −22 bp, 10-year −25 bp, 30-year −26 bp), narrowing the 2-to-10 slope from 32 bp to 29 bp; the 3-month bill's 34.5 bp gap over the Fed Funds midpoint is consistent with the December rise futures price.
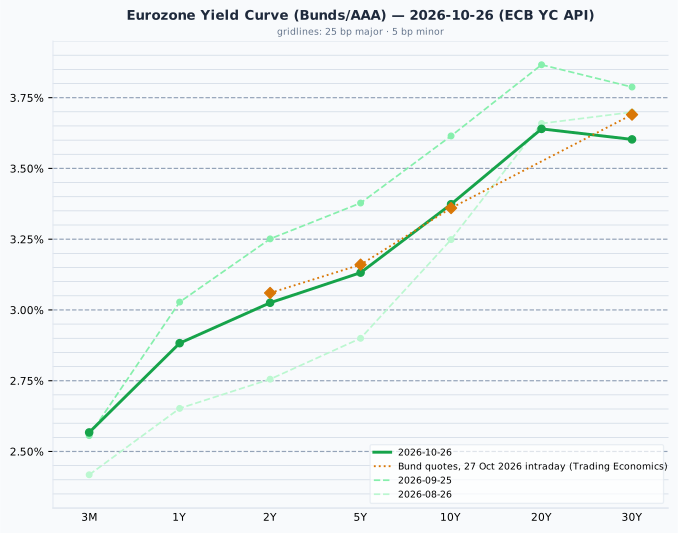
Euro area AAA government curve, 26 Oct 2026 (ECB YC API): 3M 2.57%, 1Y 2.88%, 2Y 3.03%, 5Y 3.13%, 10Y 3.37%, 20Y 3.64%, 30Y 3.60%; 2-to-10 slope +35 bp. Today's Bund quotes (Trading Economics, 27 Oct 2026), overlaid, differ from the plotted curve by at most 9 bp, at the 30Y (3.69% against 3.60%); the curve is the ECB's fitted AAA euro-area composite and the quotes are on-the-run Bunds, which sit a few basis points apart by construction, so only a gap well beyond that is a day move.
The euro AAA curve rises from 2.57% at three months to 3.64% at 20 years, with the 30-year 4 bp below the 20-year. Against 25 September it is 23 bp lower at two years and 24 bp lower at ten, so its 2-to-10 slope has narrowed slightly, from 36 bp to 35 bp.
Credit Markets (from FRED - authoritative)
| Market | OAS | Obs. date | vs prior obs | Series ID |
|---|---|---|---|---|
| US Investment Grade | 90 bp | 26 Oct 2026 | −1 bp | BAMLC0A0CM |
| US High Yield | 330 bp | 26 Oct 2026 | −8 bp | BAMLH0A0HYM2 |
| Euro High Yield | 363 bp | 26 Oct 2026 | −1 bp | BAMLHE00EHYIOAS |
Change is 26 Oct 2026 vs 23 Oct 2026. Credit spreads are the 26 October close; today's session is not in them yet.
The extra yield on lower-rated US company bonds over Treasuries narrowed 8 bp to 330 bp on 26 October, the day US shares rose and oil fell, and sits in the lower part of the normal 300–500 bp range; investment-grade spreads, at 90 bp, are near the bottom of their 80–150 bp range. Euro lower-rated bonds narrowed 1 bp to 363 bp, after widening by 26 bp over 22 and 23 October. The VIX, the index of expected volatility in the S&P 500, closed at 18.39 on 26 October (FRED VIXCLS), a moderate reading, down from 19.45 on 23 October.
Real Yields (US and Euro Area)
| Region | Nominal 10Y | Expected inflation | Real 10Y | How the real yield is obtained |
|---|---|---|---|---|
| United States | 4.99% (US Treasury par curve, 27 Oct 2026) | 2.35% (residual: nominal − real) | 2.64% (US Treasury real curve, 27 Oct 2026) | Measured. TIPS trade, so the market quotes a real yield directly; expected inflation is the residual (the breakeven) |
| Euro area | 3.37% (ECB YC API, 26 Oct 2026) | 2.04% (ECB SPF, 2026 Q3, measured) | 1.34% (residual: nominal − expected) | Constructed. No euro inflation-linked benchmark is published, so a survey expectation is subtracted from the nominal yield |
Only the US real yield is a market price; the euro figure is derived from a survey and is the softer of the two. Two mismatches apply when comparing them: the US breakeven includes a premium investors demand for inflation risk, which a survey does not, and the survey looks five years ahead against the bond's ten. The US leg is dated 27 October and the euro leg 26 October, the latest ECB curve. The 162 bp gap between US and euro nominal 10-year yields splits into 31 bp of expected-inflation difference (2.35% against 2.04%) and 130 bp of real-rate difference (2.64% against 1.34%), the figures rounded, so the gap is almost entirely real. The US real yield fell 2 bp on 27 October to 2.64%.
Why the US real-yield advantage is not a return a euro investor can capture
The US real yield has exceeded the euro one in every quarter since 2014, by 1.52 pp on average, and the 130 bp on these figures is under that mean. It is a structural feature (US trend growth, euro-area savings, the scarcity of German government bonds, heavy US government borrowing), not a return a euro-based reader can capture: hedging the currency removes it, because the forward exchange rate is set from the same interest differential, and holding Treasuries unhedged is a bet on the dollar rather than a bond decision. A real yield is real in its own currency; a US real yield of 2.64% is that much above US inflation, which is not a real return for someone who spends euros. The gap is stated here as a description of relative policy stance and growth expectations, and no portfolio conclusion is drawn from it.
Bond Portfolio Implications
A 10 bp rise in yields is an ordinary day's move. At the 27 Oct 2026 par yields it costs:
| Maturity | Yield | Modified duration | Loss for a 10 bp rise | Months of coupon lost |
|---|---|---|---|---|
| 2-year | 4.70% | 1.89 | 0.19% | 0.5 |
| 10-year | 4.99% | 7.80 | 0.78% | 1.9 |
| 30-year | 5.30% | 14.94 | 1.48% | 3.3 |
Months of coupon lost is the loss divided by one month of coupon (yield ÷ 12) on a par bond. Computed from the US Treasury par curve, 27 October.
The 10-year's 1 bp fall on 27 October gave a holder a price gain of about 0.08%, a negligible amount.
The 30-year Treasury pays 0.60 pp more than the 2-year for nearly eight times as much price movement per 10 bp, and with the Fed, the ECB and the Bank of Japan deciding in the next four days and futures pricing a Fed rise in December, short maturities keep most of the income with far less exposure to a surprise.
Currencies & Commodities
Currencies (Yahoo Finance live quotes)
| Pair | Rate | Day chg % | Source |
|---|---|---|---|
| EUR/USD | 1.1142 | −0.33% | yfinance (18:37 CET) |
| USD Index (DXY, ICE) | 102.28 | +0.32% | yfinance (18:28 CET) |
| USD/JPY | 157.87 | +0.25% | yfinance (18:38 CET) |
| GBP/USD | 1.3316 | −0.19% | yfinance (18:37 CET) |
| USD/CHF | 0.8283 | +0.20% | yfinance (18:38 CET) |
FX quotes as of 18:28–18:38 CET; day change vs the previous 17:00 ET close.
The dollar firmed against every currency in the table, as it had on Monday, the ICE dollar index rising 0.32% to 102.28, above 102 for the first time in two weeks (FXStreet). The euro fell most, 0.33% to $1.1142, two days before the ECB decision. The yen slipped 0.25% to 157.87 per dollar, the Swiss franc 0.20% to 0.8283 and the pound 0.19% to $1.3316, the day before the UK budget.
Commodities (Yahoo Finance front-month futures)
| Commodity | Price | Day Chg % | Ticker | Source |
|---|---|---|---|---|
| Brent Crude ($/bbl) | 109.41 | −1.20% | BZ=F | yfinance (BZF27, Jan) |
| WTI Crude ($/bbl) | 99.90 | −1.83% | CL=F | yfinance (CLZ26, Dec) |
| Gold ($/oz) | 4,074.60 | +0.90% | GC=F | yfinance (GCZ26, Dec) |
| Silver ($/oz) | 54.513 | +0.32% | SI=F | yfinance (SIZ26, Dec) |
| Copper ($/lb) | 6.6525 | +1.69% | HG=F | yfinance (HGZ26, Dec) |
| Nat Gas ($/MMBtu) | 3.004 | −0.60% | NG=F | yfinance (NGZ26, Dec) |
Day changes are settlement (27 Oct 2026) vs the prior session's settlement (26 Oct 2026).
Every row shows the same contract as Monday's table, so the levels are comparable. Oil eased for a second day, after Monday's settlements fell 1.46% for WTI and 0.86% for January Brent, on progress in talks with Iran, although Houthi forces claimed attacks on Saudi pipeline pumping stations (MoneyCheck; oilprice.com): the December WTI contract (CLZ26) settled at $99.90, 1.83% below Monday's settlement of $101.76, and the January Brent contract (BZF27) at $109.41, 1.20% below its $110.74 settlement. Most news reports quote the December Brent contract (BZZ26), which settled at $113.88, down 1.67% and $4.47 above January. January Brent is 13.24% below the 52-week high of $126.10 set by an earlier contract (range $58.72 to $126.10), and December WTI 16.39% below its $119.48 high (range $54.98 to $119.48).
Gold rose 0.90% to $4,074.60, 27.06% below its all-time high of $5,586.20 set on 29 January 2026; silver rose 0.32% to $54.513, 55.06% below its all-time high of $121.30 set the same day. Copper rose 1.69% to $6.6525, slightly below its all-time high of $6.83 set on 22 September, 2.60% below it. Natural gas fell 0.60% to $3.004, in the lower part of its 52-week range of $2.483 to $7.827.
Sector & Theme Highlights
US sector funds (Select Sector SPDRs, 27 Oct close): technology (XLK) led, up 1.70%, followed by consumer discretionary (XLY, +1.04%), materials (XLB, +0.78%) and utilities (XLU, +0.71%). Industrials (XLI) rose 0.57% despite Boeing's 10.69% fall. Energy (XLE) was the weakest, down 2.05% as oil fell, followed by consumer staples (XLP, −0.92%) and real estate (XLRE, −0.84%). Communication services (XLC, −0.26%), financials (XLF, −0.25%) and health care (XLV, −0.06%) edged lower.
- AI shares rebound worldwide: Anthropic's public filing for a Nasdaq listing coincided with a rally in chip and AI-related shares from Seoul (Kospi +3.09%) and Tokyo (Advantest +7.8%) to Paris (STMicroelectronics +7.1%) and New York (Nasdaq 100 +1.29%), before SK hynix, Samsung Electronics, Microsoft, Alphabet and Amazon report this week.
- China's technology sell-off deepens: the Shanghai Composite fell 1.33% and the Shenzhen Component 2.50%, with the CSI Semiconductor Index of Chinese chip makers at a six-month low, on a day when other Asian chip markets rose.
- Bank results disappoint in London: HSBC fell 5.42% after its revenue missed forecasts, taking the FTSE 100 down 0.75%.
- Oil eases on Iran talks: December WTI settled 1.83% lower at $99.90, and energy was the weakest US sector.
- Central banks: the Fed (28 October), the ECB (29 October) and the Bank of Japan (30 October) decide this week; all three are expected to hold; futures price a Fed rise in December, and a December rise is also possible at the Bank of Japan.
Top Stories (Global)
- Chip shares rally from Seoul to New York. The Kospi rose 3.09%, with SK hynix up 5.18% and Samsung Electronics 4.23%; reports tied the move to Anthropic's public filing on 26 October for a Nasdaq listing, which showed $16.3 billion of revenue in the first half (Digital Today; IBTimes; Yahoo Finance).
- HSBC's revenue misses. Third-quarter revenue of $18.6 billion fell short of the roughly $19 billion expected, with the wealth business flat at $2.7 billion; pretax profit rose 32% to $9.6 billion and the bank announced a buyback of up to $1 billion, but its shares fell 5.42% in London (RTE; Bloomberg; SCMP; Yahoo Finance quotes).
- Boeing cuts its delivery outlook. Boeing reported a core loss of $0.34 a share against the $0.24 expected and said 737 MAX deliveries would fall short of about 500 this year; its shares closed 10.69% lower at $168.18 (CNBC; Boeing; Yahoo Finance quotes).
- US consumer confidence recovers. The Conference Board's index rose 7.5 points to 91.7 in October, its first rise after three monthly declines, though expectations remain below the 80 level the Board associates with recession risk (The Conference Board).
- Mainland Chinese shares fall. The Shanghai Composite lost 1.33% and the Shenzhen Component 2.50%, with more than 4,900 stocks lower, as the Communist Party's leadership met (IBTimes, citing Reuters; AP).
- Oil eases on Iran diplomacy. Saudi, Turkish and Pakistani officials met Iran's leaders and Oman reported an outline for restoring shipping through the Strait of Hormuz; December WTI settled at $99.90, down 1.83% (MoneyCheck, citing the Wall Street Journal).
- The Fed's meeting begins. On 27 October futures implied about a 10% chance of a rise on Wednesday (CME FedWatch via CNBC) and more than 80% for December (CNBC; CBS put it at 71%).
Looking Ahead
- Wednesday 28 October: the Fed's decision; the UK budget; SK hynix's third-quarter results; Microsoft and Alphabet report after the Fed decision (Digital Today; Marc to Market, as cited in the 26 Oct briefing).
- Thursday 29 October: the ECB's decision; Samsung Electronics' results (Digital Today); Amazon, Intel and SanDisk report (Marc to Market, as cited in the 26 Oct briefing).
- Friday 30 October: the Bank of Japan's decision and its quarterly outlook report.
- During the week: the first estimate of US third-quarter GDP, forecast at 3.0% annualised; the Bank of Canada is expected to raise rates (Marc to Market, as cited in the 26 Oct briefing).
- Further out: Apple reports on 2 November, after the US close (MacDailyNews, citing Apple investor relations); US midterm elections on 3 November, the same day as the French National Assembly's vote on the 2027 budget's revenue measures (NosParlementaires); the euro-area flash inflation estimate for October on 4 November (as cited in the 19 Oct briefing); the Bank of England meets on 5 November; Anthropic could begin marketing its listing as soon as the week of 9 November (Bloomberg, via Yahoo Finance).
Market closures - France 1 Nov 2026 (All Saints' Day), a Sunday, so no trading day is lost. - Further out: Brazil 2 Nov 2026 (All Souls' Day); Japan 3 Nov 2026 (Culture Day). - No Indian holiday data is available here, so Indian closures are not checked.
Special Analysis: Why Anthropic's IPO Filing Lifted Chip Shares Around the World
Added 28 October 2026. Anthropic, the developer of the Claude AI models, published its listing prospectus on 26 October. It gave investors a detailed view of how much an AI model developer earns and how much it has committed to spend on computing capacity. Chip and data-centre suppliers rose from Seoul to New York on 27 October because, from the suppliers' side, those commitments are future orders. The filing does not show whether Anthropic can keep revenue growing fast enough to pay for them.
What the filing disclosed
Anthropic filed a registration statement with the Securities and Exchange Commission on 26 October to list Class A shares on the Nasdaq Global Select Market under the ticker ANT. This statement, Form S-1, is the prospectus a US company must publish before selling shares to the public. Anthropic had submitted a confidential draft on 1 June. Goldman Sachs and Morgan Stanley lead a group of 22 underwriting banks.
| $ million | 2024 | 2025 | H1 2025 | H1 2026 |
|---|---|---|---|---|
| Revenue | 386 | 4,585 | 1,163 | 16,286 |
| Compute and infrastructure | 2,522 | 7,326 | 2,334 | 8,945 |
| Operating loss | −2,980 | −8,060 | −2,135 | −693 |
| Interest income | 106 | 431 | 115 | 1,111 |
| Change in value of convertible notes and related instruments | −5,434 | −34,308 | −10,942 | −72,388 |
| Other expense | — | −8 | — | −8,757 |
| Income tax | −1 | −20 | −7 | −21 |
| Net loss | −8,309 | −41,965 | −12,969 | −80,748 |
Source: Anthropic S-1, consolidated statements of operations. H1 is the six months to 30 June. The operating loss is after all operating costs, of which compute is the largest; the rows below it add up to the net loss.
First-half revenue was fourteen times its level a year earlier. Spending on compute, meaning the chips and data-centre capacity used to train and run the models, almost quadrupled. Revenue grew faster: in 2025 compute alone cost 1.6 times revenue, and in the first half of 2026 it cost 55% of revenue. The operating loss narrowed to $0.7 billion, against $8.1 billion for all of 2025.
The net loss of $80.7 billion is mostly an accounting charge. Anthropic raised money through convertible notes, loans that turn into shares. As its valuation rose, the shares those notes will become were worth more, and the $72.4 billion rise in their value is recorded as a loss. The further $8.8 billion of other expense comes mainly from recording new instruments of the same kind at their value. Neither charge took cash out of the company. Cash and short-term investments stood at $131.7 billion at the end of June. The balance sheet shows a deficit of $127.6 billion, but that is because of how preferred shares are counted before they convert into ordinary shares at the listing.
How the compute bill is accounted for
Anthropic rents almost all of its computing power, so the cost appears as an operating expense rather than as capital spending. Its purchases of property and equipment were $482 million in the first half, against $8.9 billion of compute costs. The compute line covers both training new models and serving customers. The part spent on serving customers is counted in cost of revenue, which was $2.4 billion in the first half. Revenue less cost of revenue, the gross margin, was therefore 85% of revenue, against about 40% in 2025. Most of the rest of the compute bill is training, recorded as research and development (Anthropic S-1).
The leases and purchase agreements signed since the end of 2025, with future minimum payments of about $417 billion, are therefore mostly other companies' capital spending that Anthropic has promised to pay for. Its commitments to buy capacity from cloud providers stood at about $265.6 billion at the end of June, against $54.6 billion at the end of 2025. Those providers build and own the data centres, and Anthropic's payments become its expense as the capacity is delivered. The largest equipment deals are five-year leases of TPU servers (Google-designed AI chips) from Broadcom, with rent of about $161 billion. They are accounted for as finance leases: when each batch of equipment arrives, the equipment and a matching debt go on the balance sheet. The repayments then appear under financing in the cash-flow statement, not as capital spending. Leased equipment received in the first half came to only $445 million, because most of the TPU capacity comes online from 2027. That figure, not reported capital spending, is the one to watch, and free cash flow (operating cash flow less capital spending) will understate how much Anthropic invests. Broadcom has also agreed to lend up to $42 billion in convertible notes, at 9% interest added to the principal, which can be used to pay the rent.
Who the customers are
At 30 September, more than 11,900 customers paid Anthropic over $100,000 a year, up from about 950 twelve months earlier. More than 1,900 paid over $1 million and about 250 over $10 million.
Revenue has been concentrated, but less so over time:
- In 2025 two unnamed customers each provided 12% of revenue, nearly a quarter between them.
- In the first half of 2026 one customer provided 11%.
- In the nine months to September, no single customer was above 10%, and the five largest together provided about 25%.
- Within that period, the five largest provided about 36% of revenue in the first quarter and about 21% in the third, even though revenue from each of them reached a record in the third quarter (Anthropic S-1).
About 48% of first-half revenue came through the marketplaces of Amazon, Google and Microsoft, which bill customers and pass the money on. Anthropic says it holds a contract with each end customer and counts that company as the customer, so for those sales the cloud companies act as sales channels. They also buy Claude for their own use and for their own products, and for that they are customers in their own right.
The prospectus names no large customer. It mentions Salesforce and the legal-software company Legora as companies that have built products on Claude. It lists Accenture, Deloitte, KPMG, PwC and Snowflake as partners that bring Claude to their own clients. In August 2025 VentureBeat reported that Cursor, a coding editor, and GitHub Copilot, Microsoft's coding assistant, accounted for about $1.2 billion of the $4 billion of annualised revenue Anthropic had reached earlier that year. That fits the two large 2025 customers but does not identify them.
Who would control the company
Anthropic is a public benefit corporation, which must weigh its stated purpose, the responsible development of advanced AI, alongside returns to shareholders. After the listing it would have five classes of shares:
- Class A, the shares being sold, with one vote each.
- Class N, held mainly by strategic business partners, with the same economic rights as Class A but no vote. These shares convert into Class A when sold to an unrelated buyer.
- Class T, held by the Long-Term Benefit Trust, a body of trustees with no financial stake in the company. Through these shares the trust generally elects a majority of the board.
- Class F, a single share held by the seven co-founders, which carries 50.1% of the votes and no economic rights.
- Class E, for employees other than the co-founders, voting only on limited matters.
Because the Long-Term Benefit Trust can elect a majority of the board, Anthropic counts as a "controlled company" under Nasdaq rules, which exempts it from some board-independence requirements. Buyers of Class A shares would own part of the company's profits but have little say in how it is run.
What the filing leaves blank
The prospectus leaves out the price range, the number of shares on offer, third-quarter revenue, annualised revenue at 31 October and the total of its compute commitments. Figures for some of these have appeared in the press, but none is in the document:
- Valuation and raise size: a valuation of $1.5 trillion to $2 trillion (CNBC) and a raise of $100 billion or more (Wall Street Journal). The last private funding round, in May, valued Anthropic at $965 billion.
- Third-quarter results: revenue of $16.8 billion, a profit on an adjusted basis and a gross margin of 85%. Bloomberg reported these on 15 October, citing people who saw an investor presentation. The revenue figure is for a single quarter, not comparable with the six-month figure above.
- Implied share price: about $71.43, which Protos worked out by dividing a $2.0 billion third-quarter charge for matching employees' charitable share donations by the roughly 28 million shares issued to settle it. It is the value the accounts put on those shares, not an offer price.
Why a private company's accounts moved listed chip makers
The figure that matters for suppliers is in the notes to the accounts. Since the end of 2025, Anthropic has signed leases and purchase agreements with future minimum payments of about $417 billion, mainly for chips and data centres, with terms of up to 20 years. That is more than twenty times its first-half compute spending at an annual rate. The company names Amazon, Google, Microsoft and Broadcom among its compute suppliers, alongside Nvidia, Lambda, Nscale and others. Money paid to them flows on to the makers of what goes inside the servers: memory chips, test equipment, power and cooling (Anthropic S-1).
The main doubt about AI hardware has been that the biggest chip buyers, chiefly the large cloud companies, were spending before customers had shown they would pay for AI. Anthropic's first-half revenue was fourteen times its revenue a year earlier, and on the income statement it now earns more than it spends on compute, including the cost of training new models. That weakens the doubt. The shares that rose on 27 October sit along this supply chain:
- SK hynix (+5.18%) and Samsung Electronics (+4.23%) make the high-bandwidth memory used in AI accelerators.
- Advantest (+7.8%) makes the machines that test those chips.
- Schneider Electric (+3%) sells power and cooling equipment for data centres.
In New York the technology sector fund (XLK) rose 1.70%.
Two other things helped. The Kospi had closed at its lowest since 6 April the day before, so part of its 3.09% gain was a rebound. SK hynix and Samsung also report results on 28 and 29 October, and Microsoft, Alphabet and Amazon report this week. Chinese chip makers, which do not supply the US companies building AI data centres, fell: the CSI Semiconductor Index lost 2.2%.
What the numbers do not settle
The operating margin is not yet a guide to future profits. Quarter by quarter, the operating loss turned into a profit as revenue outran a compute bill that had been fixed in advance:
| $ million | Q1 2025 | Q2 2025 | Q3 2025 | Q4 2025 | Q1 2026 | Q2 2026 |
|---|---|---|---|---|---|---|
| Revenue | 376 | 787 | 1,382 | 2,040 | 4,731 | 11,555 |
| Compute and infrastructure | 944 | 1,390 | 2,047 | 2,945 | 3,387 | 5,558 |
| Operating income | −935 | −1,200 | −3,089 | −2,836 | −1,667 | 974 |
| Operating margin | −249% | −152% | −224% | −139% | −35% | 8.4% |
Source: Anthropic S-1, quarterly results. The third quarter of 2025 includes a $1.5 billion legal settlement.
In the second quarter of 2026 Anthropic made an operating profit of $974 million, 8.4% of revenue, and Bloomberg's report of the third quarter puts its adjusted operating margin above 11%. The S-1 says compute is bought 12 to 18 months before it arrives and is "generally fixed in the near term". These margins therefore compare this year's revenue with capacity ordered in 2024 and 2025. The commitments signed in 2026 reach the income statement from 2026 and 2027. The Broadcom leases alone will cost about $32 billion a year in rent once all the equipment is running, against a compute bill running at about $22 billion a year in the second quarter.
The listing adds a second cost. Most employee share awards vest only when the company lists. Had it listed on 30 June, Anthropic would have recorded a $2.9 billion charge at once and another $23.7 billion over about two years, against personnel costs of $3.2 billion in the first half. Reported operating margins will therefore fall from the quarter of the listing. Whether they recover depends on revenue growing as fast as the contracted capacity arrives.
The $417 billion is an obligation as well as a list of future orders. Leases and purchase commitments of this kind generally have to be paid whether or not the capacity is used. If revenue growth slowed, the suppliers' future orders would become fixed costs for Anthropic.
The company says its revenue depends on releasing new models: models released in the six months to September produced more than 80% of revenue in the three months to September. Customers can also switch models. Since mid-October, Cursor's subscriptions have included only xAI's Grok models, with Claude still available but billed separately at API prices (cursor.com). That change came after the period covered by the prospectus, and whether Cursor is among Anthropic's largest customers is not confirmed.
The valuation will stay unknown until a price range is published. If the reported upper figure of $2 trillion were reached, Anthropic would be valued at about 60 times its first-half revenue at an annual rate.
What to watch
- An amended filing with a price range and share count. It would come before formal marketing begins, which could be as soon as the week of 9 November (Bloomberg).
- The trading debut, reported for the week of 16 November (Wall Street Journal).
- This week's results from SK hynix, Samsung, Microsoft, Alphabet and Amazon. They will show whether the spending that Anthropic's commitments imply is turning up in suppliers' orders.
Data sources: US Treasury par and real curves (27 Oct 2026) and FRED (policy rates, VIX, credit spreads, macro); ECB YC API (AAA curve, 26 Oct 2026) and ECB SPF (2026 Q3); equity indices, ETF P/E proxies, commodity futures, live yields, FX and US sector funds via Yahoo Finance (FX quoted at 18:28–18:38 CET); individual stock prices via Yahoo Finance; European, UK and Japanese bond yields, economic releases and news via web search.