2026 10 26
Global Financial Briefing — Monday, 26 October 2026
Figures reflect the 26 Oct close wherever close data exists. FX quotes and the French, UK, Japanese and Italian bond yields are evening quotes from the 26 October session; other figures are dated inline. The US Treasury curve is the 26 Oct close; the euro AAA curve is the 23 Oct curve, the ECB not having published 26 Oct yet.
Market Overview
Brazil had the day's one large move. President Lula won Sunday's runoff with 51.79% of valid votes against 48.21% for Flávio Bolsonaro, according to the electoral court, a result that, as one UBS analyst put it, caught most of the market by surprise; investors had positioned for a win by Bolsonaro, seen as more likely to curb public spending (Trading Economics; Rio Times). The exchange's circuit breaker suspended trading for 30 minutes at 10:03 Brasília time (Rio Times), and the Ibovespa, down more than 17% at its low, closed 13.88% lower at 176,608.23, its largest one-day fall since March 2020 (Exame; Canal Rural; Yahoo Finance). The dollar closed 8.21% higher at 5.40 reais, up from about 4.99 on Friday, so Brazilian shares lost more in dollars than in reais: the main US-listed Brazil fund, EWZ, fell 19.82% (Canal Rural; Yahoo Finance quotes). Bolsonaro has asked for the result to be annulled, and the National Treasury cancelled this week's auctions of fixed-rate and inflation-linked bonds (Trading Economics).
Elsewhere, US and European shares rose. The S&P 500 rose 0.70% and the Nasdaq 100 1.09%, with Tesla, Nvidia and Microsoft among the gainers, as oil eased on reports that Qatari mediators were in Tehran on Sunday working with the United States to calm the conflict with Iran (Yahoo Finance; Fortune). The December WTI contract (CLZ26) settled at $101.76, 1.46% below Friday's settlement, after rising nearly 16.5% over the previous four weeks (Marc to Market). In Europe the STOXX 600 rose 0.77%, the DAX 0.91% and the CAC 40 0.83%. French government bonds rallied after Moody's left France's rating unchanged on Friday evening: the 10-year yield fell 13 bp to 4.91% and its premium over Germany narrowed to about 154 bp from 169 bp on Friday (Trading Economics). Germany's Ifo business climate index rose to 90.2, slightly above forecasts. In Asia, Seoul and Tokyo fell on technology shares while Hong Kong and Shanghai edged up: the Kospi fell 1.46% and the Nikkei 225 0.80%, ahead of this week's results from Samsung Electronics and SK hynix (Aju Press).
US government bonds barely moved before Wednesday's Fed decision. The 10-year Treasury yield settled unchanged at 5.00%, the 2-year 1 bp lower at 4.68% and the 30-year 2 bp lower at 5.31% (US Treasury par curve, 26 Oct). On the morning of 26 October, markets implied only about a 10% chance of a Fed rate rise at this week's meeting, according to analyst Kyle Rodda, with attention on whether the Fed signals one for December (Yahoo Finance). The dollar firmed against every currency in the table (ICE dollar index +0.14%), and the yen was weakest, 0.40% lower at 157.44 per dollar.
Global Indices Snapshot
Americas
| Index | Level | Day Chg | Day Chg % | Source |
|---|---|---|---|---|
| S&P 500 | 7,676.77 | +53.09 | +0.70% | yfinance ^GSPC |
| Nasdaq 100 | 29,273.40 | +315.88 | +1.09% | yfinance ^NDX |
| Dow Jones | 52,361.58 | +146.38 | +0.28% | yfinance ^DJI |
| Brazil IBOV | 176,608.23 | −28,474.33 | −13.88% | yfinance ^BVSP |
Americas data reflects the 26 Oct close.
The S&P 500 is 0.27% below its 50-day average, 5.23% above its 200-day average and 2.14% below its 52-week high of 7,844.52. The Nasdaq 100 is 1.81% below its 50-day average and 6.66% below its 52-week high of 31,361.37; Tesla rose 5.21%, Nvidia 2.39% and Microsoft 1.54%, while Netflix fell 2.96% (Yahoo Finance quotes). The Dow, up 0.28%, is 0.13% above its 50-day average. In energy, Range Resources rose 17.66% after EQT agreed to buy it in an all-stock deal, 0.987 EQT shares for each Range share, worth about $12.8 billion (Bloomberg); EQT fell 1.40% (Yahoo Finance quotes). Brazil's Ibovespa, which on Friday stood 9.32% above its 50-day average, is now 5.95% below it and 2.59% below its 200-day average. Banks fell most: Banco do Brasil about 29% and Bradesco about 22% in Trading Economics' quotes, while the iron-ore miner Vale rose about 5% ahead of its results. Petrobras' US-listed shares fell 13.99% (Yahoo Finance quotes).
Europe
| Index | Level | Day Chg | Day Chg % | Source |
|---|---|---|---|---|
| Euro STOXX 600 | 640.66 | +4.89 | +0.77% | yfinance ^STOXX |
| CAC 40 | 7,847.32 | +64.50 | +0.83% | yfinance ^FCHI |
| DAX | 25,410.84 | +229.19 | +0.91% | yfinance ^GDAXI |
| FTSE 100 | 10,767.33 | +76.97 | +0.72% | yfinance ^FTSE |
| SMI (Swiss) | 14,538.95 | +76.59 | +0.53% | yfinance ^SSMI |
European data reflects the 26 Oct 2026 close.
European shares rose across the board, ending a two-day fall in the STOXX 600 on 22 and 23 October. The DAX's 0.91% gain came on a day when the Ifo survey showed German companies more hopeful about the next six months, and the CAC 40 rose 0.83%, in line with the rest of Europe, while French borrowing costs fell. The CAC 40 is still 3.31% below its 50-day average and 4.43% below its 200-day, the weakest major European index against its trend; the DAX is 0.82% below its 50-day average and 2.14% above its 200-day. The FTSE 100 is 0.57% above its 50-day average and 2.02% below its 52-week high of 10,989.50, two days before the UK budget. Switzerland's SMI is 3.07% above its 50-day average and 0.89% below its 52-week high of 14,669.51.
Asia-Pacific
| Index | Level | Day Chg | Day Chg % | Source |
|---|---|---|---|---|
| Nikkei 225 | 62,189.65 | −503.51 | −0.80% | yfinance ^N225 |
| Hang Seng | 23,211.81 | +118.44 | +0.51% | yfinance ^HSI |
| Shanghai Comp | 3,697.52 | +7.04 | +0.19% | yfinance 000001.SS |
| ASX 200 | 8,809.90 | +14.70 | +0.17% | yfinance ^AXJO |
| Kospi (Korea) | 5,469.47 | −80.83 | −1.46% | yfinance ^KS11 |
Asia-Pacific data reflects the 26 Oct 2026 close.
Seoul fell below 5,500 as foreign investors sold a net 816.5 billion won ($617.1 million) of Kospi shares; Samsung Electronics lost 1.16% to 213,000 won before its results, and SK hynix reports on 28 October (Aju Press; IBTimes). The Kospi is 17.13% below its 50-day average. The Nikkei 225 fell for a third session in a row since its 21 October close of 64,621.24, this time by 0.80%, with the chip-equipment makers Tokyo Electron and Advantest among the decliners; it is 6.02% below its 50-day average. Taiwan's market fell more than 1% (Marc to Market). Hong Kong and Shanghai edged up: the Hang Seng is 6.41% below its 50-day average and 3.08% above its 52-week low of 22,518.00, and the Shanghai Composite 3.45% above its 52-week low. Australia's ASX 200 rose 0.17%.
Emerging Markets
| Index | Level | Day Chg % | Source |
|---|---|---|---|
| MSCI EM (EEM) | 61.82 | −0.31% | yfinance EEM |
| India Nifty 50 | 22,753.20 | +0.68% | yfinance ^NSEI |
| South Africa | 63.49 | +0.55% | yfinance EZA |
Emerging-market data reflects the 26 Oct close.
EEM, which trades in New York after Asia has closed, fell only 0.31%, close to the mixed local closes: Korea −1.46% and Taiwan more than 1% lower, against Hong Kong +0.51%, Shanghai +0.19% and India +0.68%. Brazil's fall barely shows in the fund's day change. For a euro investor the euro's 0.11% fall against the dollar trimmed EEM's loss to about 0.2% in euros. A euro investor in a Brazil fund had no such cushion: the real fell against the euro as well as the dollar, so EWZ's 19.82% loss in dollars is close to the loss in euros. India's Nifty fell to 22,466 early in the day on Brent near $114 and the selling in Asian technology shares, then recovered to close 0.68% higher at 22,753.20 (Business Today; Yahoo Finance). South Africa's fund rose 0.55%.
Index Valuations & Investment Risk
Valuation Table
| Index | Trailing P/E (live) | 50-day avg | 100-day avg | 200-day avg |
|---|---|---|---|---|
| S&P 500 | 24.3x | 25.0x | 25.9x | — |
| Nasdaq 100 | 27.3x | 29.6x | 30.8x | — |
| Euro STOXX 600 | 17.7x | 17.7x | 18.1x | — |
| CAC 40 | 16.5x | 16.7x | 17.2x | — |
| DAX | 18.0x | 18.3x | 18.4x | — |
| FTSE 100 | 16.7x | 16.6x | 17.2x | — |
| Nikkei 225 | 16.3x | 20.9x | 21.9x | — |
| MSCI EM | 13.3x | 15.0x | 16.2x | — |
Averages of the daily trailing P/E readings recorded since 1 May 2026 (n = 118; 114 for the Nikkei proxy); shown for reference only. Trailing P/E is Yahoo Finance's trailing P/E for the ETF proxies SPY, QQQ, EXSA.DE, CAC.PA, EXS1.DE, ISF.L, 1321.T and EEM; the US-listed proxies are priced at the 26 Oct close.
Investment Risk Assessment for ETF Investors
United States (S&P 500 / Nasdaq ETFs)
The S&P 500's trailing P/E of 24.3x gives an earnings yield of 4.12% (1÷24.30). Against the settled 10-year Treasury yield of 5.00% (US Treasury par curve, 26 Oct) the earnings yield gap is −0.88 pp: a 10-year government bond pays more income than the index's earnings come to per dollar invested. Against the real 10-year yield of 2.66% (US Treasury real curve, 26 Oct) the gap is +1.46 pp; the 2.34 pp between the two is the correction for company earnings growing with inflation while a bond coupon is fixed. Only the part of earnings paid out as dividends and buybacks reaches a holder as cash. The Nasdaq 100 at 27.3x has an earnings yield of 3.67%, 1.33 pp below the 10-year Treasury. The S&P 500 at 7,676.77 sits just below its 50-day average. This week puts both legs of the comparison to the test: the Fed decides on 28 October, after raising its target range to 3.75–4.00% at its 15–16 September meeting (as cited in the 20 Oct briefing), and Microsoft, Alphabet and Amazon report, with investors watching how much more they plan to spend on AI (Yahoo Finance; Marc to Market).
Europe (STOXX 600 / CAC 40 / DAX ETFs)
The STOXX 600 at 17.7x gives an earnings yield of 5.65% (1÷17.70); against the euro AAA 10-year yield of 3.37% (ECB YC API, 23 Oct) the euro earnings yield gap is +2.28 pp, and today's 10-year Bund quote, also 3.37% (Trading Economics), gives the same figure. Against the euro-area real 10-year yield of 1.33% (see Real Yields below) it is +4.32 pp. The S&P 500 trades at a 37.3% P/E premium to the STOXX 600 (24.3x against 17.7x). Part of the difference between the US and euro gaps reflects different inflation and policy paths rather than different compensation for risk, which is why the real-yield versions are shown alongside.
France remains the region's main risk, though less acute than on Friday. The CAC 40 at 16.5x has an earnings yield of 6.05% (1÷16.52), 1.14 pp above the French 10-year yield of 4.91%; the DAX at 18.0x yields 5.56%, 2.19 pp over the Bund, and the FTSE 100 at 16.7x yields 5.99%, 0.64 pp above the 10-year gilt at 5.35%. Moody's decision on Friday to keep France's Aa3 rating and negative outlook rests on its expectation that a deficit-cutting 2027 budget is eventually adopted, possibly by decree or by forcing it through parliament without a vote, which would invite a no-confidence motion (rallies.ai; briefs.co); the National Assembly resumes debating the budget's revenue measures on 27 October (as cited in the 20 Oct briefing). Barclays questioned how long the relief would last, with the ECB and Fed decisions due this week and October inflation figures to follow (rallies.ai). A euro investor in euro-quoted funds has no exchange-rate effect on the quoted value, but the constituents earn much of their profit abroad, so their earnings in euros still move with the currency.
Japan (Nikkei / TOPIX ETFs)
The Nikkei proxy's P/E is 16.3x (earnings yield 6.14%), 3.35 pp above the 10-year Japanese government bond at 2.79% (Trading Economics). The Bank of Japan meets on 29–30 October and is expected to hold, with a rise possible in December (Trading Economics). The yen fell 0.40% against the dollar and about 0.3% against the euro today, so a euro investor in an unhedged Japan fund lost a little more than the index's 0.80%.
Emerging Markets (MSCI EM ETFs)
EEM trades at 13.3x, the cheapest index in the table and a 45.4% discount to the S&P 500. Today showed what the discount pays for: a single election took a fifth off the dollar value of Brazilian shares in a day. The Asian chip makers that dominate the index face their own test this week, with Samsung Electronics and SK hynix reporting as doubts about US AI spending persist. A further US rate rise in December, which markets expect (Marc to Market), would tend to draw money out of emerging markets and raise the cost of their dollar debts, whatever the investor's home currency; the currency conversion matters less for a euro holder, because the euro tends to fall against the dollar at the same time.
Overall Risk Score: - United States: High valuation risk / low margin of safety. A negative nominal earnings yield gap, a 10-year yield of 5.00%, and a Fed decision and the largest technology companies' results all due this week. - Europe: Moderate. Positive earnings yield gaps on both measures and a P/E well below the US; French borrowing costs eased after Moody's decision, but the 10-year still yields 4.91%, about 154 bp over Germany, and the budget is not yet passed. - Japan: Moderate. A P/E of 16.3x, with a BOJ meeting on 29–30 October. - Emerging Markets: Attractive relative valuation, with Brazil's election result now a realised loss for holders of Brazilian shares and the Korean chip makers' results due this week.
US Economic Indicators (FRED - authoritative)
| Indicator | Current | Prior | Delta | Reference Date | FRED Series |
|---|---|---|---|---|---|
| CPI YoY % | 3.72% | 3.35% | +0.36 pp | Sep 2026 (prior Aug) | CPIAUCSL |
| Core CPI YoY % | 2.57% | 2.45% | +0.12 pp | Sep 2026 (prior Aug) | CPILFESL |
| Unemployment Rate | 4.2% | 4.1% | +0.10 pp | Sep 2026 (prior Aug) | UNRATE |
| Nonfarm Payrolls | +29k | +133k | −104k | Sep 2026 (prior Aug), monthly chg | PAYEMS |
| 10Y TIPS Real Yield | 2.66% | 2.66% | 0 bp | 26 Oct 2026 (prior 23 Oct) | DFII10 (US Treasury real curve) |
Monday's US releases, the Chicago Fed activity index and the Dallas Fed manufacturing survey, rarely move markets; the first estimate of third-quarter GDP is due this week, with the Bloomberg median forecast at 3.0% annualised growth and the Atlanta Fed's tracking estimate at 3.5% (Marc to Market).
Other economic releases today (web search)
| Release | Actual | Consensus | Prior | Note |
|---|---|---|---|---|
| Germany Ifo business climate, Oct | 90.2 | 89.8-90.1 | 89.9 | beat; up from 88.8 in August; expectations 91.6 from 90.4, current assessment 88.8 from 89.5; manufacturing balance positive for first time in over three years (ifo; FXStreet; ActionForex) |
| Brazil presidential runoff, 25 Oct | Lula 51.79% | — | — | Lula beat Flávio Bolsonaro (48.21%); Bolsonaro seeks annulment; Ibovespa circuit breaker; USD/BRL closed at 5.40 (+8.21%); Treasury cancelled fixed-rate and inflation-linked auctions (TSE via Trading Economics; Rio Times; Canal Rural) |
The Ifo index asks German companies how they judge their current business and what they expect over the next six months, and today's rise came entirely from expectations, which rose to 91.6 from 90.4, while the assessment of current business fell to 88.8 from 89.5 (FXStreet). Manufacturers were more positive than negative for the first time in more than three years, on rising orders, while services turned slightly negative (ActionForex). ING's Carsten Brzeski said German economic resilience continues; higher energy prices and interest rates remain risks to the recovery (Euronews). The 10-year Bund yield rose 2 bp to 3.37%, which Trading Economics put down to weaker demand for safe assets.
Fixed Income & Bond Analysis
Policy Rates
| Central Bank | Rate | Source |
|---|---|---|
| Fed Funds (upper) | 4.00% | FRED DFEDTARU (26 Oct 2026) |
| Fed Funds (lower) | 3.75% | FRED DFEDTARL (26 Oct 2026) |
| Effective FFR | 3.88% | FRED DFF (23 Oct 2026) |
| ECB Deposit Rate | 2.50% | FRED ECBDFR (26 Oct 2026) |
| BOJ Policy Rate | 1.25% | web search (raised to 1.25% in Sep 2026, effective 24 Sep; next decision 30 Oct) |
| BOE Bank Rate | 3.73% | FRED IUDSOIA (22 Oct 2026) |
The Fed raised its target range to 3.75–4.00% at its 15–16 September meeting (as cited in the 20 Oct briefing) and decides on 28 October; markets expect it to hold this week and raise rates in December (Marc to Market), with about a 10% chance of a rise this week on the morning of 26 October, according to Kyle Rodda (Yahoo Finance). The ECB raised its deposit rate to 2.50% on 10 September, its second rise this year after June's move to 2.25% (as cited in the 20 Oct briefing), and decides on 29 October, when it is expected to hold before a possible rise in December (Marc to Market). The BOJ raised its rate to 1.25% on 18 September (as cited in the 21 Oct briefing) and announces its decision on 30 October. The Bank of England held Bank Rate at 3.75% on 17 September (as cited in the 21 Oct briefing) and meets next on 5 November.
Government Bond Yields
| Country | 2Y Yield | 10Y Yield | 30Y Yield | Day Chg (10Y) | Source |
|---|---|---|---|---|---|
| USA | 4.68% | 5.00% | 5.31% | 0 bp | US Treasury par curve (26 Oct 2026) |
| Germany | 3.09% | 3.37% | 3.70% | +2 bp | web (Trading Economics, 26 Oct 2026 intraday) |
| France | 3.73% | 4.91% | 5.40% | −13 bp | web (Trading Economics, 26 Oct 2026 intraday) |
| UK | 4.95% | 5.35% | 5.75% | −1 bp | web (Trading Economics, 26 Oct 2026 intraday) |
| Japan | 1.88% | 2.79% | 3.81% | −1 bp | web (Trading Economics, 26 Oct 2026 intraday) |
| Italy | — | 4.50% | — | −9 bp | web (Trading Economics, 26 Oct 2026 intraday) |
The USA day change is against the 23 Oct 2026 curve from the same feed.
Yield Curve Spreads (US Treasury par curve, 26 Oct 2026): - 10Y-2Y spread: +32 bp, positive, 7 bp outside the ±25 bp flat band and under the 75 bp steep threshold, +1 bp on the day. - 10Y-3M spread: +78 bp, positive, no recession signal, unchanged on the day.
OAT-Bund Spread: 154 bp (10-year OAT 4.91% against Bund 3.37%, Trading Economics, 26 Oct 2026 intraday).
The US spreads are what investors normally demand for lending for longer and do not signal an expected recession. On 26 October the 10-year settled unchanged at 5.00%, the 5-year rose 2 bp to 4.84% and the 30-year fell 2 bp to 5.31% (US Treasury par curve). Friday's 10-year close of 4.988% in market quotes was its first weekly close below 5% since mid-September (Marc to Market).
In Europe, France's 10-year yield fell 13 bp to 4.91% and its premium over Germany narrowed to about 154 bp from about 169 bp on Friday, the first full session after Moody's left France's Aa3 rating unchanged (Trading Economics). Other reports measured a smaller narrowing, 5 to 11 bp, to between 156 and 161 bp, and one put the 10-year at 4.976%, having reached 5.14% on Thursday, its highest since June 2002 (FXStreet; rallies.ai); the quotes differ by source and time of day, but all show French bonds outperforming German ones. France's 2-year to 30-year yields all fell, by 6 to 13 bp (Trading Economics). Italy's 10-year fell 9 bp to 4.50%, about 113 bp over Germany, while the Bund rose 2 bp to 3.37%. The UK 10-year gilt eased 1 bp to 5.35% ahead of Wednesday's budget, which traders expect to stay within the government's borrowing rules (Trading Economics). Japan's 10-year, at 2.79%, is near its lowest since early August (Trading Economics).
Yield Curve Charts
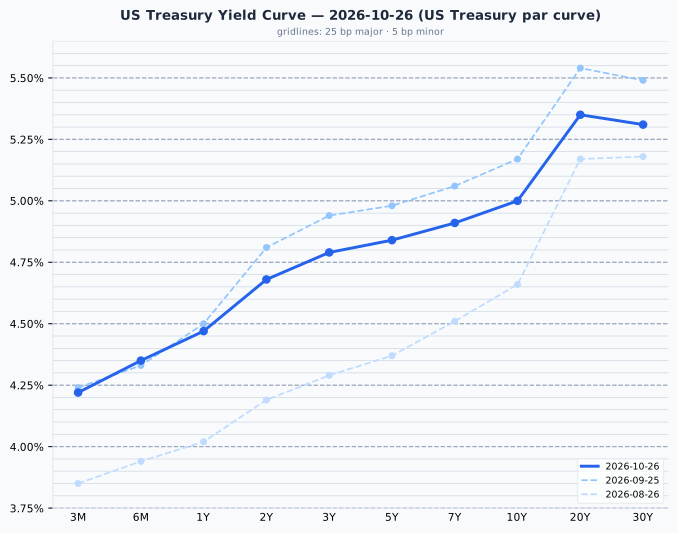
US Treasury par curve, 26 Oct 2026: 3M 4.22%, 6M 4.35%, 1Y 4.47%, 2Y 4.68%, 3Y 4.79%, 5Y 4.84%, 7Y 4.91%, 10Y 5.00%, 20Y 5.35%, 30Y 5.31%; 2-to-10 slope +32 bp. Day change against the 23 Oct 2026 curve: 3M 0 bp, 6M +5 bp, 1Y +3 bp, 2Y −1 bp, 3Y +4 bp, 5Y +2 bp, 7Y +2 bp, 10Y 0 bp, 20Y −2 bp, 30Y −2 bp. The 3-month bill at 4.22% is +34.5 bp from the Fed Funds midpoint of 3.875%, more than the usual 25 bp.
The US curve rises from 4.22% at three months to 5.35% at 20 years, with the 30-year 4 bp below the 20-year. Against 25 September the 2-year is 13 bp lower, the 10-year 17 bp lower and the 30-year 18 bp lower, so the 2-to-10 slope has narrowed from 36 bp to 32 bp, with yields falling most at the longer maturities. The 3-month bill's 34.5 bp gap over the Fed Funds midpoint is consistent with the bill pricing in the December rise that markets expect.
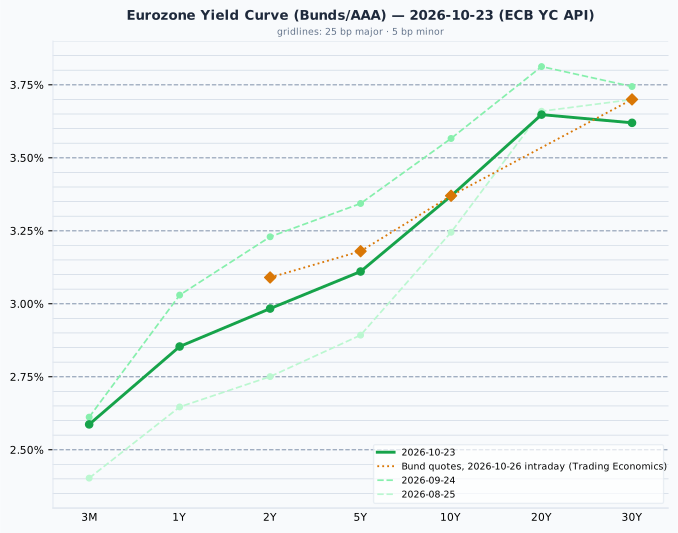
Euro area AAA government curve, 23 Oct 2026 (ECB YC API): 3M 2.59%, 1Y 2.85%, 2Y 2.98%, 5Y 3.11%, 10Y 3.37%, 20Y 3.65%, 30Y 3.62%; 2-to-10 slope +39 bp. Today's Bund quotes (Trading Economics, 26 Oct 2026), overlaid, differ from the plotted 23 Oct 2026 curve by at most 11 bp, at the 2Y (3.09% against 2.98%); the curve is the ECB's fitted AAA euro-area composite and the quotes are on-the-run Bunds, which sit a few basis points apart by construction, so only a gap well beyond that is a day move.
The euro AAA curve rises from 2.59% at three months to 3.65% at 20 years, with the 30-year 3 bp below the 20-year. Against 24 September it is 25 bp lower at two years and 20 bp lower at ten, so its 2-to-10 slope has widened from 34 bp to 39 bp. Today's 11 bp gap at two years between the Bund quote and the plotted curve is larger than the usual difference between the two instruments, and reflects in part the 5 bp rise in German 2-year yields since Friday's quotes (Trading Economics).
Credit Markets (from FRED - authoritative)
| Market | OAS | Obs. date | vs prior obs | Series ID |
|---|---|---|---|---|
| US Investment Grade | 91 bp | 23 Oct 2026 | +2 bp | BAMLC0A0CM |
| US High Yield | 338 bp | 23 Oct 2026 | −2 bp | BAMLH0A0HYM2 |
| Euro High Yield | 364 bp | 23 Oct 2026 | +10 bp | BAMLHE00EHYIOAS |
Change is 23 Oct 2026 vs 22 Oct 2026. Credit spreads are the 23 October close; today's session is not in them yet.
The extra yield on lower-rated US company bonds over Treasuries narrowed 2 bp to 338 bp on 23 October, in the lower half of the normal 300–500 bp range, while investment-grade spreads, at 91 bp, are near the bottom of their 80–150 bp range. Euro lower-rated bonds widened a further 10 bp to 364 bp, after 16 bp on 22 October. The VIX, the index of expected volatility in the S&P 500, closed at 19.45 on 23 October (FRED VIXCLS), a moderate reading, up from 19.03 on 22 October.
Real Yields (US and Euro Area)
| Region | Nominal 10Y | Expected inflation | Real 10Y | How the real yield is obtained |
|---|---|---|---|---|
| United States | 5.00% (US Treasury par curve, 26 Oct 2026) | 2.34% (residual: nominal − real) | 2.66% (US Treasury real curve, 26 Oct 2026) | Measured. TIPS trade, so the market quotes a real yield directly; expected inflation is the residual (the breakeven) |
| Euro area | 3.37% (ECB YC API, 23 Oct) | 2.04% (ECB SPF, 2026 Q3, measured) | 1.33% (residual: nominal − expected) | Constructed. No euro inflation-linked benchmark is published, so a survey expectation is subtracted from the nominal yield |
Only the US real yield is a market price; the euro figure is derived from a survey and is the softer of the two. Two mismatches apply when comparing them: the US breakeven includes a premium investors demand for inflation risk, which a survey does not, and the survey looks five years ahead against the bond's ten. The US leg is dated 26 October and the euro leg 23 October, the newest curve the ECB has published. The 163 bp gap between US and euro nominal 10-year yields splits into 30 bp of expected-inflation difference (2.34% against 2.04%) and 133 bp of real-rate difference (2.66% against 1.33%), so the gap is almost entirely real. The US real yield was unchanged on 26 October at 2.66%.
Why the US real-yield advantage is not a return a euro investor can capture
The US real yield has exceeded the euro one in every quarter since 2014, by 1.52 pp on average, and the 133 bp on these figures is under that mean. It is a structural feature (US trend growth, euro-area savings, the scarcity of German government bonds, heavy US government borrowing), not a return a euro-based reader can capture: hedging the currency removes it, because the forward exchange rate is set from the same interest differential, and holding Treasuries unhedged is a bet on the dollar rather than a bond decision. A real yield is real in its own currency; a US real yield of 2.66% is that much above US inflation, which is not a real return for someone who spends euros. The gap is stated here as a description of relative policy stance and growth expectations, and no portfolio conclusion is drawn from it.
Bond Portfolio Implications
A 10 bp rise in yields is an ordinary day's move. At the 26 Oct 2026 par yields it costs:
| Maturity | Yield | Modified duration | Loss for a 10 bp rise | Months of coupon lost |
|---|---|---|---|---|
| 2-year | 4.68% | 1.89 | 0.19% | 0.5 |
| 10-year | 5.00% | 7.79 | 0.78% | 1.9 |
| 30-year | 5.31% | 14.92 | 1.48% | 3.3 |
Months of coupon lost is the loss divided by one month of coupon (yield ÷ 12) on a par bond. Computed from the US Treasury par curve, 26 October.
The 10-year settled unchanged on 26 October, so the day cost a holder nothing in price.
The 30-year Treasury pays 0.63 pp more than the 2-year for nearly eight times as much price movement per 10 bp, and with the Fed, the ECB and the Bank of Japan all expected to weigh further rises in December, short maturities keep most of the income with far less exposure to a surprise at this week's meetings.
Currencies & Commodities
Currencies (Yahoo Finance live quotes)
| Pair | Rate | Day chg % | Source |
|---|---|---|---|
| EUR/USD | 1.1192 | −0.11% | yfinance (18:11 CET) |
| USD Index (DXY, ICE) | 101.96 | +0.14% | yfinance (18:02 CET) |
| USD/JPY | 157.44 | +0.40% | yfinance (18:12 CET) |
| GBP/USD | 1.3349 | −0.19% | yfinance (18:11 CET) |
| USD/CHF | 0.8271 | +0.36% | yfinance (18:12 CET) |
FX quotes as of 18:02–18:12 CET; day change vs the previous 17:00 ET close.
The dollar firmed against every currency in the table, the ICE dollar index rising 0.14% to 101.96. The yen fell most, 0.40% to 157.44 per dollar, followed by the Swiss franc, 0.36% lower at 0.8271. The euro slipped 0.11% to $1.1192 and the pound 0.19% to $1.3349, two days before the UK budget. Outside the table, the dollar closed 8.21% higher against the Brazilian real, at 5.40 reais (Canal Rural), and China's offshore yuan traded around 6.667 per dollar, its strongest since June 2022 (Marc to Market).
Commodities (Yahoo Finance front-month futures)
| Commodity | Price | Day Chg % | Ticker | Source |
|---|---|---|---|---|
| Brent Crude ($/bbl) | 110.74 | −0.86% | BZ=F | yfinance (BZF27, Jan) |
| WTI Crude ($/bbl) | 101.76 | −1.46% | CL=F | yfinance (CLZ26, Dec) |
| Gold ($/oz) | 4,038.40 | +0.76% | GC=F | yfinance (GCZ26, Dec) |
| Silver ($/oz) | 54.341 | +0.73% | SI=F | yfinance (SIZ26, Dec) |
| Copper ($/lb) | 6.542 | +0.53% | HG=F | yfinance (HGZ26, Dec) |
| Nat Gas ($/MMBtu) | 3.022 | −0.92% | NG=F | yfinance (NGZ26, Dec) |
Day changes are settlement (26 Oct 2026) vs the prior session's settlement (23 Oct 2026).
Every row shows the same contract as Friday's table, so the levels are comparable. Oil eased as Qatari mediation with Iran raised hopes of calmer relations (Fortune): the December WTI contract (CLZ26) settled at $101.76, 1.46% below Friday's settlement of $103.27, and the January Brent contract (BZF27) at $110.74, 0.86% below its $111.70 settlement. Most news reports quote the December Brent contract (BZZ26), which settled at $116.72 on Friday, up 3.1% and its highest in five months (Yahoo Finance), and at $115.81 on Monday, down 0.78%; it settled about $5 above January, meaning buyers pay more for oil delivered sooner. January Brent is 12.18% below the 52-week high of $126.10 set by an earlier contract (range $58.72 to $126.10), and December WTI 14.83% below its $119.48 high (range $54.98 to $119.48).
Gold rose 0.76% to $4,038.40, 27.7% below its all-time high of $5,586.20 set on 29 January 2026, after dropping to almost $3,975 earlier, its lowest since mid-July; silver rose 0.73% to $54.341, 55.2% below its all-time high of $121.30 set the same day, after touching a new low for 2026 near $53 (Marc to Market). Copper rose 0.53% to $6.542, slightly below its all-time high of $6.83 set on 22 September, 4.2% below it. Natural gas fell 0.92% to $3.022, in the lower part of its 52-week range of $2.483 to $7.827.
Sector & Theme Highlights
US sector funds (Select Sector SPDRs, 26 Oct close): technology (XLK) led, up 1.69%, with Nvidia up 2.39% and Microsoft 1.54%; industrials (XLI) rose 1.42% and consumer discretionary (XLY) 1.03%, with Tesla up 5.21% and Amazon 0.44%. Energy (XLE) rose 0.45% although oil fell. Communication services (XLC) was the weakest, down 1.57%, with Netflix down 2.96% and Verizon 3.49%, while Alphabet, which reports on Wednesday, fell 1.06% and Meta 1.88%. Consumer staples (XLP) fell 0.34%, health care (XLV) closed unchanged and utilities (XLU) were flat (Yahoo Finance quotes).
- Brazil's election: Lula's re-election reversed the bet on a Bolsonaro win; the Ibovespa fell 13.88%, its largest one-day fall since March 2020, and the dollar rose 8.21% against the real, with banks hit hardest.
- French borrowing costs: the first session after Moody's decision cut the French 10-year yield to 4.91% and its premium over Germany to about 154 bp.
- Oil: prices paused after four weeks of gains, on hopes for Qatari mediation with Iran; December WTI settled 1.46% lower at $101.76.
- A week of central banks and AI spending: the Fed (28 October), ECB (29 October) and Bank of Japan (30 October) decide, and Microsoft, Alphabet, Amazon, Samsung Electronics and SK hynix report, with investors watching AI spending plans.
- Gas producers merge: EQT agreed to buy Range Resources in an all-stock deal, creating what Bloomberg calls the largest US natural gas producer.
Top Stories (Global)
- Lula's re-election sinks Brazilian markets. Lula won 51.79% of the vote against 48.21% for Flávio Bolsonaro, who has asked for the result to be annulled; trading was halted for 30 minutes after the open, the Ibovespa closed 13.88% lower, its largest fall since March 2020, and the dollar rose 8.21% against the real (Trading Economics; Rio Times; Exame; Canal Rural; Yahoo Finance).
- French bonds rally after Moody's. The French 10-year yield fell 13 bp to 4.91% and its premium over Germany narrowed to about 154 bp from 169 bp on Friday, after Moody's left France's Aa3 rating and negative outlook unchanged (Trading Economics).
- German business confidence improves. The Ifo index rose to 90.2 from 89.9, with manufacturers more positive than negative for the first time in more than three years (ifo; ActionForex).
- EQT to buy Range Resources. The all-stock deal, worth about $12.8 billion, would create the largest US natural gas producer; Range shares rose 17.66% and EQT's fell 1.40% (Bloomberg; Yahoo Finance quotes).
- Wall Street rises, oil eases. The S&P 500 rose 0.70% and the Nasdaq 100 1.09% after Qatari mediators visited Tehran on Sunday; December WTI settled 1.46% lower at $101.76 (Yahoo Finance; Fortune).
- Seoul falls before chip results. The Kospi lost 1.46% to 5,469.47 as foreign investors sold a net $617 million of shares before Samsung Electronics' and SK hynix's results this week (Aju Press; IBTimes).
Looking Ahead
- Tuesday 27 October: the Fed's two-day meeting begins; the French National Assembly resumes its debate on the revenue measures of the 2027 budget (as cited in the 20 Oct briefing); Brazil's Treasury holds only its Selic-linked bond auction (Trading Economics).
- Wednesday 28 October: the Fed's decision; the UK budget; SK hynix's third-quarter results; Microsoft and Alphabet report after the Fed decision (Aju Press; Marc to Market).
- Thursday 29 October: the ECB's decision; Amazon, Intel and SanDisk report (Marc to Market).
- Friday 30 October: the Bank of Japan's decision and its quarterly outlook report (BOJ calendar, via web search).
- During the week: the first estimate of US third-quarter GDP, forecast at 3.0%; the Bank of Canada is expected to raise rates (Marc to Market).
- Further out: US midterm elections on 3 November; the euro-area flash inflation estimate for October on 4 November (as cited in the 19 Oct briefing); the Bank of England meets on 5 November.
Market closures - None in the next five days (27 Oct to 31 Oct 2026). - Further out: Brazil 2 Nov 2026 (Dia de Finados); Japan 3 Nov 2026 (Culture Day). - No Indian holiday data is available here, so Indian closures are not checked.
Special Analysis: Why Euro-Area Two-Year Yields Jumped Half a Point and Then Fell Back, August to October 2026
Added 26 October 2026. Between 25 August and 24 September the two-year yield on the euro area's top-rated (AAA) government bonds rose 48 bp to 3.23%, as the ECB raised its deposit rate to 2.50% and markets priced several more rises; by 23 October it had fallen back 25 bp to 2.98%, with markets expecting only one more rise even as oil and inflation kept climbing. Thirty-year yields moved much less, so the gap between short and long yields has narrowed since August, and the largest yield swings, at the short end, cost bondholders the least.
The three curves on the chart
The euro-area chart above draws the ECB's AAA curve on three dates a month apart. The ECB fits this curve to the bonds of the euro-area governments rated AAA, led by Germany, so it shows what the safest euro borrowers pay at each maturity, without the extra yield investors demand from France or Italy.
| Maturity | 25 Aug | 24 Sep | 23 Oct | 25 Aug to 24 Sep | 24 Sep to 23 Oct | Two months |
|---|---|---|---|---|---|---|
| 3-month | 2.40% | 2.61% | 2.59% | +21 bp | −2 bp | +18 bp |
| 1-year | 2.65% | 3.03% | 2.85% | +38 bp | −18 bp | +21 bp |
| 2-year | 2.75% | 3.23% | 2.98% | +48 bp | −25 bp | +23 bp |
| 5-year | 2.89% | 3.34% | 3.11% | +45 bp | −23 bp | +22 bp |
| 10-year | 3.24% | 3.57% | 3.37% | +32 bp | −20 bp | +12 bp |
| 20-year | 3.66% | 3.81% | 3.65% | +15 bp | −16 bp | −1 bp |
| 30-year | 3.70% | 3.74% | 3.62% | +4 bp | −12 bp | −8 bp |
| 2-to-10-year slope | 49 bp | 34 bp | 39 bp | |||
| 2-to-20-year slope | 91 bp | 58 bp | 66 bp |
ECB YC API, AAA euro-area curve (yields on zero-coupon bonds), as published for each date.
Over the two months, yields from one to five years rose by about 20 bp, the 10-year by 12 bp, and the 20- and 30-year ended where they started or lower. Most of the movement, in both directions, came between one and five years.
Why short yields move most when the ECB's path changes
A two-year bond's yield is close to the average deposit rate investors expect over the next two years, plus a small premium for lending for that long, so it follows expectations of ECB decisions closely. A 30-year yield averages expected rates over three decades, and with them what investors expect inflation to average over that span, so a rise expected to last a year or two changes it little. The gap between the two-year yield and the deposit rate is therefore a rough gauge of how much further tightening the market prices:
| Date | ECB deposit rate | AAA 2-year yield | Gap |
|---|---|---|---|
| 25 Aug | 2.25% | 2.75% | 50 bp |
| 24 Sep | 2.50% | 3.23% | 73 bp |
| 23 Oct | 2.50% | 2.98% | 48 bp |
Deposit rate: FRED ECBDFR. The gap also contains the premium for lending for two years, so it is a gauge rather than a count of rate rises.
By late October the market priced about as much further tightening as in late August, but from a deposit rate 25 bp higher. The two months come down to one rise delivered on 10 September, more rises priced on top of it during September, and most of those taken back in October.
August to September: an oil shock and a rate rise
Brent crude rose from about $87 a barrel on 25 August to $101 on 9 September (settlements of the nearest futures contract, Yahoo Finance). Europe imports nearly all its oil, so the rise fed straight into inflation forecasts. On 10 September the ECB raised its deposit rate 25 bp to 2.50%, its second rise of 2026 after June's move to 2.25%. Christine Lagarde called the decision a "no brainer", said the energy shock could intensify and its knock-on effects on wages and other prices could be larger than the ECB had assumed, and declined to discuss further moves; traders took that as a signal, and the further rises priced through April 2027 went from 51 bp before the announcement to 60 bp (as cited in the 10 Sep briefing). The AAA two-year yield rose 12 bp that day and another 10 bp on 14 September. The Fed and the Bank of Japan both raised rates the following week, on 16 and 18 September. By 29 September money markets priced about 100 bp of further ECB rises by late 2027 (Trading Economics, as cited in the 29 Sep briefing). The two-year peaked at 3.25% on 25 September and the 10-year at 3.63% on 28 September, while the 30-year rose only 4 bp over the month.
September to October: one more rise instead of several
The turn came on 1 October, the day France presented its 2027 budget. The German 10-year yield touched 3.65% in the morning, its highest since June 2009, then fell to 3.49% by late afternoon, and the German two-year fell 15 bp, which Trading Economics put down to demand for safe assets (as cited in the 1 Oct briefing). The ECB's curve for 1 October caught only part of that fall; across 1 and 2 October its two-year fell 17 bp and its 10-year 12 bp. The fall held on 2 October although September's flash inflation came in at 3.8%, above the 3.6% forecast and the highest since September 2023 (FXStreet, as cited in the 2 Oct briefing).
By 8 October markets fully priced only one further rise, and on 9 October they put the deposit rate at 2.72% by December, most of one 25 bp rise (Trading Economics, as cited in the 8 Oct and 9 Oct briefings). The ECB's account of its September meeting showed that markets had then priced 84 bp of further rises by the end of 2027, while the analysts the ECB surveys expected the rate to stay at 2.50% (as cited in the 8 Oct briefing). The second large fall came on 15 October, when Korea's Kospi fell 7.57% on worries about AI chip demand: investors sold technology shares and bought government bonds, US Treasuries rallied despite producer prices rising 1.3% in September (CNBC, as cited in the 15 Oct briefing), and the AAA 10-year fell 12 bp and the two-year 10 bp.
None of the briefings records a single announcement behind the change, and the inputs that drove September's rise kept rising: Brent settled at $111.70 on 23 October, and Eurostat confirmed September inflation at 3.8% on 16 October. What did change was investors' appetite for risk. The extra yield on lower-rated euro company bonds over government bonds widened from 277 bp on 24 September to 364 bp on 23 October (ICE BofA via FRED), and investors bought government bonds on the days shares fell hardest. Lagarde had said on 29 September that the rise in inflation had not yet produced significant knock-on effects on wages and other prices (Trading Economics). Taken together, the prices suggest the market moved from treating the oil shock mainly as an inflation problem the ECB would fight with several rises toward treating it also as a threat to growth that would hold the ECB to one more. That is an inference from prices, not something the ECB has said, and Governing Council member Gediminas Šimkus said in mid-October that a rise at this week's meeting was still possible (Trading Economics, as cited in the 15 Oct briefing).
Why the long end barely moved
The 30-year yield rose 4 bp in September and fell 12 bp in October, and the 20-year ended the two months 1 bp lower. Long yields depend mostly on where investors expect rates and inflation to settle over decades, and the long-run inflation expectation in the ECB's survey of professional forecasters stayed at 2.04% (2026 Q3 survey). A central bank that raises rates to meet an energy shock is expected to lower them again once the shock passes, so averaged over 30 years the rises add little. The result is a flatter curve: the gap between the two- and 20-year yields narrowed from 91 bp on 25 August to 66 bp on 23 October, though the curve still slopes upward, with longer loans paying more.
What the swings meant for a bondholder
A bond's price falls when its yield rises, by roughly the yield change multiplied by the bond's duration, a measure of how far in the future its payments fall on average. Short bonds have little duration, so the largest yield moves on the chart had the smallest effect on prices:
| Bond | Price change per 1 pp rise in yield | 25 Aug to 24 Sep | 24 Sep to 23 Oct |
|---|---|---|---|
| 2-year | about −1.9% | −0.9% | +0.5% |
| 10-year | about −8.4% | −2.7% | +1.6% |
| 30-year | about −18% | −0.8% | +2.2% |
Approximate, for a bond paying a coupon equal to its yield, using the AAA curve moves in the first table. Interest is excluded; at these yields it adds about 0.25–0.3% a month.
The 48 bp rise at two years, the largest move on the curve, cost a two-year holder under 1%, while the 12 bp fall in the 30-year yield in October gained its holder more than 2%. The coming week tests October's pricing: the ECB decides on 29 October, when it is expected to hold before a possible rise in December (Marc to Market), and October's euro-area flash inflation estimate follows on 4 November (as cited in the 19 Oct briefing). A clear signal of a December rise would mostly lift two- to five-year yields again, which would cost holders of short bonds little in price.
Data sources: US Treasury par and real curves (26 Oct 2026) and FRED (policy rates, VIX, credit spreads, macro); ECB YC API (AAA curve, 23 Oct 2026) and ECB SPF (2026 Q3); equity indices, ETF P/E proxies, commodity futures, live yields and FX via Yahoo Finance (FX quoted at 18:02–18:12 CET; Americas, US-listed and commodity rows at the 26 Oct close); US stock and ADR closes via Yahoo Finance; European, UK and Japanese bond yields, economic releases and news via web search.