2026 09 03
Global Financial Briefing — Thursday, 3 September 2026
Americas index levels, commodities and day changes reflect the 3 September closing print; the US Treasury row, curve spreads, real yields and the US yield curve chart use Treasury's settled 3 September par curve. FX, credit, policy rates, macro and the euro area bond rows are dated inline.
Market Overview
Risk assets and government bonds rallied together today, a combination that says more about policy expectations than about growth. US indices led: the S&P 500 closed up 1.06%, the Nasdaq 100 1.16% and the Dow 1.18%, while the Treasury curve richened, the 2-year settling 5.0 bp lower at 4.34% and the 10-year 2.0 bp lower at 4.77% (US Treasury par curve, 2026-09-03). The bond rally was real but modest, and notably smaller at the settlement than it had looked at midday: the easing bid faded into the close, and it was the front end rather than the belly that led. The proximate trigger was Fed Governor Christopher Waller, who indicated he would be inclined to support holding rates steady at the September meeting provided incoming inflation data keep improving. Markets read the conditional rather than the conclusion, and priced a Fed with a lower bar for easing later in the year.
The more informative move was in precious metals. Gold's front-month contract settled 2.84% higher and silver 3.42%, gains of a size that rarely accompany a pure equity rally. A softer dollar and lower real yields explain part of it; the rest looks like demand for a hedge against the easing path the equity market is celebrating. Note the tension sitting underneath: the 3-month bill yields 3.89%, above the top of the Fed's own 3.50-3.75% target range, so the very front end is not pricing imminent cuts even as gold behaves as though it is. One of those two prices is wrong. Meanwhile US headline CPI at 3.30% sits 84 bp above core at 2.47%, a wedge driven by energy with WTI settling at $91.30 and Brent at $95.52. Waller's condition, that inflation keep improving, is precisely the thing an oil market at these levels can undo.
Europe closed higher but narrowly, the STOXX 600 up 0.49%, the DAX 0.63% and the FTSE 100 0.70%, while the CAC 40 managed only 0.07% and remains the region's laggard. France is the reason: the 10-year OAT at roughly 4.25% sits about 87 bp over the Bund and close to levels last seen in 2008, and the French-Italian spread has now converged inside 10 bp, which is a remarkable repricing of relative sovereign risk within the euro area. Asia was the one soft spot, with the Nikkei off 0.17% and the Hang Seng 0.39%, as the yen extended a rally (USD/JPY down 0.78% to around 158.93) on reports the BOJ is weighing a hike to 1.25% on 18 September. The long end remains the standing problem everywhere that is not the euro area: the US 30-year settled at 5.25% and the 30-year gilt at 5.38%. The US long end gave up only 2 bp against the 2-year's 5 bp, so what looked like a broad rally was in substance a front-end one.
Global Indices Snapshot
Americas
| Index | Level | Day Chg | Day Chg % | Source |
|---|---|---|---|---|
| S&P 500 | 7,747.71 | +81.11 | +1.06% | yfinance ^GSPC |
| Nasdaq 100 | 29,482.32 | +338.99 | +1.16% | yfinance ^NDX |
| Dow Jones | 53,686.11 | +624.16 | +1.18% | yfinance ^DJI |
| Brazil IBOV | 185,188.12 | -16.98 | -0.01% | yfinance ^BVSP |
Americas data reflects the 3 Sep close.
Brazil is the one Americas index that reversed: the IBOV was up 0.34% at midday and finished fractionally lower, giving back the entire gain in the afternoon.
Europe
| Index | Level | Day Chg | Day Chg % | Source |
|---|---|---|---|---|
| Euro STOXX 600 | 649.10 | +3.19 | +0.49% | yfinance ^STOXX |
| Euro STOXX 50 | 6,382.59 | +20.44 | +0.32% | yfinance ^STOXX50E |
| CAC 40 | 8,286.40 | +5.77 | +0.07% | yfinance ^FCHI |
| DAX | 26,003.32 | +163.99 | +0.63% | yfinance ^GDAXI |
| FTSE 100 | 10,831.52 | +75.07 | +0.70% | yfinance ^FTSE |
| SMI (Swiss) | 14,394.77 | +31.80 | +0.22% | yfinance ^SSMI |
European data reflects today's close (3 Sep).
Asia-Pacific
| Index | Level | Day Chg | Day Chg % | Source |
|---|---|---|---|---|
| Nikkei 225 | 64,214.48 | -111.16 | -0.17% | yfinance ^N225 |
| Hang Seng | 25,213.31 | -97.90 | -0.39% | yfinance ^HSI |
| Shanghai Comp | 3,942.09 | +0.70 | +0.02% | yfinance 000001.SS |
| ASX 200 | 9,020.10 | +41.70 | +0.46% | yfinance ^AXJO |
| Kospi (Korea) | 6,579.48 | +16.76 | +0.26% | yfinance ^KS11 |
Asia-Pacific data reflects today's close (3 Sep).
Emerging Markets
| Index | Level | Day Chg % | Source |
|---|---|---|---|
| MSCI EM (EEM) | 67.47 | +0.48% | yfinance EEM |
| India Nifty 50 | 23,873.45 | -0.17% | yfinance ^NSEI |
| South Africa | 71.82 | +2.61% | yfinance EZA |
EEM and EZA reflect the 3 Sep US close. The Nifty reflects the 3 Sep Indian close.
Data note: Yahoo Finance's prior-close figure for the Hang Seng, Shanghai Composite, ASX 200 and Nifty 50 lagged one session behind the figure their day change was measured against. The day changes shown were cross-checked against the previous session's closes and match exactly, so the percentages are sound and only the discarded figure was wrong.
Index Valuations & Investment Risk
Valuation Table
| Index | Trailing P/E (live) | Hist avg trailing P/E (†) | Premium to hist mid |
|---|---|---|---|
| S&P 500 | 26.04x | ~16-18x | +53.2% |
| Nasdaq 100 | 30.68x | ~25-30x | +11.6% |
| Euro STOXX 600 | 17.92x | ~15-17x | +12.0% |
| CAC 40 | 17.00x | ~14-16x | +13.3% |
| DAX | 18.83x | ~15-17x | +17.7% |
| FTSE 100 | 18.20x | ~13-15x | +30.0% |
| Nikkei 225 | 21.63x | ~20-22x | +3.0% |
| MSCI EM | 17.46x | ~13-15x | +24.7% |
(†) Hist avg trailing P/E: static long-run reference constants, not live data.
Trailing P/E (live): yfinance trailingPE on ETF proxies (SPY, QQQ, EXSA.DE, CAC.PA, EXS1.DE,
ISF.L, 1321.T, EEM). Premium computed against the midpoint of the historical range; bold marks
a premium above 20%.
The striking feature is where the stretch is and is not. The S&P 500 at 26.04x carries a 53% premium to its long-run average, comfortably past the 40% threshold that counts as historically stretched. The Nasdaq 100 at 30.68x, by contrast, is only 12% above its own average, because that average is already high. In other words the concentration problem now shows up in the broad index rather than the tech index: the S&P has come to resemble the Nasdaq without its historical valuation allowance. The FTSE 100 at 18.20x is the quiet surprise, a 30% premium on an index that spent two decades as the developed world's value trade, and MSCI EM at 17.46x is 25% above its average, which erodes much of the traditional EM discount.
Investment Risk Assessment for ETF Investors
United States (S&P 500 / Nasdaq ETFs)
The S&P's earnings yield is (1÷26.04) = 3.84%, against a 10-year Treasury at 4.77% (US Treasury par curve, 2026-09-03). That is an earnings yield gap of -0.93 pp: on the closing prices, the Treasury pays nearly a full point more current yield than the index earns. Corrected onto a real basis against the 10-year TIPS yield of 2.42% (US Treasury real curve, 2026-09-03), the gap is +1.42 pp. The size of that correction, 2.35 pp, is larger than the gap itself and flips its sign, which is the honest way to present this measure: the nominal version understates equities by roughly expected inflation, because earnings grow with prices while a coupon does not. Neither figure forecasts anything about forward returns.
The index sits 0.88% below its record high of 7,816.70 and above both its 50-day (7,576.70) and 200-day (7,131.47) moving averages, so the technical picture is intact. The risks are the familiar ones: a 53% valuation premium leaves little margin of safety, concentration in a handful of AI-levered names means index-level earnings are less diversified than the ticker count suggests, and with real yields at 2.42% the discount rate applied to distant earnings is no longer forgiving.
Europe (STOXX 600 / CAC 40 / DAX ETFs)
The STOXX 600 earnings yield is (1÷17.92) = 5.58%, against a 10-year Bund of 3.38% and an ECB AAA 10-year of 3.39% (ECB YC API, 2026-09-02). The euro earnings yield gap is +2.19 pp nominal and +4.23 pp against the constructed euro real 10-year of 1.36%. On both measures Europe offers materially more current compensation than the US, and the US trades at a 45% trailing P/E premium to the STOXX 600.
Part of that difference is not risk compensation at all, but the gap between US and euro-area inflation and policy paths, which is why the real-yield pair is given alongside it. That said, the decomposition below shows the nominal 138 bp yield gap is only 32 bp inflation and 106 bp real, so in this instance the currency and inflation story explains less of Europe's advantage than one might assume. The genuine European risks are political and fiscal rather than valuation: French budget uncertainty has the OAT near 2008 yield levels, and the CAC 40 is the one major index that barely moved today.
On currency: a euro-based investor in EUR-quoted European funds has no FX effect on the quoted value of the holding, but real currency exposure sits inside the earnings, since CAC 40 and STOXX 600 constituents are multinationals earning abroad. The exposure is smaller and slower than for a dollar holding, not absent.
Japan (Nikkei / TOPIX ETFs)
At 21.63x the Nikkei is the only index in the table close to fair value against its own history, a 3% premium. It is also 11.8% below its record high and trades below its 50-day average (66,828.83) while holding above its 200-day (58,840.83). The live issue is policy: the BOJ is reported to be weighing a hike to 1.25% on 18 September, with roughly 58% implied probability, and the yen has already rallied 0.78% in anticipation. For an unhedged euro or dollar investor a firmer yen adds to returns while tighter policy subtracts from the equity leg, so the hedging decision matters more here than the valuation call. Corporate governance reform remains a genuine multi-year support.
Emerging Markets (MSCI EM ETFs)
EEM at 17.46x is 25% above its long-run average, so the standard case for EM as a valuation discount to developed markets is much weaker than usual: against the S&P's 26.04x a discount remains, but against Europe at 17.92x there is essentially none. China is the largest single weight and the Shanghai Composite was flat today, sits below its 200-day average and is 35.6% below its all-time high. EEM's own gain of 0.48% owes more to the dollar wrapper than to strength in the underlying markets. South Africa was the day's standout at +2.61%, which is a precious metals story rather than a domestic one, given gold and silver's moves.
Overall Risk Score: High valuation risk in the US, moderate elsewhere. The S&P 500 combines a 53% valuation premium with a negative nominal earnings yield gap and real yields near 2.5%, which is a low margin of safety on any reading. Europe and Japan are closer to fair value with positive earnings yield gaps, and their principal risks are political and monetary rather than valuation. Emerging markets no longer offer the discount that usually justifies the additional currency and political risk.
Disclaimer: This is financial information, not personalised investment advice. Past valuations do not guarantee future returns. Consult a financial advisor before investing.
US Economic Indicators (FRED - authoritative)
| Indicator | Current | Prior | Delta | Reference Date | FRED Series |
|---|---|---|---|---|---|
| CPI YoY % | 3.30% | — | — | Jul 2026 | CPIAUCSL |
| Core CPI YoY % | 2.47% | — | — | Jul 2026 | CPILFESL |
| Unemployment Rate | 4.1% | — | — | Jul 2026 | UNRATE |
| Nonfarm Payrolls | -23k m/m | — | — | Jul 2026 | PAYEMS |
| 10Y TIPS Real Yield | 2.42% | — | — | 2026-09-03 | DFII10 |
Note: FRED macro data is monthly and lags 4-6 weeks; the reference month is shown. NFP is the month-over-month change. Total payrolls stand at 158,858k.
Two things deserve emphasis. First, July payrolls contracted by 23,000, and combined with a disappointing ADP print this week that is the strongest argument for the easing the gold market is pricing. Second, the 84 bp wedge between headline CPI at 3.30% and core at 2.47% is an energy story, and with crude in the low 90s it is the wedge, not core, that threatens Waller's "inflation keeps improving" condition. The real yield is quoted from the Treasury real curve, one business day ahead of FRED's own DFII10 series.
Other economic releases today: ISM Non-Manufacturing PMI came in at 55.4 against a 54.2 consensus and a 54.1 prior, the strongest services reading in six months, with business activity at 61.7, new orders at 60.9 and a 26th consecutive month of expansion. Initial jobless claims were 206k against a 205k consensus, edging up from a revised 204k and still historically low. The July trade balance was -$88.6bn against a -$86.40bn consensus, widening roughly 24% from June's -$71.2bn to the largest gap since March 2025, with exports down 2.1% on lower crude oil and nonmonetary gold sales. The S&P Global Services PMI actual is not covered here. The euro area published final August Services PMI at a consensus 51.6 against 51.7 previously, a marginal softening that keeps the composite barely in expansion, plus July retail sales. Friday's nonfarm payrolls report is the week's decisive release.
The ISM beat sits awkwardly with the day's price action. A services sector accelerating to a six-month high is not the picture that justifies pricing a lower bar for easing, and it cuts against the reading markets took from Waller. It is the labour market data, not the activity data, carrying that argument.
Fixed Income & Bond Analysis
Policy Rates
| Central Bank | Rate | Source |
|---|---|---|
| Fed Funds (upper) | 3.75% | FRED DFEDTARU (2026-09-03) |
| Fed Funds (lower) | 3.50% | FRED DFEDTARL (2026-09-03) |
| Effective FFR | 3.63% | FRED DFF (2026-09-01) |
| ECB Deposit Rate | 2.25% | FRED ECBDFR (2026-09-03) |
| BOJ Policy Rate | 1.00% | web search |
| BOE Bank Rate | ~3.73% | FRED IUDSOIA (SONIA proxy, 2026-09-01) |
The BOJ has been at 1.00% since late July, up from 0.75% in June, and is the only major central bank in a tightening cycle. The ECB at 2.25% and the Fed at 3.50-3.75% are both well below where they stood a year ago.
Government Bond Yields
| Country | 2Y Yield | 10Y Yield | 30Y Yield | Day Chg (10Y) | Source |
|---|---|---|---|---|---|
| USA | 4.34% | 4.77% | 5.25% | -2.0 bp | US Treasury par curve (2026-09-03) |
| Germany | 2.91% | 3.38% | 3.78% | — | ECB AAA curve (2026-09-02); 10Y web |
| France | — | 4.25% | — | — | web |
| UK | 4.00% | 5.23% | 5.38% | — | web |
| Japan | — | 3.02% | 4.18% | — | web |
| Italy | — | 4.22% | — | — | web |
All three US maturities and the day change share the settlement date 2026-09-03, computed against the prior session (2026-09-02), when the 10-year stood at 4.79%. These are the same settled figures quoted in the Market Overview. German 2Y and 30Y are the ECB AAA composite rather than literal Bunds, which is why the AAA 10-year (3.39%) differs marginally from the Bund print (3.38%).
The UK is the outlier in this table: a 10-year gilt at 5.23% is 46 bp above the equivalent Treasury and 185 bp above the Bund, and the 30-year at 5.38% is the highest long yield among major sovereigns. Japan's 10-year at 3.02% would have been unthinkable three years ago and is the clearest single measure of how far the BOJ's normalisation has travelled.
Yield Curve Spreads: - 10Y-2Y spread: +43 bps (US Treasury par curve, 2026-09-03), recomputed from the levels above. Positive and normally sloped, though not steep: a 43 bp gap sits between the ±25 bp band that would count as flat and the ~75 bp that would count as steep. - 10Y-3M spread: +88 bps (same source and date). Comfortably positive, so the classic recession signal is not firing.
Both spreads carry a caveat worth stating. The 3-month bill at 3.89% is 26.5 bp above the Fed funds target midpoint of 3.625%, and above the 3.75% top of the range. A front end priced through the policy rate is not consistent with imminent cuts, so the positive 10Y-3M spread is being produced by a high long end rather than by a market expecting easing. That is a different, and less comfortable, kind of normal curve.
OAT-Bund Spread: approximately 87 bp (France 10Y 4.25% against Bund 3.38%, 2026-09-02), consistent with 83.6 bp on 21 August and 85.7 bp on 27 August. French yields are near their highest since 2008 as budget and debt trajectory risks persist. The more notable development is the France-Italy convergence: at 4.25% against 4.22%, France now borrows at essentially the same cost as Italy, and the spread between them has repeatedly traded inside 10 bp. For a France-based investor that is the single most important number in this briefing, because it prices French sovereign risk as no longer distinguishable from the euro area's traditional problem credit.
Yield Curve Charts
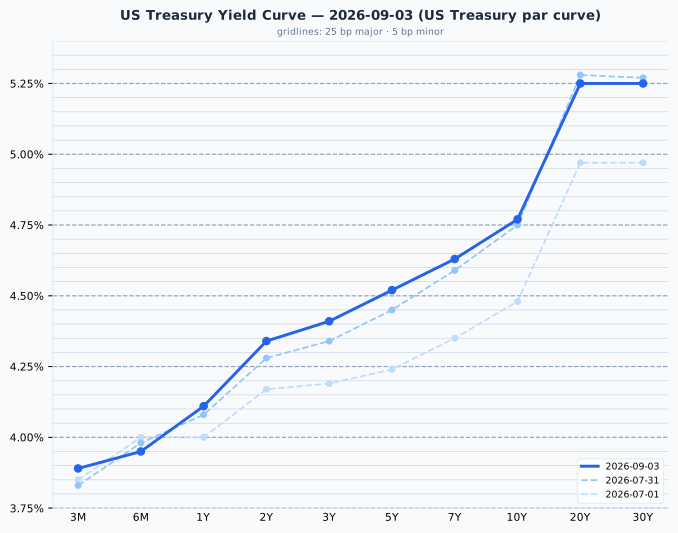
The US curve is upward sloping throughout, rising 136 bp from the 3-month at 3.89% to the 30-year at 5.25%, with a pronounced steepening beyond 10 years where the 10s30s segment alone accounts for 48 bp. Against a month ago (31 July) the curve has bear-flattened: the 2-year is 6 bp higher and the 3- and 5-year points 7 bp, while the 10-year is up only 2 bp and the 20- and 30-year are 3 and 2 bp lower, so the repricing has been concentrated in the part of the curve the Fed controls.
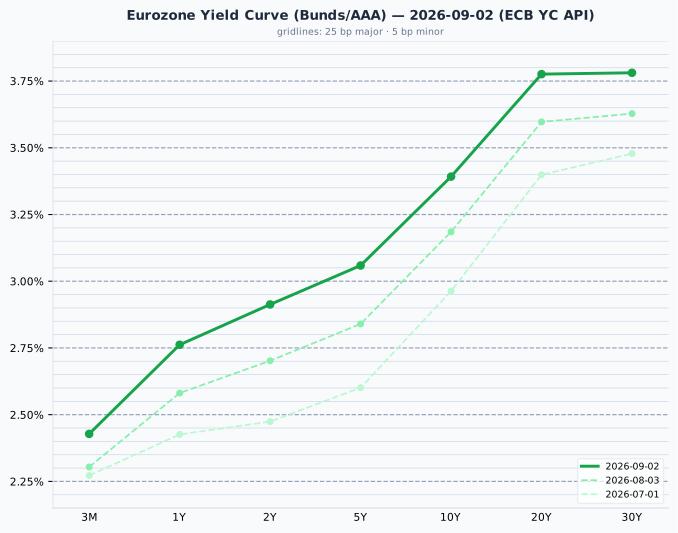
The euro AAA curve is also positively sloped and covers a similar 135 bp from the 3-month at 2.43% to the 30-year at 3.78%, but sits roughly 140 bp lower at the 10-year point. Since 3 August it has shifted up almost in parallel, by 12 to 22 bp, with the largest moves at 2 and 5 years and the smallest at 30 years, a mild flattening on an upward shift. The euro 2s10s at 48 bp is marginally steeper than the US equivalent.
Credit Markets (from FRED - authoritative)
| Market | OAS Spread | Series ID |
|---|---|---|
| US Investment Grade | 81 bp | BAMLC0A0CM |
| US High Yield | 266 bp | BAMLH0A0HYM2 |
| Euro High Yield | 262 bp | BAMLHE00EHYIOAS |
All three observed 2026-09-02. Every one of these is historically tight. US high yield at 266 bp is below the 300-500 bp band that constitutes normal and nowhere near the 500 bp that signals stress; investment grade at 81 bp is at the very floor of its 80-150 bp normal range. Euro high yield at 262 bp is tighter than its US counterpart, which is unusual. Credit is therefore pricing no meaningful default risk at all. The VIX at 15.20 (FRED VIXCLS, 2026-09-02) sits at the bottom of its moderate 15-20 band, so equity volatility is subdued without being extreme; it is the spreads rather than the VIX that carry the complacency signal here, and together they describe a market with very little compensation for anything going wrong. Tight spreads are not a forecast of trouble, but they do mean credit offers a poor risk-reward for taking on corporate balance sheet exposure today.
Real Yields (US and Euro Area)
| Region | Nominal 10Y | Expected inflation | Real 10Y | How the real yield is obtained |
|---|---|---|---|---|
| United States | 4.77% | 2.35% (residual) | 2.42% | Measured. TIPS trade, so the market quotes a real yield directly; expected inflation is the residual, the breakeven |
| Euro area | 3.39% | 2.04% (measured) | 1.36% | Constructed. No euro inflation-linked benchmark is published, so the ECB SPF survey expectation is subtracted from the nominal yield |
US figures from the Treasury real and par curves (2026-09-03); euro nominal from ECB YC API (2026-09-02); euro inflation expectation from the ECB Survey of Professional Forecasters, 2026 Q3.
The two rows are built in opposite directions, and only the US real yield is a price anyone actually trades. The euro figure is a nominal yield minus a survey, so it is the softer of the two and should be treated as such. Two mismatches follow from that: the US breakeven embeds an inflation risk premium that a survey does not, and the SPF horizon is five years against the bond's ten.
Decomposing the 138 bp nominal gap between the two regions gives 32 bp of expected-inflation difference and 106 bp of real rate difference. This is overwhelmingly a real rate story, not an inflation story, and the split is worth recomputing each time because it moves with the cycle.
The US-euro real rate gap is not an investment opportunity
The 106 bp real yield advantage in dollars is a structural feature, not a trade. Hedging the currency cancels it, because the forward rate is set precisely to remove the interest differential; unhedged, buying Treasuries for the real yield is a currency bet wearing a bond decision's clothing. A real yield is real in its own currency: 2.42% means 2.42% above US inflation, which is not a real return for someone who spends euros. The gap has persisted in every quarter since 2014, and that longevity is itself the evidence that it compensates risk borne by dollar investors rather than sitting unclaimed. State it as a macro fact about relative policy stance and trend growth, and draw no portfolio conclusion from it.
Bond Portfolio Implications
On current income alone, bonds win in the US and lose in Europe. The S&P 500 earnings yield of (1÷26.04) = 3.84% is 93 bp below the 4.77% Treasury, so a US investor is paid more to lend to the government than the index earns. In Europe the STOXX 600's (1÷17.92) = 5.58% is 219 bp above the AAA 10-year, so equities still offer the better current yield. Corrected onto real yields those become +1.42 pp and +4.23 pp respectively, both favouring equities, which shows how much the answer depends on whether inflation is netted out.
Two structural biases apply to every one of those numbers. The gap ignores growth: a coupon is fixed for a decade while the earnings behind the equity yield grow roughly with prices, which is why the real-yield version is the cleaner statement. And an equity holder does not receive the full earnings yield, only the dividend and buyback portion, with the remainder retained. Both matter when the comparison is framed as one of income, as it is here.
For the forward-looking question, the earnings yield measured against its own history carries predictive weight where the gap against bonds does not. On that measure the S&P at 3.84% is expensive: the reciprocal of the index's long-run average trailing P/E of 16-18x implies an earnings yield of roughly 5.6% to 6.3%, so today's figure is around a third below its own historical norm.
Duration risk deserves a specific mention with the long end where it is. A 100 bp rise in yields costs roughly 8-9% in price on a 10-year bond, and closer to 18-20% on a 30-year. With the US 30-year at 5.25% and the 30-year gilt at 5.38%, the long end offers the highest nominal yields in two decades alongside the largest capital loss if the current front-end rally proves premature. The 5-year at 4.52% captures most of the available yield with roughly half the duration exposure, which is where the risk-adjusted case is strongest today.
Currencies & Commodities
Currencies:
| Pair | Rate | Source |
|---|---|---|
| EUR/USD | 1.1598 | FRED DEXUSEU (2026-08-28) |
| USD Index | 118.75 | FRED DTWEXBGS (2026-08-28) |
| USD/JPY | 158.93 | web search (2026-09-02) |
| GBP/USD | 1.3500 | web search (2026-09-02) |
| USD/CHF | 0.8034 | web search (mid-August) ‡ |
‡ The USD/CHF print is a mid-August reference and is stale; no fresher quote was available. EUR/USD and the broad dollar index carry a 28 August observation date, FRED's latest.
The yen is the currency story: USD/JPY fell 0.78% to around 158.93 as the market moved to price a September BOJ hike, and a stronger yen with a softer dollar is the backdrop against which today's precious metals move should be read.
Commodities:
A futures contract has two closing prices each day, and the difference is not cosmetic. The last trade runs on until 23:00 CEST; the settlement is struck earlier in the afternoon and is what margin is marked against. The figures below are settlements, which is the market convention for a completed session and what the wires print.
| Commodity | Price | Day Chg % | Ticker | Source |
|---|---|---|---|---|
| Brent Crude | 95.52 | -0.12% | BZ=F | yfinance |
| WTI Crude | 91.30 | +0.32% | CL=F | yfinance |
| Gold ($/oz) | 4,539.90 | +2.84% | GC=F | yfinance |
| Silver ($/oz) | 67.70 | +3.42% | SI=F | yfinance |
| Copper ($/lb) | 6.665 | +1.08% | HG=F | yfinance |
| Nat Gas ($/MMBtu) | 2.913 | -1.45% | NG=F | yfinance |
Day changes are settlement to settlement: the 3 Sep settlement against the 2 Sep settlement, both on the same contract in every case.
Precious metals were the day's real move. Gold settled at $4,539.90, 18.7% below its all-time high of $5,586.20, set on 29 January 2026, which is also its 52-week high; the 2.84% gain is a recovery within a substantial drawdown, not a run at the record. Silver settled at $67.70, 44.2% below its all-time high of $121.30, set the same day, with a 52-week range of $40.87 to $121.30 that captures just how violent this market has been. Both metals rose on a softer dollar and lower real yields, but neither is near its high and the "near record" framing some coverage is using does not survive contact with the numbers.
Copper is the genuine strength: settling at $6.665/lb it is 1.3% below its all-time high of $6.75, reached on 26 August 2026, so it sits at or near record levels. For an industrial metal that is a real signal about electrification and grid demand, and it sits oddly alongside a gold market pricing monetary anxiety.
Crude is elevated within its recent range rather than historically high. WTI settled at $91.30 in a 52-week range of $54.98 to $119.48 and Brent at $95.52 in a range of $58.72 to $126.10, both roughly 24% below their 52-week highs. The two diverged into the settlement: WTI held a 0.32% gain while Brent gave up its intraday rise and settled 0.12% lower, so the front-month spread narrowed slightly on the day. Their all-time highs date from July 2008 and say nothing useful about today's market. The level that matters is the one feeding the US headline CPI wedge discussed above. Note that all six generics have rolled to later contracts, with WTI now on the October contract (CLV26.NYM) and gold, silver and copper on December, so no imminent roll discontinuity is expected in the next few sessions.
Natural gas settled at $2.913/MMBtu, down 1.45%, and sits near the bottom of a 52-week range of $2.483 to $7.827, a reminder that the energy complex is not moving as one.
Crypto: no moves above the 3% reporting threshold today.
Sector & Theme Highlights
Best performing: precious metals and the equities levered to them. Silver's 3.42% and gold's 2.84% drove South African equities up 2.61% via EZA, easily the strongest index-level move in the briefing. US technology followed, with the Nasdaq 100's 1.16% outpacing the S&P, and US financials and small caps reportedly led the domestic rally, consistent with a lower-rates trade.
Worst performing: Japanese and Hong Kong equities, both modestly lower, with the Nikkei's 0.17% decline reflecting the yen's rally and imminent BOJ tightening rather than any domestic weakness. French equities were effectively flat, an underperformance of roughly 40 bp against the STOXX 600 that maps directly onto the OAT. Brazil belongs here too on the closing print: the IBOV surrendered a 0.34% midday gain to finish a whisker below unchanged, the only Americas index not to participate in the US rally.
Cross-market themes:
- Divergent central banks. The Fed is debating whether to hold or cut, the ECB sits at 2.25%, and the BOJ is the sole major bank preparing to hike. That divergence is now the dominant driver of currency moves, and by extension of unhedged equity returns.
- The long end is its own asset class. US 30-year at 5.25%, gilt at 5.38%, OAT near 2008 levels. The US long end gave up just 2 bp against the 2-year's 5 bp, which is the clearest evidence that long yields are being set by supply and fiscal risk rather than policy expectations.
- Electrification versus monetary hedging. Copper at record levels and gold in an 18.7% drawdown is an unusual pair, and suggests the industrial cycle and the monetary anxiety trade have decoupled.
- French fiscal risk repriced. The France-Italy 10-year spread inside 10 bp is a structural change in how the euro area's second largest economy is priced.
- Concentration in the broad index. The S&P's 53% valuation premium against the Nasdaq's 12% is the arithmetic of AI weight migrating into the broad benchmark.
Top Stories (Global)
- Fed's Waller leans toward a hold. Governor Christopher Waller said he would be inclined to support keeping rates steady at the September meeting if incoming inflation data continue to improve. The 10-year Treasury settled at 4.77%, down 2.0 bp, with the 2-year leading at -5.0 bp, as markets focused on the conditionality rather than the hold. The settled rally was materially smaller than the midday move had suggested.
- Equities and bonds rallied together as gold jumped. The S&P 500 and Nasdaq resumed their advance while Treasury yields fell and gold's front-month contract settled 2.84% higher, a combination that points to a repricing of the policy path rather than to improving growth expectations.
- BOJ is weighing a hike to 1.25%. Reports indicate the Bank of Japan is leaning toward a quarter-point increase at its 17-18 September meeting, with Governor Ueda signalling upside price risks and market-implied probability around 58%. The yen extended its rally, with USD/JPY down 0.78% to roughly 158.93.
- French bond yields sit near 2008 highs. Debt trajectory and budget risks have pushed the 10-year OAT to about 4.25%, roughly 87 bp over the Bund, and the France-Italy spread has converged inside 10 bp.
- July US payrolls contracted by 23,000. Combined with a disappointing ADP print this week, the labour market data have become the strongest argument for easing, and they raise the stakes considerably for Friday's nonfarm payrolls release.
- US services beat while the trade gap widened sharply. ISM Non-Manufacturing printed 55.4 against a 54.2 consensus, the strongest services reading in six months, and jobless claims came in at 206k against 205k expected. The July trade deficit widened roughly 24% to $88.6bn, the largest since March 2025. A services sector accelerating this way is hard to square with the easing the day's rally priced.
- Euro area services growth is barely positive. Final August Services PMI at a consensus 51.6 against 51.7 previously leaves the bloc's largest sector close to stagnation, which sits awkwardly with a euro curve that has shifted up 12 to 22 bp over the past month.
Looking Ahead
Central banks: - ECB Governing Council, 9-10 September, with the monetary policy decision and press conference on the 10th, hosted by the Bundesbank in Berlin. The deposit rate is 2.25%. - FOMC, 15-16 September, decision at 14:00 ET on the 16th, accompanied by the Summary of Economic Projections and the dot plot. This is the meeting Waller was addressing, and the dot plot will matter more than the decision. - Bank of Japan, 17-18 September, with a hike to 1.25% actively under consideration and roughly 58% priced.
Economic releases: - Friday 4 September: US nonfarm payrolls. The decisive release of the week, given July's 23,000 contraction and this week's soft ADP print. - Euro area July retail sales and final August PMIs have just been published; the next major euro data point is the ECB's own projection round on 10 September.
Market closures (from the holiday cache): - Monday 7 September: United States (Labour Day), Canada (Labour Day), Brazil (Independence Day). US markets closed, which shortens the week following payrolls. - Monday 21 September: Japan (Respect for the Aged Day). - Wednesday 23 September: Japan (Autumnal Equinox Day). - Thursday 24 September: South Korea (Chuseok). - No closures are listed for the UK, Germany, France, Australia or Switzerland in the next three weeks. India's entry in the holiday cache is empty, so Indian closures could not be checked and are not asserted either way.
Other: - Earnings season is between cycles, with the next major reporting wave beginning mid-October. - French budget negotiations remain the key European political risk, with the OAT-Bund spread the cleanest real-time gauge.