Global Financial Briefing — Wednesday, 12 August 2026
Americas index levels, commodities and day changes reflect the 12 August closing print. Fixed income, FX and macro figures are dated inline.
Market Overview
The session belonged to the US inflation print. July CPI landed almost exactly on consensus — +0.1% month-on-month, with the headline annual rate easing to 3.4% from 3.5% and core to 2.5% — and the absence of an upside surprise was itself the news. Treasury yields eased on the release and traders trimmed the odds of a Federal Reserve hike at the September meeting. US equities opened higher and the broad indices held most of the gain, led once again by the AI and cloud-infrastructure complex (CoreWeave, Super Micro Computer, Nebius). The S&P 500 closed up 0.26% at 7,748.50, leaving it 0.58% below its record, and the Nasdaq 100 outperformed at +0.74%. The Dow, however, gave back an early gain to finish fractionally lower at −0.04% — a small reversal, but one that leaves the day's US leadership even more concentrated in the AI complex than the intraday tape suggested. Brazil's Ibovespa reversed harder, from a small intraday gain to −0.23% at the close.
The day's largest move came from Seoul, not New York. The Kospi surged 3.68% as Samsung Electronics and SK Hynix each rose around 7% on shareholder-return announcements and renewed confidence in the AI memory supply chain — a move large enough to warrant a check, and it reproduces exactly against the prior close. It lifted the broader MSCI Asia Pacific index around 0.7%. Japan reopened after Monday's Mountain Day holiday and added 0.83%. The rest of Asia was mixed to softer: Hong Kong fell 0.83% and Shanghai edged up 0.32%.
Europe was the day's laggard, closing broadly lower before the US CPI reaction could feed through: the STOXX 600 slipped 0.16%, the CAC 40 lost 0.46% and the DAX 0.23%, with Switzerland's SMI down 0.86%. The divergence is largely a timing artefact — European cash markets shut at 17:30 CEST, hours before the US session found its footing — rather than a statement about European fundamentals. Underneath, the striking feature of the tape is how compressed risk pricing has become: the VIX at 15.3 sits just above the threshold separating low volatility from moderate, US high-yield spreads at 272 bps and investment-grade at 79 bps are both at or through the tight end of their long-run ranges, and every European index plus the S&P 500 and ASX 200 is within 1.5% of an all-time high (the Dow is 1.8% off, the Nasdaq 100 3.3%). That is a market priced for a benign outcome, which is what the CPI print delivered.
Global Indices Snapshot
Americas
| Index | Level | Day Chg | Day Chg % | Source |
|---|---|---|---|---|
| S&P 500 | 7,748.50 | +20.30 | +0.26% | yfinance ^GSPC |
| Nasdaq 100 | 29,742.60 | +217.13 | +0.74% | yfinance ^NDX |
| Dow Jones | 53,770.27 | −21.58 | −0.04% | yfinance ^DJI |
| Brazil IBOV | 167,491.06 | −383.58 | −0.23% | yfinance ^BVSP |
Americas data reflects the 12 Aug close.
Cross-check: FRED SP500 reports the 12 August S&P 500 close at 7,748.50, matching the
yfinance ^GSPC close to the cent.
Europe
| Index | Level | Day Chg | Day Chg % | Source |
|---|---|---|---|---|
| Euro STOXX 600 | 659.48 | −1.03 | −0.16% | yfinance ^STOXX |
| Euro STOXX 50 | 6,533.99 | −17.23 | −0.26% | yfinance ^STOXX50E |
| CAC 40 | 8,674.94 | −40.00 | −0.46% | yfinance ^FCHI |
| DAX | 26,331.07 | −60.35 | −0.23% | yfinance ^GDAXI |
| FTSE 100 | 10,833.15 | −11.04 | −0.10% | yfinance ^FTSE |
| SMI (Swiss) | 14,449.47 | −125.78 | −0.86% | yfinance ^SSMI |
European data reflects today's close (12 Aug).
Asia-Pacific
| Index | Level | Day Chg | Day Chg % | Source |
|---|---|---|---|---|
| Nikkei 225 ◊ | 67,524.06 | +553.84 | +0.83% | yfinance ^N225 |
| Hang Seng | 25,440.17 | −212.65 | −0.83% | yfinance ^HSI |
| Shanghai Comp | 3,946.68 | +12.58 | +0.32% | yfinance 000001.SS |
| ASX 200 | 9,209.40 | −41.20 | −0.45% | yfinance ^AXJO |
| Kospi (Korea) | 6,579.04 | +233.51 | +3.68% | yfinance ^KS11 |
Asia-Pacific data reflects today's close (12 Aug).
◊ Nikkei 225: the day change is measured against the 10 August close — the Tokyo exchange was shut on 11 August for Mountain Day (source: the Nager.Date holiday calendar).
Emerging Markets
| Index | Level | Day Chg % | Source |
|---|---|---|---|
| MSCI EM (EEM) | 66.46 | +1.57% | yfinance EEM |
| India Nifty 50 | 24,435.95 | −0.15% | yfinance ^NSEI |
| South Africa | 68.33 | −0.38% | yfinance EZA |
All three rows are 12 Aug closes. EEM extended its gain into the close while EZA fell slightly further.
Index Valuations & Investment Risk
Valuation Table
| Index | Trailing P/E (live) | Hist avg trailing P/E (†) | Premium to hist avg |
|---|---|---|---|
| S&P 500 | 26.03x | ~16–18x | +53.1% |
| Nasdaq 100 | 30.98x | ~25–30x | +12.6% |
| Euro STOXX 600 | 18.18x | ~15–17x | +13.6% |
| CAC 40 | 17.79x | ~14–16x | +18.6% |
| DAX | 19.07x | ~15–17x | +19.2% |
| FTSE 100 | 18.13x | ~13–15x | +29.5% |
| Nikkei 225 | 22.75x | ~20–22x | +8.3% |
| MSCI EM | 17.19x | ~13–15x | +22.8% |
(†) Static long-run reference constants — the only non-live figures in this
briefing. Live trailing P/E from yfinance trailingPE on ETF proxies (SPY, QQQ, EXSA.DE, CAC.PA,
EXS1.DE, ISF.L, 1321.T, EEM). Premium computed against the midpoint of the historical range.
Bold = more than 20% above the historical average.
The headline observation is that nothing on this list is cheap against its own history. Every one of the eight indices trades at a premium, and the dispersion is in the size of the premium rather than its direction. The S&P 500 at 26.0x against a ~17x long-run midpoint is the outlier at +53%, past the 40% "historically stretched" threshold. The FTSE 100 at +29.5% is the surprise — the index long treated as developed-market value now carries a materially higher premium to its own history than the DAX or CAC. MSCI EM at 17.2x has also lost most of its traditional discount: +22.8% against its history, and only a ~34% discount to the S&P where the long-run norm is nearer 20%. The Nasdaq 100, counter-intuitively, carries the smallest premium of the US pair at +12.6%, because its historical baseline was already high.
Investment Risk Assessment for ETF Investors
United States (S&P 500 / Nasdaq ETFs)
At 26.03x trailing, the S&P 500's earnings yield is 3.84% (1÷26.03). Against the 10-year Treasury at 4.72% (FRED DGS10, 2026-08-10) the earnings yield gap is −0.88 pp — a US investor buying the index today accepts a lower current yield than a Treasury note offers, plus equity risk. Measured against the real yield instead (DFII10 at 2.43%), the gap is +1.41 pp. The size of that correction — 2.3 pp, enough to flip the sign — is the point worth noting: which version you quote determines whether the comparison looks adverse or comfortable, and the real-yield version is the more apples-to-apples of the two. See the fixed income section for what this measure can and cannot support.
The index sits 0.58% below its all-time high, 3.3% above its 50-day moving average and 9.7% above its 200-day — a firmly intact uptrend with no technical stress. Risks are the familiar ones and none has been resolved: concentration in a handful of AI-levered mega-caps (today's leadership from CoreWeave, SMCI and Nebius is the same narrow engine), sensitivity to the real yield given a 26x multiple, and an inflation rate at 3.3–3.4% that is still above target and constrains how much easing the Fed can deliver. The July print was benign, not resolving.
Europe (STOXX 600 / CAC 40 / DAX ETFs)
The STOXX 600's 18.18x gives a 5.50% earnings yield (1÷18.18). Against the 10-year Bund at 3.06% the euro earnings yield gap is +2.44 pp; against the ECB AAA 10Y (3.18%) it is +2.33 pp. On a real basis — earnings yield less the constructed euro real 10Y of 1.14% — it is +4.36 pp.
On the face of it Europe offers roughly 3.3 pp more current-yield pickup over its sovereign than the US does. But a good part of that difference is simply the gap between US and euro-area policy and inflation paths rather than a difference in risk compensation, and the two regions' real yields are not built the same way (see Real Yields below). Europe also carries a genuinely smaller valuation premium: at +13.6% to its own history against the S&P's +53%, the relative case is better founded on that comparison than on the yield gap. Risks: the CAC's exposure to French fiscal politics via the OAT-Bund spread at 75.7 bps, plus energy-price sensitivity and the trade exposure of German industrials.
On currency: a euro-based investor in EUR-quoted European funds has no FX effect on the quoted value of the holding, but real currency exposure remains inside the earnings — CAC 40 and STOXX 600 constituents are multinationals earning substantially abroad. The exposure is smaller and slower-moving, not absent.
Japan (Nikkei / TOPIX ETFs)
22.75x is only +8.3% above the historical average — the cheapest major market relative to its own history on this list. The Nikkei sits 7.3% below its record but 17.4% above its 200-day average. The central variable is the BOJ: it hiked to 1% in June (the highest since 1995) and held there in late July on an 8–1 vote, with one member pushing for 1.25%, while guiding that core inflation will run "clearly above" 2% in the second half of the fiscal year. Further tightening would likely strengthen the yen — which cuts exporter earnings but raises unhedged returns for a euro investor. The hedge decision, not the equity call, dominates the outcome here. Corporate governance reform continues to support shareholder returns.
Emerging Markets (MSCI EM ETFs)
The traditional EM discount has substantially closed: 17.19x is +22.8% above its own history. EEM closed up 1.57%, helped by the Korean rally, and sits 7.1% below its high and right on its 50-day average. The index is heavily exposed to the same AI semiconductor complex driving developed markets (Korea and Taiwan), so it is less of a diversifier against that theme than its label suggests. China's weight remains the dominant swing factor, and Chinese equities are the conspicuous laggard — Hong Kong 24% below its record, Shanghai 35.6% below.
Overall Risk Score: High valuation risk / low margin of safety — most acute in the US.
No major market trades at a discount to its own history; credit spreads are at or through the tight end of long-run ranges; volatility sits at the low end of its moderate band. That combination leaves little cushion for disappointment. Relative preference on valuation grounds runs Japan → Europe → EM → US, though the US retains the earnings momentum. Nothing in today's data changes the picture; the CPI print removed a risk rather than improving the fundamentals.
Disclaimer: This is financial information, not personalised investment advice. Past valuations do not guarantee future returns. Consult a financial advisor before investing.
US Economic Indicators (FRED — authoritative)
| Indicator | Current | Prior | Delta | Reference Date | FRED Series |
|---|---|---|---|---|---|
| CPI YoY % | 3.30% | 3.46% | −0.16 pp | Jul 2026 | CPIAUCSL |
| Core CPI YoY % | 2.47% | 2.57% | −0.10 pp | Jul 2026 | CPILFESL |
| Unemployment Rate | 4.1% | 4.2% | −0.1 pp | Jul 2026 | UNRATE |
| Nonfarm Payrolls | −23k | +20k | −43k | Jul 2026 (m/m) | PAYEMS |
| 10Y TIPS Real Yield | 2.43% | 2.40% | +0.03 pp | 2026-08-10 | DFII10 |
FRED's CPI figures are computed on the seasonally-adjusted series (CPIAUCSL/CPILFESL), which is why they read 3.30% and 2.47% against the BLS headline prints of 3.4% and 2.5% quoted in the press — those are the non-seasonally-adjusted basis. Same data, different adjustment.
Two things stand out. First, disinflation is real but slow: headline is down 0.16 pp on the month and 0.86 pp from May's 4.17%, yet 3.3% is still well above the 2% target. Second — and less discussed today — July payrolls fell by 23,000, the first outright decline in the recent run, after +20k in June and +63k in May. The unemployment rate nonetheless ticked down to 4.1%. A labour market shedding jobs while the participation-driven unemployment rate falls is an ambiguous signal, but the payrolls trend is deteriorating clearly, and it matters more for the September Fed decision than the CPI print that dominated the headlines.
Other economic releases today: no non-US release was reliably confirmed for 12 August. Search results returned eurozone and UK PMI figures that on inspection dated from August 2025, and a UK GDP reference to "Thursday 12 August" that cannot be right (12 August 2026 is a Wednesday). Rather than reproduce either, both are marked (not retrieved).
Fixed Income & Bond Analysis
Timing caveat: FRED's daily Treasury curve is published with a lag — the yields below are the 10 August observation, two sessions old, and therefore do not reflect today's post-CPI rally in Treasuries. Press reports confirm yields eased on the release. The spread series (T10Y2Y, T10Y3M) are 11 August. Read the levels as the pre-CPI starting point, not today's print.
Policy Rates
| Central Bank | Rate | Source |
|---|---|---|
| Fed Funds (upper) | 3.75% | FRED DFEDTARU |
| Fed Funds (lower) | 3.50% | FRED DFEDTARL |
| Effective FFR | 3.63% | FRED DFF |
| ECB Deposit Rate | 2.25% | FRED ECBDFR |
| BOJ Policy Rate | 1.00% | web search |
| BOE Bank Rate | ~3.73% (SONIA) | FRED IUDSOIA |
Government Bond Yields
| Country | 2Y Yield | 10Y Yield | 30Y Yield | Source |
|---|---|---|---|---|
| USA | 4.25% | 4.72% | 5.25% | FRED (2026-08-10) |
| Euro AAA | 2.71% | 3.18% | 3.63% | ECB YC API (2026-08-11) |
| Germany | (n/r) | 3.06% | (n/r) | web (2026-08-10) |
| France | (n/r) | 3.75% | (n/r) | web (2026-08-10) |
| UK | (n/r) | 4.92% | (n/r) | web (2026-08-11) |
| Japan | (n/r) | 2.78% | (n/r) | web (2026-08-07) |
| Italy | (n/r) | 3.90% | (n/r) | web (2026-08-06) |
(n/r) = not retrieved. The ECB AAA row is the authoritative euro curve from the ECB API; the German row is a market Bund quote from web search and sits slightly below it, as expected — the AAA curve is a composite of several AAA issuers, not Bunds alone. Non-US maturities other than 10Y were not retrieved, and day changes for non-US 10Y yields were not available at consistent dates.
Yield Curve Spreads (FRED pre-computed, 2026-08-11):
- 10Y–2Y: +48 bps — positively sloped and normal, but not steep (a steep curve is historically above ~75 bps).
- 10Y–3M: +81 bps — comfortably positive. No recession signal from the measure with the best historical record.
Both readings describe a curve that has normalised without steepening dramatically: the market expects modest further easing, not an emergency cutting cycle. The long end tells a different story — 20Y and 30Y both at 5.25%, a full 53 bps above the 10Y, reflect term-premium and fiscal supply concerns rather than growth expectations.
OAT-Bund Spread: 75.7 bps (10 August, French 10Y OAT 3.75% vs Bund 3.06%). This remains the cleanest daily market read on French fiscal risk. Notably, the France-Italy spread has closed entirely — Italian BTPs at 3.90% and French OATs at 3.75% have converged, a reversal of the long-standing hierarchy in which France traded far closer to Germany than to Italy.
Yield Curve Charts
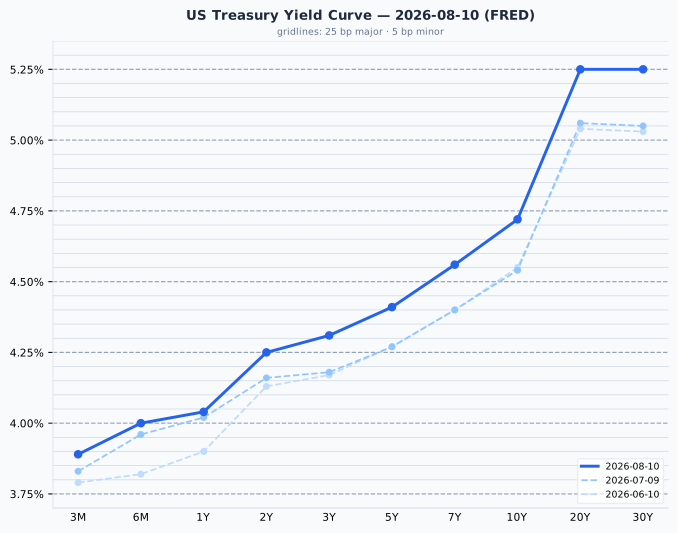
The US curve is upward-sloping across its whole length, with the steepest segment beyond 10 years (10Y 4.72% to 20Y 5.25%) rather than in the belly. Against a month ago the entire curve has shifted up — roughly 6 bps at 3M, 9 bps at 2Y, 18 bps at 10Y and 20 bps at 30Y — a bear steepening that raised long yields more than short ones, and which today's CPI print has begun to unwind.
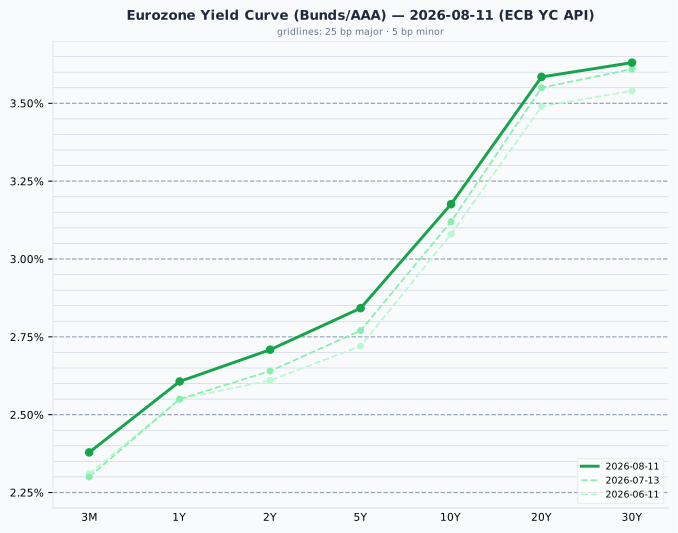
The euro AAA curve is also normally sloped but sits roughly 150 bps below the US at 10 years, with a flatter long end (20Y 3.58% to 30Y 3.63%). Since mid-July it has risen a little across the board — about 8 bps at 3M, 7 bps at 2Y and 6 bps at 10Y — a smaller and more parallel shift than the US curve's, consistent with an ECB that is closer to the end of its adjustment.
Credit Markets (FRED — authoritative, 2026-08-11)
| Market | OAS Spread | Series ID |
|---|---|---|
| US Investment Grade | 79 bps | BAMLC0A0CM |
| US High Yield | 272 bps | BAMLH0A0HYM2 |
| Euro High Yield | 257 bps | BAMLHE00EHYIOAS |
All three are historically tight. US high yield at 272 bps is below the 300–500 bps range that constitutes normal conditions, and IG at 79 bps is just through the tight end of its 80–150 bps band. Euro high yield at 257 bps is tighter still than its US counterpart. Spreads this narrow mean credit markets are pricing minimal default risk — corroborating the equity market's benign positioning, and offering very little compensation for the risk that the picture changes. Tight spreads are not a warning of imminent stress, but they leave asymmetric downside: there is far more room to widen than to compress.
Real Yields (US and Euro Area)
| Region | Nominal 10Y | Expected inflation | Real 10Y | How the real yield is obtained |
|---|---|---|---|---|
| United States | 4.72% | 2.29% (residual) | 2.43% (measured) | Measured. TIPS trade, so the market quotes a real yield directly (FRED DFII10); expected inflation is the residual — the breakeven |
| Euro area | 3.18% | 2.04% (measured) | 1.14% (residual) | Constructed. No euro inflation-linked benchmark is published, so the ECB SPF survey expectation (2026 Q3) is subtracted from the AAA nominal yield |
The two rows are built in opposite directions. The US measures the real yield and infers inflation; the euro area measures inflation and infers the real yield. Only the US figure — 2.43% — is something anyone actually trades; the euro 1.14% is the softer of the two and should be treated as an estimate. Two mismatches follow from that and should be stated whenever the pair is compared: the US breakeven embeds an inflation risk premium that a survey does not, and the SPF horizon is five years against the bond's ten.
Decomposing the 154 bp nominal gap between the US 10Y and the euro AAA 10Y: only 25 bp is expected inflation (2.29% vs 2.04%), while 129 bp is real rate (2.43% vs 1.14%). The gap is overwhelmingly a real-rate story, not an inflation story — the same conclusion as earlier this month, and a reminder not to assume the difference between the two blocs is about inflation expectations when the arithmetic says otherwise.
⚠️ The US–euro real rate gap is not an investment opportunity
The 129 bp real-yield advantage of the US over the euro area is a structural feature — higher US trend growth, euro-area excess savings, Bund scarcity, US fiscal supply — and it has persisted in every quarter since 2014. It is not a trade a euro-based reader can capture. Hedging the currency cancels it almost exactly, because the forward rate is set precisely to remove the interest-rate differential; unhedged, buying Treasuries is a bet on the dollar rather than a bond decision. A real yield is real in its own currency: 2.43% means 2.43% above US inflation, which is not a real return for someone who spends euros. The gap's survival for twelve years is the evidence that it compensates a risk borne by dollar investors, not that it is free money.
Bond Portfolio Implications
Earnings yield gap: what it is good for, and what it is not
The earnings yield gap — deliberately not called an equity risk premium, which is a different quantity requiring a growth forecast this measure omits — compares what the two instruments yield today using nothing but quoted prices:
| Region | Earnings yield | Sovereign 10Y | Nominal gap | vs real yield |
|---|---|---|---|---|
| US (S&P 500 / SPY) | 3.84% | 4.72% | −0.88 pp | +1.41 pp (vs DFII10 2.43%) |
| Euro (STOXX 600 / EXSA.DE) | 5.50% | 3.06% (Bund) | +2.44 pp | +4.36 pp (vs euro real 1.14%) |
That is the honest form of the comparison: today a US investor can lock a 4.72% Treasury coupon or accept equity risk at a 3.84% earnings yield. On nominal yields, US bonds currently out-yield US equities — the gap is negative. That describes today's trade-off; it is not a forecast. Adding the bond yield to the earnings yield empirically makes equity return forecasts worse rather than better, and no prediction about forward equity returns should be drawn from this number in either direction.
Two structural biases matter when the figure carries weight:
- It ignores growth. A bond coupon is fixed for a decade; the earnings behind the equity yield grow roughly with inflation. Quoting the real-yield version corrects for this, and the size of the correction is the interesting part — for the US it is 2.3 pp, enough to flip the gap from −0.88 to +1.41. (These are the same equation rearranged, not two independent confirmations.)
- An equity holder does not receive the full earnings yield. Only the dividend-and-buyback portion arrives as cash; the remainder is retained by the company. The 3.84% is not income in the sense the 4.72% coupon is.
Comparing the US and euro gaps also partly measures the difference between two currencies rather than relative risk compensation — which is why the decomposition above matters: 129 of the 154 bp difference is real, not inflation.
Are yields high enough to make bonds attractive? On a standalone basis, yes, more than at any point in the post-2008 era for US duration: 4.72% nominal and 2.43% real at 10 years is genuine compensation, and it beats the S&P's current earnings yield outright. The counterweight is duration risk — a 100 bp rise in yields costs roughly 8–9% in price on a 10-year bond, and the 20Y/30Y at 5.25% would lose considerably more. With the curve at +48 bps 10s2s, the term premium for extending from 2Y to 10Y is 47 bps, which is thin compensation for that convexity. The intermediate part of the curve (3–7 years) captures most of the yield with materially less duration risk, and remains the better risk-adjusted position for a bond allocation. For a euro-based investor, euro AAA paper at 3.18% nominal — and, crucially, at a real yield in the currency they actually spend — is the relevant comparison, not the higher US nominal.
Currencies & Commodities
Currencies:
| Pair | Rate | Source |
|---|---|---|
| EUR/USD | 1.1559 | FRED DEXUSEU (2026-08-07) |
| USD Index | 119.06 | FRED DTWEXBGS (2026-08-07) |
| USD/JPY | ~159.27 | web search (stale) |
| GBP/USD | ~1.3495 | web search (2026-08-09) |
| USD/CHF | ~0.8080 | web search (2026-08-07) |
All FX figures in this table are stale by several sessions — FRED's daily FX series lag, and no same-day quote was retrieved for the non-euro pairs. Treat them as approximate levels, not today's prices. GBP/USD is derived by inverting a quoted USD→GBP rate of 0.74102.
Commodities (front-month futures, 12 Aug settlement):
| Commodity | Price | Day Chg % | Ticker | Source |
|---|---|---|---|---|
| Brent Crude | $88.98 | +0.08% | BZ=F | yfinance |
| WTI Crude | $83.27 | +0.08% | CL=F | yfinance |
| Gold ($/oz) | $4,467.50 | +0.59% | GC=F | yfinance |
| Silver ($/oz) | $65.70 | +1.18% | SI=F | yfinance |
| Copper ($/lb) | $6.6155 | −0.28% | HG=F | yfinance |
| Nat Gas ($/MMBtu) | $2.804 | +1.34% | NG=F | yfinance |
Gold settled at $4,467.50, 20.0% below its all-time high of $5,586.20, which is also its 52-week high — a substantial drawdown, and the metal is not near record territory despite the day's 0.59% gain. Silver at $65.70 is 45.8% below its all-time high of $121.30 (again also the 52-week high), a far deeper decline than gold's and one that has taken the gold/silver ratio to roughly 68. Both metals have retraced hard from the peaks reached within the past year.
Copper is the standout: at $6.6155/lb it sits just 1.67% below its all-time high of $6.728 — effectively at record levels, and the only commodity in the table anywhere near its peak. It gave up its small intraday gain to settle 0.28% lower, which does not disturb the picture. That divergence, industrial metal at records while precious metals sit 20–46% off theirs, points to physical demand (electrification, grid and data-centre buildout) rather than monetary or safe-haven demand driving the complex.
Energy is subdued: Brent 39.7% and WTI 43.5% below their all-time highs and roughly 30% below their 52-week highs, both essentially unchanged on the day — each settled 0.08% higher, erasing small intraday losses. Natural gas at $2.804 remains deeply depressed — 82% below its all-time high — though it is off the $2.483 low of the past year.
Crypto: Bitcoin was near-flat (−0.33%), below the 3% threshold for inclusion. No notable move.
Sector & Theme Highlights
A full cross-market sector performance breakdown was not retrieved today, so the themes below are drawn from confirmed single-name and index moves rather than sector indices.
- AI semiconductors and memory — clearly the day's leadership. Samsung Electronics and SK Hynix both up around 7% in Seoul carried the Kospi to a 3.68% gain, on shareholder-return plans plus renewed confidence in the AI supply chain. In the US the same theme showed through CoreWeave, Super Micro Computer and Nebius. This is one global trade expressing itself on two continents, and it is the reason the Nasdaq 100 (+0.74%) almost tripled the S&P's gain while the Dow finished slightly lower.
- Rate-sensitives supported by the CPI print. With Treasury yields easing and September hike odds trimmed, the benign inflation read is a tailwind for duration-sensitive equity sectors, though no sector-level breakdown was retrieved to confirm the split.
- Industrial metals versus precious metals. Copper within 1.4% of a record while gold sits 20% and silver 46% below theirs is a genuine divergence, and reads as an electrification and data-centre demand story rather than a monetary-hedge one.
- China remains the global laggard. Hong Kong 24% and Shanghai 35.6% below their record highs, both below their 200-day averages, while every European index and the S&P 500 sits within 1.5% of a record.
- Swiss underperformance (SMI −0.86%, the weakest major European index) stands out against an otherwise mildly negative European tape, though no specific driver was confirmed.
Top Stories (Global)
- US July CPI came in tame and on consensus — +0.1% m/m, headline annual rate easing to 3.4% from 3.5%, core to 2.5%. Every reading matched the Wall Street consensus. Traders cut the odds of a September Fed hike and Treasury yields eased. This was the session's organising event.
- Kospi surged ~3.7% as Samsung Electronics and SK Hynix each rose around 7% on shareholder return plans and AI supply-chain optimism, lifting the MSCI Asia Pacific index roughly 0.7%.
- US AI and cloud infrastructure names led the session — CoreWeave, Super Micro Computer and Nebius Group — extending the capex theme that continues to drive index-level gains.
- Cisco beat on Q4 FY2026 but sold off after the close. Revenue of $17.3bn (+18% y/y) and non-GAAP EPS of $1.22 (+23%) both topped guidance; hyperscaler AI infrastructure orders reached $4bn in the quarter and $9.3bn for the year, roughly 4.5x the prior year, and FY2027 revenue guidance of $72.2–73.4bn implies ~15% growth at the midpoint. CEO Chuck Robbins described an early-stage networking super cycle driven by AI. The shares nonetheless fell around 4.7% in after-hours trade to about $118, having closed the regular session up 2.46% at $123.88 — a beat and a raise that still failed to clear an elevated bar.
- UK gilts remain the developed-market outlier, with the 10-year yield at 4.92%, a 14-month high, on inflation concerns partly linked to higher energy prices. UK yields now sit 20 bps above US 10-years and 174 bps above euro AAA.
- The France-Italy sovereign spread has closed entirely — OATs at 3.75% versus BTPs at 3.90%, with the OAT-Bund spread at 75.7 bps. A notable reversal of the historical ordering of euro-area credit risk.
- Bank of Japan held at 1% in late July on an 8–1 vote (Takata dissenting for 1.25%), having hiked to 1% in June — the highest policy rate since 1995. The BOJ guided that core inflation will run clearly above 2% in the second half of the fiscal year, keeping further tightening live. The 10-year JGB is near 2.78%.
- US payrolls fell 23,000 in July, the first outright monthly decline in this run, after +20k in June. Underreported relative to CPI, and arguably more consequential for the September decision.
Looking Ahead
Central banks - Fed: September FOMC is the next decision point. Today's CPI reduced hike odds; the softening payrolls trend pulls the same way. Watch Fed speakers for pushback against the market's read. - BOJ: next meeting is the live one among major central banks, given the 8–1 vote split and guidance that core inflation will exceed 2%. - ECB: deposit rate at 2.25% with the curve suggesting the adjustment is largely complete.
Earnings - Applied Materials (AMAT) reports Q3 on Thursday 13 August — semiconductor capital equipment orders, directly relevant to the AI capex theme leading global markets. Cisco's after-hours decline on a beat-and-raise (see Top Stories) is the cautionary read-across: the AI capex theme is priced for a lot already.
Economic releases - Watch for follow-through data on the US labour market, which now carries more decision weight than the inflation track. No specific non-US release for the coming days was reliably confirmed by search, so none is listed here rather than risk a wrong date.
Market closures (from the Nager.Date holiday calendar — next 5 calendar days and beyond): - Saturday 15 August — France, Assumption Day. Falls on a weekend; no trading impact. - Monday 17 August — South Korea, Liberation Day. The Kospi will be closed. Relevant given today's outsized Korean move. - Monday 31 August — United Kingdom, Summer Bank Holiday. Beyond the five-day window, flagged for planning. - No closures in the US, Germany, Japan, Australia, Switzerland, Canada or Brazil in this window. - India's holiday list is empty in the 2026 calendar, so Indian closures could not be checked. That is a gap in the calendar, not a confirmation that none exist.