Global Financial Briefing — Friday, 7 August 2026
Americas index levels, commodities and day changes reflect the 7 August closing print. Fixed income, FX and macro figures are dated inline.
Market Overview
Payrolls day delivered the miss of the year, and equities rallied anyway. The US economy shed 23,000 jobs in July against a consensus of roughly +80,000, and June was revised down by 37,000 to just +20,000 — a genuinely weak print that would ordinarily be read as the labour market cracking. Instead, Wall Street treated it as the clearest signal yet that the Fed's 3.50–3.75% target range has further to fall, and bid up precisely the assets that benefit most from a lower discount rate. The rally strengthened into the close: the Nasdaq 100 led (+1.19%), the S&P 500 followed (+0.62%) to finish at 7,757.64 — a record closing high, and the Dow lagged (+0.28%) — a textbook duration-led rally rather than a cyclical one.
Europe closed firmly higher and, as it turned out, joined the US on records rather than standing apart from it. The STOXX 600 (660.25) and Euro STOXX 50 (6,523.86) both finished within a tenth of a percent of their all-time highs, with the DAX up 0.69% and the CAC 40 adding 0.17%. The euro area's yield curve is a quieter story than the US one: the ECB's AAA 10Y sits at 3.15%, essentially unchanged on the day but roughly 9 bps higher than a month ago, while the deposit rate has been parked at 2.25%. For a euro-based investor, the arithmetic in the valuation section below is the important part — the earnings yield gap in Europe is positive and around 2 percentage points, while in the US it is negative.
Asia was the odd region out, and the dispersion within it was wide. The Nikkei slipped 0.12% and the Kospi fell 0.60% — the latter now 33% below its 52-week high after an extraordinarily volatile stretch (its 50-day average, 7,734, sits well above spot at 6,259). Shanghai bucked the trend with a 1.02% gain and Hang Seng added 0.54%. Elsewhere, precious metals were the day's standout: gold settled +2.33% and silver +3.07%, both moving on the same rate-cut logic that lifted tech. Crude settled firmer on fading optimism about a Strait of Hormuz reopening, and South Africa's EZA closed up 4.14% as the JSE extended a sixth consecutive winning session on record precious-metal prices. Volatility stayed subdued — the VIX at 15.15 is at the low end of the moderate band, and credit spreads are, if anything, tighter than that: US high yield at 271 bps is below the 300–500 bps historical norm.
Global Indices Snapshot
Americas
| Index | Level | Day Chg | Day Chg % | Source |
|---|---|---|---|---|
| S&P 500 | 7,757.64 | +47.68 | +0.62% | yfinance ^GSPC |
| Nasdaq 100 | 29,722.30 | +348.97 | +1.19% | yfinance ^NDX |
| Dow Jones | 54,036.93 | +151.83 | +0.28% | yfinance ^DJI |
| Brazil IBOV | 172,513.42 | −3,032.94 | −1.73% | yfinance ^BVSP |
Americas data reflects the 7 Aug close.
Cross-check: FRED SP500 publishes the 2026-08-07 close at 7,757.64, matching the yfinance ^GSPC close exactly; FRED's 2026-08-06 value of 7,709.96 confirms the prior close used for the day change. It is also the highest close in FRED's full ten-year S&P 500 history — a record closing high, though still 0.46% below the intraday all-time high of 7,793.68.
Europe
| Index | Level | Day Chg | Day Chg % | Source |
|---|---|---|---|---|
| Euro STOXX 600 | 660.25 | +2.06 | +0.31% | yfinance ^STOXX |
| Euro STOXX 50 | 6,523.86 | +21.30 | +0.33% | yfinance ^STOXX50E |
| CAC 40 | 8,714.93 | +15.22 | +0.17% | yfinance ^FCHI |
| DAX | 26,319.45 | +179.32 | +0.69% | yfinance ^GDAXI |
| FTSE 100 | 10,901.09 | +33.20 | +0.31% | yfinance ^FTSE |
| SMI (Swiss) | 14,544.91 | +26.16 | +0.18% | yfinance ^SSMI |
European data reflects today's close (7 Aug).
The STOXX 600, Euro STOXX 50, CAC 40 and DAX all closed at or within ~0.3% of record highs.
Asia-Pacific
| Index | Level | Day Chg | Day Chg % | Source |
|---|---|---|---|---|
| Nikkei 225 | 65,606.71 | −76.55 | −0.12% | yfinance ^N225 |
| Hang Seng | 25,668.03 | +137.75 | +0.54% | yfinance ^HSI |
| Shanghai Comp | 3,940.04 | +39.68 | +1.02% | yfinance 000001.SS |
| ASX 200 | 9,263.60 | −8.00 | −0.09% | yfinance ^AXJO |
| Kospi (Korea) | 6,258.77 | −37.61 | −0.60% | yfinance ^KS11 |
Asia-Pacific data reflects today's close (7 Aug).
Emerging Markets
| Index | Level | Day Chg % | Source |
|---|---|---|---|
| MSCI EM (EEM) | 65.64 | +0.95% | yfinance EEM |
| India Nifty 50 | 24,570.65 | −0.27% | yfinance ^NSEI |
| South Africa | 69.65 | +4.14% | yfinance EZA |
EEM and EZA are US-listed ETFs; their figures reflect the 7 Aug NYSE close. The Nifty 50 reflects the Mumbai close.
Index Valuations & Investment Risk
Valuation Table
| Index | Trailing P/E (live) | Hist avg trailing P/E (†) | Premium to hist avg |
|---|---|---|---|
| S&P 500 | 26.02x | ~16-18x | +53.0% |
| Nasdaq 100 | 30.83x | ~25-30x | +12.1% |
| Euro STOXX 600 | 19.12x | ~15-17x | +19.5% |
| CAC 40 | 18.34x | ~14-16x | +22.3% |
| DAX | 19.25x | ~15-17x | +20.3% |
| FTSE 100 | 18.25x | ~13-15x | +30.3% |
| Nikkei 225 | 21.32x | ~20-22x | +1.5% |
| MSCI EM | 16.98x | ~13-15x | +21.3% |
(†) Hist avg trailing P/E: static long-run reference constants. Premium computed against the midpoint of each range. Live trailing P/E from yfinance trailingPE on ETF proxies (SPY, QQQ, EXSA.DE, CAC.PA, EXS1.DE, ISF.L, 1321.T, EEM).
Every market on this list trades above its long-run average, but the degree differs sharply. The S&P 500 at 53% above its historical midpoint is the outlier — the Nasdaq, ironically, is the least stretched relative to its own history at +12%, because its historical average is already high. The FTSE 100's +30% is notable given the index's long-standing reputation as the cheap developed market.
Investment Risk Assessment for ETF Investors
United States (S&P 500 / Nasdaq ETFs) The S&P 500's earnings yield is (1÷26.02) = 3.84%, against a 10Y Treasury at 4.63% (FRED DGS10, 2026-08-05). That is an earnings yield gap of −0.79 percentage points — today an investor is being offered less current earnings yield on equities than the coupon on risk-free government debt. For the Nasdaq 100 the gap is wider: (1÷30.83) = 3.24%, or −1.39 pp. The 10Y TIPS real yield stands at 2.41% (FRED DFII10, 2026-08-05) — a genuinely restrictive real discount rate for long-duration equity.
Read this as a snapshot of today's trade-off, not a forecast. The gap compares a fixed bond coupon against a company's current earnings, which grow over time; it leaves that growth out entirely, so it understates equities by roughly the rate of expected inflation. Against the 2.41% real yield instead of the 4.63% nominal one, the same comparison is +1.43 pp in equities' favour. The gap is also not the equity risk premium proper, and it has little track record as a predictor of whether equities will beat bonds — for that, the earnings yield versus its own history is the better guide.
On the technical side the picture is the opposite: the S&P closed at 7,757.64, above both its 50-day (7,494.24) and 200-day (7,050.03) averages, at the top of a 52-week range of 6,316.91–7,793.68, and 0.46% below its all-time high of 7,793.68 — a record closing high, with the outstanding peak an intraday one. The Nasdaq 100 is 3.4% below its own record. Momentum and valuation are pointing in opposite directions, which is the central tension for a US index-ETF holder right now. Add the familiar concentration risk in megacap AI names — the very cohort that led the rate-cut rally into the close.
Europe (STOXX 600 / CAC 40 / DAX ETFs) The STOXX 600 earnings yield is (1÷19.12) = 5.23%, against a euro-area AAA 10Y of 3.15% (ECB YC API, 2026-08-06). That is a euro earnings yield gap of +2.08 pp — positive, meaningful, and roughly 2.9 percentage points better than the US equivalent. On this measure European equity offers a better current trade-off against its own risk-free alternative than US equity does, even though the STOXX 600 itself is ~20% above its own historical average P/E. One caveat on the cross-country comparison: part of that 2.9 pp reflects the difference between the two currencies rather than a difference in risk compensation. Correcting for it changes less than one might expect. The euro-area real 10Y is 1.11% (AAA nominal 3.15% less long-term HICP expectations of 2.04%, ECB Survey of Professional Forecasters 2026 Q3), giving a European real gap of +4.12 pp against the US +1.43 pp — Europe's advantage narrows only from 2.87 pp to 2.69 pp. The reason is that the 148 bp nominal yield gap is almost entirely a real rate difference (2.41% vs 1.11%, worth 130 bp); expected inflation on the two sides is nearly identical, 2.22% against 2.04%. The US trades at a 36% P/E premium to Europe (26.02x vs 19.12x).
For a France-based, EUR-denominated investor this matters twice over: the relative valuation favours Europe, and there is no currency translation risk on domestic holdings. The offsetting risks are that European indices are sitting at record highs with little technical margin of safety, and that French fiscal and political risk remains the key idiosyncratic exposure in the CAC 40 — though the current OAT-Bund spread could not be retrieved today (not retrieved).
Japan (Nikkei / TOPIX ETFs) At 21.32x the Nikkei is the only index here trading essentially at its historical average (+1.5%) — on a pure valuation basis, the most fairly priced major market on the list. The complication is policy: the BOJ held at 1.00% on 31 July in an 8–1 vote, having hiked from 0.75% in June, and warned core inflation is likely to run "clearly above" 2%. Further tightening is a live risk. With USD/JPY at 157.66 the yen remains historically weak, which flatters unhedged foreign returns on the way in but creates real exposure if BOJ normalisation drives a yen recovery. Currency-hedged share classes deserve serious consideration here.
Emerging Markets (MSCI EM ETFs) EEM at 16.98x is 21% above its own historical average and no longer offers the deep discount to developed markets that has traditionally been the EM bull case — though it remains 35% cheaper than the S&P 500. EEM closed below its 50-day average (66.39 vs 65.64) while well above its 200-day (60.58), and is 8.3% below its 52-week high of 71.57. China weight remains the dominant single factor; the 1.02% Shanghai gain helped. South Africa's 4.14% jump is a reminder of how much precious-metal beta sits inside EM allocations.
Overall Risk Score (qualitative, not financial advice): - United States — high valuation risk / low margin of safety. Negative earnings yield gap, 2.41% real yields, 53% P/E premium, index at a record close. - Europe — moderate. A positive earnings yield gap of ~2pp is the strongest relative argument on offer, offset by record index levels and elevated absolute multiples. - Japan — moderate. Fair valuation, but BOJ and currency risk are both live. - Emerging Markets — moderate. Relative discount to DM has narrowed considerably.
Disclaimer: This is financial information, not personalised investment advice. Past valuations do not guarantee future returns. Consult a financial advisor before investing.
US Economic Indicators (FRED - authoritative)
| Indicator | Current | Prior | Delta | Reference Date | FRED Series |
|---|---|---|---|---|---|
| CPI YoY % | 3.46% | 4.17% | −0.71pp | June 2026 | CPIAUCSL |
| Core CPI YoY % | 2.57% | 2.82% | −0.25pp | June 2026 | CPILFESL |
| Unemployment Rate | 4.1% | 4.2% | −0.1pp | July 2026 | UNRATE |
| Nonfarm Payrolls | −23k | +20k | −43k | July 2026 (monthly chg) | PAYEMS |
| 10Y TIPS Real Yield | 2.41% | 2.40% | +1bp | 2026-08-05 | DFII10 |
Note: FRED macro data is monthly and typically lags 4-6 weeks. Prior CPI/Core CPI figures are the May 2026 prints from earlier FRED pulls.
The disinflation trend is the quietly encouraging part of this table — headline CPI has fallen 71 bps in a single month to 3.46%, and core is down to 2.57%, approaching the Fed's target. Combined with a labour market that just posted its first negative payrolls month, this is the combination that makes a cut plausible.
Other economic releases today (from web search):
| Indicator | Actual | Consensus | Prior | Surprise |
|---|---|---|---|---|
| US Nonfarm Payrolls (July) | −23k | +80k | +20k (revised from +57k) | Large downside miss |
| US Unemployment Rate (July) | 4.1% | — | 4.2% | Ticked down despite job losses |
| US Composite PMI (Aug flash) | (not retrieved) | — | — | Scheduled 09:45 ET |
The June revision is arguably as important as the July number: cutting +57k to +20k means the two-month trend is now barely positive at best. The unemployment rate falling to 4.1% while payrolls contracted points to labour force participation dropping rather than genuine strength.
Fixed Income & Bond Analysis
Policy Rates
| Central Bank | Rate | Source |
|---|---|---|
| Fed Funds (upper) | 3.75% | FRED DFEDTARU (2026-08-07) |
| Fed Funds (lower) | 3.50% | FRED DFEDTARL (2026-08-07) |
| Effective FFR | 3.63% | FRED DFF (2026-08-05) |
| ECB Deposit Rate | 2.25% | FRED ECBDFR (2026-08-07) |
| BOJ Policy Rate | 1.00% | web search (held 2026-07-31, 8-1 vote) |
| BOE Bank Rate | ~3.73% | FRED IUDSOIA (SONIA proxy, 2026-08-05) |
Government Bond Yields
| Country | 2Y Yield | 10Y Yield | 30Y Yield | Day Chg (10Y) | Source |
|---|---|---|---|---|---|
| USA | 4.18% | 4.63% | 5.17% | 0 bp | FRED (2026-08-05) |
| Germany | 2.67% | 3.15% | 3.60% | ~0 bp | ECB AAA curve (2026-08-06) |
| France | (not retrieved) | (not retrieved) | (not retrieved) | — | web |
| UK | (not retrieved) | 4.95% | (not retrieved) | +1 bp | web |
| Japan | (not retrieved) | 2.78% | (not retrieved) | +2 bp | web |
| Italy | (not retrieved) | (not retrieved) | (not retrieved) | — | web |
German figures are the ECB's AAA-rated euro area curve, which tracks Bunds closely but is not identical to them.
Yield Curve Spreads (FRED pre-computed):
- 10Y-2Y spread: +44 bps (FRED T10Y2Y, 2026-08-06), down 1 bp from +45 bps. Positively sloped and normal — not inverted, and not steep either (a steep curve historically means >75 bps).
- 10Y-3M spread: +79 bps (FRED T10Y3M, 2026-08-06), up from +74 bps. No recession signal from this indicator; the classic inversion warning is absent.
Both spreads say the same thing: the curve has fully normalised out of the inversion of prior years, but it has not yet steepened to the degree that typically accompanies an active easing cycle. If the Fed does cut in response to today's payrolls, the front end will fall faster than the long end and this curve should steepen materially from here.
OAT-Bund Spread (France-Germany 10Y): (not retrieved) — no contemporaneous French 10Y quote was available in today's search. This remains the key French fiscal risk indicator and should be re-checked before acting on any CAC 40 or OAT position.
Yield Curve Charts
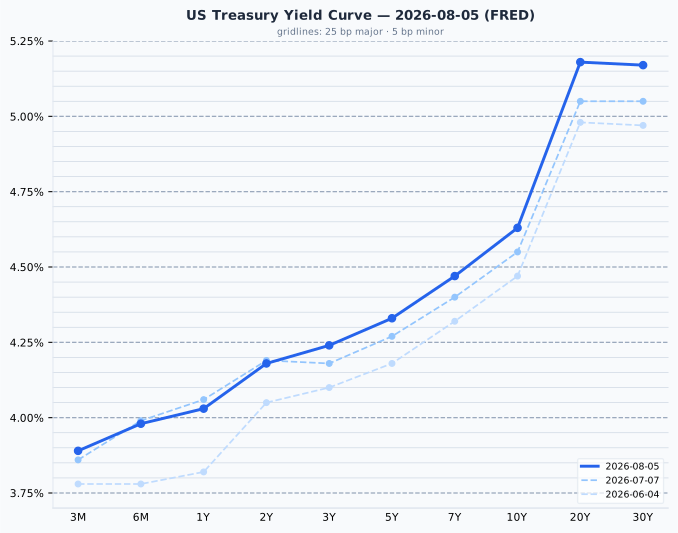
The US curve is upward-sloping across its full length, with the steepest segment between 10Y and 20Y (55 bps) and a very slight inversion at the very long end (30Y at 5.17% sits 1 bp below the 20Y at 5.18%). Versus a month ago the entire curve has shifted higher, with the long end moving most — 20Y and 30Y are each up 12-13 bps since 8 July while the 2Y is essentially unchanged, a bear-steepening that reflects term-premium rebuilding rather than policy repricing.
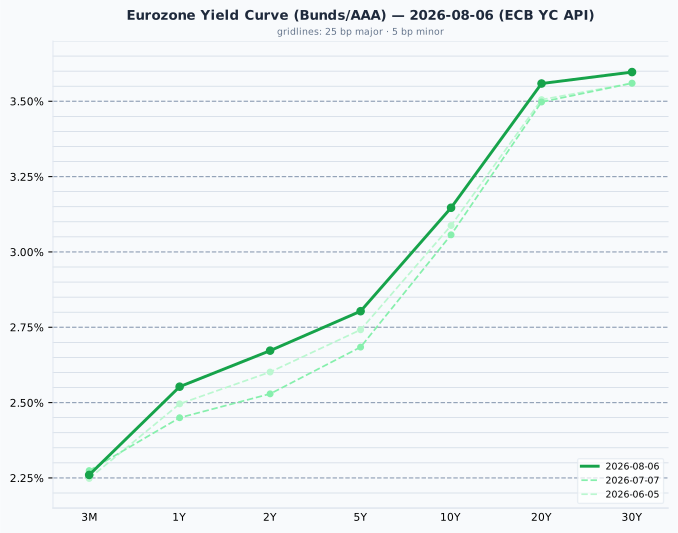
The euro area AAA curve is smoothly upward-sloping from 2.26% at 3M to 3.60% at 30Y, with no kinks and a 134 bp total slope — a notably more orderly shape than the US curve. Since 7 July it has risen roughly 9-14 bps across the 1Y-10Y belly while the 3M point fell slightly, a modest flattening-from-the-front that is consistent with the ECB being seen as done cutting.
Credit Markets (from FRED — authoritative)
| Market | OAS Spread | Prior day | Series ID |
|---|---|---|---|
| US Investment Grade | 78 bps | 78 bps | BAMLC0A0CM |
| US High Yield | 271 bps | 275 bps | BAMLH0A0HYM2 |
| Euro High Yield | 263 bps | 265 bps | BAMLHE00EHYIOAS |
All as of 2026-08-06.
Both US measures sit below their historical norms — IG at 78 bps is just under the 80-150 bps typical band, and HY at 271 bps is comfortably below the 300-500 bps range that usually counts as normal. This is historically tight pricing, not stress. Spreads even compressed 4 bps on the day despite a negative payrolls print, which tells you credit markets read the jobs data as a rate-cut catalyst rather than a growth warning. The risk in tight spreads is asymmetry: there is very little cushion left if that interpretation proves wrong.
Bond Portfolio Implications
The case for bonds over equities is unusually clean right now on a pure yield basis. A 10Y Treasury at 4.63% out-yields the S&P 500's 3.84% earnings yield outright — earnings yield gap = (1÷26.02) − 4.63% = −0.79pp. For the Nasdaq the gap is wider still at −1.39pp. This is a statement about the income on offer today, not a forecast of returns: the bond coupon is fixed for a decade while the earnings behind that 3.84% should grow, so the comparison flatters bonds by roughly the expected inflation rate.
In Europe the calculus reverses: euro earnings yield gap = (1÷19.12) − 3.15% = +2.08pp. Euro equity still offers more current earnings yield than euro duration, which is the most directly useful number in this briefing for a EUR-based investor deciding between STOXX 600 exposure and Bunds — bearing in mind that an equity holder does not receive the full earnings yield in cash, only the dividend and buyback portion of it.
Duration risk cuts both ways from here. A 100 bp rise in yields costs roughly 8-9% on a 10Y bond — but with the Fed at 3.50-3.75% and payrolls now negative, the risk is skewed toward yields falling, which would deliver that 8-9% as a gain. The long end is the more nuanced call: the 20Y and 30Y have been bear-steepening on term premium rather than policy, so a Fed cut would not necessarily rally them. Intermediate duration (5-10Y) captures most of the policy-easing upside with less term-premium exposure.
Currencies & Commodities
Currencies:
| Pair | Rate | Source |
|---|---|---|
| EUR/USD | 1.1519 | FRED DEXUSEU (2026-07-31) |
| USD Index | 119.70 | FRED DTWEXBGS (2026-07-31) |
| USD/JPY | 157.66 | web search |
| GBP/USD | 1.3442 | web search |
| USD/CHF | 0.8100 | web search |
FRED FX series are lagging by a week — the 31 July observation is the most recent published.
Commodities (all from yfinance front-month futures):
| Commodity | Price | Day Chg % | Ticker | Source |
|---|---|---|---|---|
| Brent Crude | $83.55 | +1.29% | BZ=F | yfinance |
| WTI Crude | $78.18 | +1.15% | CL=F | yfinance |
| Gold ($/oz) | $4,399.70 | +2.33% | GC=F | yfinance |
| Silver ($/oz) | $63.50 | +3.07% | SI=F | yfinance |
| Copper ($/lb) | $6.591 | −1.76% | HG=F | yfinance |
| Nat Gas ($/MMBtu) | $2.662 | +0.83% | NG=F | yfinance |
Commodity figures are the 7 Aug settlements; the front-month futures settle at 20:30 CEST.
Precious metals in context. Gold settled 2.33% higher at $4,399.70, but sits 21.2% below its all-time high of $5,586.20 — this is a rally within a substantial drawdown, not a run at records. Silver gained 3.07% to $63.50 and is 47.6% below its all-time high of $121.30, having traded as low as $37.21 over the past year. Both metals responded to the same rate-cut repricing that lifted equities: lower expected real rates reduce the opportunity cost of holding non-yielding assets.
Copper is the one commodity genuinely near its record — at $6.591/lb it is slightly below its all-time high of $6.728/lb (−2.0%), despite falling 1.76% on the day. Crude remains far from extremes: Brent is 43.3% below its 2008-era peak and WTI 46.9% below, and both extended their gains into the settlement, Brent finishing up 1.29% having been only 0.80% higher mid-afternoon, driven by fading optimism over a Strait of Hormuz reopening. Natural gas was the one commodity to fade rather than firm into the close, settling at $2.662 for a 0.83% gain against 1.33% intraday, and remains near the bottom of its 52-week range ($2.483-$7.827).
Crypto: no notable moves retrieved (not retrieved).
Sector & Theme Highlights
Rate-sensitivity was the organising factor of the day, not sector fundamentals. The Nasdaq 100's 1.19% close versus the Dow's 0.28% is the cleanest expression: long-duration growth outperformed value and cyclicals by more than 4x on a day when the economic news was unambiguously bad. Precious metals miners and holders benefited from the same mechanism.
Software guidance is being rewarded aggressively. The theme intensified through the afternoon: Atlassian closed up roughly 35% and Twilio around 25% on strong quarterly results, alongside Cloudflare's 16% surge on upbeat full-year and current-quarter guidance and Airbnb's 8%+ move on a revenue and earnings beat. The market is still paying up hard for forward visibility. The other side was equally unforgiving — The Trade Desk fell sharply on an earnings miss and DraftKings lost 3% on a revenue miss.
Commodity-linked EM is having a genuinely strong run. South Africa's 4.14% close, on a sixth consecutive JSE winning session, is being driven by record precious-metal prices in local terms plus post-credit-upgrade sentiment and a rand at multi-year highs. This is a distinct theme from the China-reopening trade that usually dominates EM narratives.
Energy geopolitics remains an unresolved overhang. The Strait of Hormuz situation has moved from "possible reopening" optimism to renewed uncertainty within a single session, and crude responded. This is the most obvious source of an inflation upside surprise that would complicate the rate-cut thesis underpinning today's equity rally.
Top Stories (Global)
- US payrolls fell 23,000 in July against a +80,000 consensus, with June revised down 37,000 to +20,000. The unemployment rate nonetheless ticked down to 4.1% (FRED UNRATE), pointing to falling participation rather than labour market strength.
- Equities rallied on the weak jobs data, with the Nasdaq 100 leading (+1.19%) and the S&P 500 closing at a record 7,757.64 (+0.62%) — markets read the print as materially raising the odds of a Fed cut from the current 3.50-3.75% range.
- European indices closed at or near record highs — the STOXX 600, Euro STOXX 50, CAC 40 and DAX all finished within ~0.3% of all-time peaks.
- Software results drove the biggest single-name moves: Atlassian closed up around 35% and Twilio around 25% on strong quarterly numbers, while Cloudflare surged 16% on an upbeat full-year and current-quarter outlook and Airbnb rose over 8% on a revenue and earnings beat. The Trade Desk dropped sharply on an earnings miss and DraftKings fell 3% after missing revenue estimates.
- Gold and silver settled 2.33% and 3.07% higher respectively on the rate-cut repricing, though both remain deep in drawdown from their all-time highs (−21.2% and −47.6%).
- Crude settled firmer as Strait of Hormuz reopening optimism faded, with Brent up 1.29% to $83.55 and WTI up 1.15% to $78.18.
- South Africa's JSE extended a sixth straight winning session with the rand at its strongest in over three years; the EZA ETF closed up 4.14%.
- The BOJ remains on hold at 1.00% after its 31 July 8-1 decision, having warned that core inflation will likely run "clearly above" 2% from the second half of its fiscal year — a hawkish hold that keeps further tightening in play.
Looking Ahead
Central banks - Fed commentary will be scrutinised intensely following today's payrolls miss — any speech in the coming days becomes a policy signal by default. - The BOJ is on hold at 1.00% after 31 July, but Takata's dissent for 1.25% and the "clearly above 2%" inflation warning mean the next meeting carries real hike risk. - ECB deposit rate steady at 2.25%; the euro curve suggests markets see the cutting cycle as complete.
Economic releases - August flash PMIs across the US, euro area, UK and Japan are the next significant global datapoint. - US CPI for July is the key release to watch — with headline at 3.46% and core at 2.57% and both falling, a further step down would strongly reinforce the rate-cut case that drove today's rally. - Revisions to the June/July payrolls figures deserve attention given the scale of the June revision just delivered.
Earnings - Q2 season is in its later stages. Today's reporters included OKLO, VST, MDA, UAA, WEN, TRLV, CGC and Take-Two. Oklo missed on the bottom line (Q2 EPS −$0.28 against roughly −$0.16 expected) but its shares rose anyway on a reactor criticality milestone — a clean illustration of the day's pattern, in which guidance and forward narrative were priced far more aggressively than reported results.
Market closures in the next five calendar dates (8-12 August 2026, from the Nager.Date holiday calendar): - Tuesday 11 August — Japan: Mountain Day (山の日). Tokyo markets closed. - No other closures in US, GB, DE, FR, AU, CH, CA, KR or BR over this window. - Further out: France — Assumption Day, Saturday 15 August (weekend, no trading impact); Korea — Liberation Day, Monday 17 August; UK — Summer Bank Holiday, Monday 31 August. - India holiday data was unavailable in the calendar (not retrieved).