2026 09 09
Global Financial Briefing — Wednesday, 9 September 2026
Americas index levels, commodities and day changes reflect the 9 September closing print; US Treasury figures, the curve spreads and the US yield curve chart use Treasury's settled 9 September par curve. FX, credit, the VIX, policy rates, the euro area bond rows and the ECB curve chart are dated inline.
Market Overview
The Iran conflict stopped being a risk premium today and became a supply event. US Central Command destroyed five Iranian oil tankers, one of them near Kharg Island, the terminal through which the overwhelming majority of Iranian crude exports leave the country, in response to Iranian ballistic missile attempts against US warships. Iran said it had attacked more than a dozen vessels trying to transit the Strait of Hormuz without its permission. Brent went through $100 for the first time since late July, settling at $101.21, up 3.36% on the day, with WTI settling at $96.05, up 3.25%. Yesterday the market was pricing the possibility that Gulf export infrastructure gets hit. Today it is pricing the fact.
Equities split along exactly the line you would expect, and the split was much sharper in Europe than in the US. The STOXX 600 closed down 1.41% at 640.41, its worst session in weeks, with the CAC 40 off 1.94%, the SMI down 1.80%, the DAX down 1.66% and the FTSE 100 down 1.31%; industrials and banks were the worst-hit sectors. Europe imports nearly all of its crude, its largest listed sectors are energy-intensive manufacturers and rate-sensitive banks, and it has an ECB decision tomorrow into which an oil shock is the least welcome possible input. The US, by contrast, is a net energy exporter with an index dominated by companies that do not burn much oil: the S&P 500 closed down 0.48% at 7,636.36 and the Nasdaq 100 down 0.29% at 29,421.55, while the Dow, which carries the industrial and healthcare weight, closed down 0.77%. Underneath, only two of the eleven S&P 500 sectors finished higher, energy at +0.63% and technology at +0.29%, and the weakest, consumer staples, lost just 1.11%. The much wider dispersion visible at midday, healthcare off around 2.5% and several mega-caps moving multiple points, compressed sharply into the close: no sector finished worse than down 1.1%. Asia had closed before the worst of it: the Nikkei slipped 0.19%, the Hang Seng 0.17%, and Seoul actually rose 1.40%, while Shanghai gained 0.28%.
Rates did more today than they did yesterday, but still not much. The curve settled with the 10-year Treasury at 4.83%, up 3 bp, the 30-year at 5.28%, up 3 bp, the 5-year at 4.61%, up 4 bp and the 2-year at 4.43%, also up 4 bp: a near-parallel shift of three to four basis points on a day crude rose three dollars. The interesting move is in Europe, where the 10-year Bund reached 3.40%, its highest since April 2011, French yields their highest since November 2008, and Dutch yields 15-year highs. The euro area is being repriced harder than the US by a shock that hurts it more, one day before a central bank that consensus expects to raise the deposit rate 25 bp to 2.50%. Meanwhile the VIX at 15.72 (FRED VIXCLS, 8 September) is barely into the moderate band, US high yield sits at 267 bp and investment grade at 81 bp, both historically tight. Credit and volatility are still not pricing what the oil market and the European bond market are pricing, and that gap has now been open for a fortnight.
Global Indices Snapshot
Americas
| Index | Level | Day Chg | Day Chg % | Source |
|---|---|---|---|---|
| S&P 500 | 7,636.36 | -37.16 | -0.48% | yfinance ^GSPC |
| Nasdaq 100 | 29,421.55 | -86.15 | -0.29% | yfinance ^NDX |
| Dow Jones | 52,380.66 | -405.44 | -0.77% | yfinance ^DJI |
| Brazil IBOV | 185,629.05 | -1,737.79 | -0.93% | yfinance ^BVSP |
Americas data reflects the 9 Sep close. FRED's SP500 series independently reports the S&P 500 close for 9 September at 7,636.36, matching the figure above to the cent.
Europe
| Index | Level | Day Chg | Day Chg % | Source |
|---|---|---|---|---|
| Euro STOXX 600 | 640.41 | -9.19 | -1.41% | yfinance ^STOXX |
| CAC 40 | 8,156.67 | -161.31 | -1.94% | yfinance ^FCHI |
| DAX | 25,576.45 | -431.18 | -1.66% | yfinance ^GDAXI |
| FTSE 100 | 10,670.06 | -141.60 | -1.31% | yfinance ^FTSE |
| SMI (Swiss) | 13,804.70 | -252.91 | -1.80% | yfinance ^SSMI |
European data reflects today's cash close (9 Sep). The Euro STOXX 50 closed at 6,311.56, down 1.58%.
Asia-Pacific
| Index | Level | Day Chg | Day Chg % | Source |
|---|---|---|---|---|
| Nikkei 225 | 65,142.78 | -126.55 | -0.19% | yfinance ^N225 |
| Hang Seng | 25,274.96 | -42.22 | -0.17% | yfinance ^HSI |
| Shanghai Comp | 3,951.51 | +10.96 | +0.28% | yfinance 000001.SS |
| ASX 200 | 8,911.40 | -9.40 | -0.11% | yfinance ^AXJO |
| Kospi (Korea) | 7,051.64 | +97.12 | +1.40% | yfinance ^KS11 |
Asia-Pacific data reflects today's close (9 Sep). Asian markets shut before the tanker strikes were fully absorbed, so these closes understate the day's risk-off tone relative to Europe and the US. For the Hang Seng, Shanghai, the ASX 200 and the Nifty 50, yfinance's previousClose field lags an extra session and disagrees with price − change; the day changes shown reconcile exactly with the 8 September closes published yesterday, so it is the change fields that are right.
Emerging Markets
| Index | Level | Day Chg % | Source |
|---|---|---|---|
| MSCI EM (EEM) | 68.48 | -0.51% | yfinance EEM |
| India Nifty 50 | 23,431.50 | -0.86% | yfinance ^NSEI |
| South Africa | 71.31 | +0.01% | yfinance EZA |
EEM and EZA are USD-denominated ETF proxies and now reflect the 9 September NYSE close. EZA is the one row the close reversed: it was down 0.18% at midday and finished a hair higher on the day. The Nifty 50 is a settled 9 September close.
Index Valuations & Investment Risk
Valuation Table
| Index | Trailing P/E (live) | Hist avg trailing P/E (†) | Premium to hist mid |
|---|---|---|---|
| S&P 500 | 24.62x | ~16-18x | +44.8% |
| Nasdaq 100 | 29.18x | ~25-30x | +6.1% |
| Euro STOXX 600 | 17.65x | ~15-17x | +10.3% |
| CAC 40 | 16.76x | ~14-16x | +11.7% |
| DAX | 18.52x | ~15-17x | +15.7% |
| FTSE 100 | 17.93x | ~13-15x | +28.1% |
| Nikkei 225 | 21.91x | ~20-22x | +4.3% |
| MSCI EM | 14.57x | ~13-15x | +4.1% |
(†) Hist avg trailing P/E: static long-run reference constants, the only figures in this briefing not taken from a live source. Live trailing P/E from yfinance trailingPE on the ETF proxies SPY, QQQ, EXSA.DE, CAC.PA, EXS1.DE, ISF.L, 1321.T and EEM.
The S&P 500 at 24.62x trailing is 44.8% above the midpoint of its long-run range, which crosses the historically-stretched threshold. The Nasdaq 100 at 29.18x looks far more reasonable against its own history, only 6.1% above midpoint, which is the recurring oddity of this market: the expensive part of the US index is not the part everyone calls expensive. The FTSE 100 at 17.93x is the second-most stretched name in the table against its own history, a reminder that the UK's reputation as the cheap developed market is a decade out of date. Europe's continental indices sit 10% to 16% above their own long-run averages, and emerging markets at 14.57x remain the only genuinely undemanding valuation here.
Investment Risk Assessment for ETF Investors
United States (S&P 500 / Nasdaq ETFs)
Earnings yield on SPY is (1÷24.62) = 4.06%, against a 10-year Treasury at 4.83% (US Treasury par curve, 9 September). The earnings yield gap is therefore -0.77 pp: the government bond currently pays more income than the index earns, before any growth. On the Nasdaq the gap is -1.40 pp. Measured against the real yield instead, which is the cleaner comparison because equity earnings grow with inflation while a coupon does not, the S&P gap is +1.60 pp (4.06% less the 2.46% TIPS real yield). The size of that correction, 2.37 pp, is larger than the gap itself and flips its sign, which is the main thing to take from the number. This is a description of today's trade-off between two income streams, not a forecast of which will win.
The index sits in the upper part of its 52-week range of 6,316.91 to 7,816.70 and above both its 50-day (7,602) and 200-day (7,152) moving averages, so the trend is intact and today's move is a wobble rather than a break. The Dow, notably, closed below its 50-day of 52,967. Concentration remains the structural risk: the earnings yield gap is negative largely because a handful of AI-complex names carry the index multiple, and the real yield at 2.46% is a demanding discount rate for assets whose value sits far out in the future.
Europe (STOXX 600 / CAC 40 / DAX ETFs)
Earnings yield on EXSA.DE is (1÷17.65) = 5.67%, against the euro AAA 10-year at 3.38% (ECB YC API, 8 September), a euro earnings yield gap of +2.29 pp, or +2.27 pp against the web-sourced Bund quote of 3.40%. On the euro real yield of 1.34% the gap is +4.32 pp. Europe offers materially more current income per unit of equity risk than the US on either basis.
Part of that difference is not risk compensation at all, but the gap between US and euro-area inflation and policy paths, so the real-yield versions above are the honest comparison. Even there Europe leads by a wide margin, though the euro real yield is the softer of the two numbers for reasons set out under Real Yields below.
Today sharpened the specific European risk. The CAC 40 has now fallen below both its 50-day and its 200-day moving average, the only major index in the table to have done so, and French 10-year yields are at their highest since 2008 with the OAT-Bund spread around 85 bp. An oil shock lands harder on a bloc that imports its energy, and it lands harder still on a bloc whose central bank is expected to tighten into it tomorrow.
On currency: a euro-based investor holding EUR-quoted European funds has no FX effect on the quoted value of the holding, but real exposure remains inside the earnings, since CAC 40 and STOXX 600 constituents are multinationals earning abroad. The exposure is smaller, slower and partly hedged by foreign cost bases, not absent.
Japan (Nikkei / TOPIX ETFs)
At 21.91x trailing the Nikkei is only 4.3% above its long-run average, the second-cheapest entry here relative to its own history. The policy risk is live: the BOJ meets 17 to 18 September with roughly 63% priced for a move from 1.00%, and the bank has explicitly cited crude and a weak yen in warning that core inflation will run clearly above 2%. Today's oil move strengthens that case. For an unhedged euro investor USD/JPY at 153.63 means the yen has already done much of the damage; a hike would reverse some of it, which argues for leaving the currency exposure open rather than hedging into a probable tightening.
Emerging Markets (MSCI EM ETFs)
At 14.57x, EM trades at a 41% discount to the S&P 500 on trailing earnings and only 4.1% above its own long-run average, with an earnings yield of 6.86%. The oil shock is the complication: EM is not one exposure but a mix of energy exporters that benefit and energy importers, India above all, that do not. The Nifty 50 fell 0.86% today and sits below both its moving averages. China is the other structural question, with Shanghai up on the day but still under its 200-day and the Hang Seng likewise.
Overall Risk Score (qualitative, not financial advice): - United States: high valuation risk, low margin of safety. 44.8% above the long-run multiple with a nominal earnings yield gap of -0.77 pp. - Europe: moderate, with fair value on multiples and a healthy earnings yield gap, offset by an acute and immediate energy and policy risk. - Japan: moderate, fairly valued on its own history, with policy the dominant variable. - Emerging markets: attractive relative valuation, with the caveat that the oil shock divides the asset class rather than moving it as a block.
Disclaimer: This is financial information, not personalised investment advice. Past valuations do not guarantee future returns. Consult a financial advisor before investing.
US Economic Indicators (FRED - authoritative)
| Indicator | Current | Prior | Delta | Reference Date | FRED Series |
|---|---|---|---|---|---|
| CPI YoY % | 3.30% | — | — | Jul 2026 | CPIAUCSL |
| Core CPI YoY % | 2.47% | — | — | Jul 2026 | CPILFESL |
| Unemployment Rate | 4.1% | — | — | Aug 2026 | UNRATE |
| Nonfarm Payrolls | +162k m/m | — | — | Aug 2026 | PAYEMS |
| 10Y TIPS Real Yield | 2.46% | — | — | 9 Sep 2026 | US Treasury real curve |
Prior and delta columns are blank because the fetch returns the current year-on-year transformation only, not the preceding month's. The TIPS real yield is sourced from the US Treasury real curve rather than FRED's DFII10 publication, which runs a business day behind.
The 83 bp wedge between headline CPI at 3.30% and core at 2.47% (both FRED, July 2026) is almost entirely energy, and everything in today's session widens it. Brent has risen from roughly $80 in early August to $101 today; that pass-through has not yet appeared in any published US inflation print. Friday's August CPI will contain some of it, and September's will contain much more. Unemployment at 4.1% with 162,000 jobs added in August leaves the labour market offering no counterargument to a central bank inclined to lean against an energy shock.
Other economic releases today: the calendar was empty of first-tier data in both the US and the euro area. US PPI is due before Thursday's open and August CPI before Friday's, with the ECB decision in between. Today's price action was entirely geopolitical.
Fixed Income & Bond Analysis
Policy Rates
| Central Bank | Rate | Source |
|---|---|---|
| Fed Funds (upper) | 3.75% | FRED DFEDTARU |
| Fed Funds (lower) | 3.50% | FRED DFEDTARL |
| Effective FFR | 3.63% | FRED DFF (7 Sep 2026) |
| ECB Deposit Rate | 2.25% | FRED ECBDFR |
| BOJ Policy Rate | 1.00% | web search |
| BOE Bank Rate | ~3.73% | FRED IUDSOIA (SONIA proxy, 7 Sep 2026) |
The BOJ held at 1.00% on 31 July in an 8-1 vote, with Hajime Takata dissenting for 1.25%. All three of the Fed, the ECB and the BOJ meet within nine days of each other, and all three are being pushed the same direction by the same barrel of crude.
Government Bond Yields
| Country | 2Y Yield | 10Y Yield | 30Y Yield | Day Chg (10Y) | Source |
|---|---|---|---|---|---|
| USA | 4.43% | 4.83% | 5.28% | +3.0 bp | US Treasury par curve (9 Sep 2026) |
| Germany | 2.92% | 3.38% | 3.76% | — | ECB YC API AAA curve (8 Sep 2026) |
| France | — | 4.19% | — | — | web (4 Sep 2026) |
| UK | — | 5.15% | — | — | web (~7 Sep 2026) |
| Japan | — | 2.90% | — | — | web (7 Sep 2026) |
| Italy | — | (not retrieved) | — | — | web |
The USA row is the settled US Treasury par curve for 9 September, with the day change computed against the 8 September session (10-year 4.80%). The whole row moved up three to four basis points, taking the 10-year to its highest of this cycle. The German row uses the ECB AAA composite, which has now caught up to 8 September; a web-sourced Bund quote for today puts the 10-year at 3.40%, its highest since April 2011. The French, UK and Japanese figures are the freshest retrievable and are stale by several days each, the French quote most of all: it predates the whole of this week's move and should be read as a floor rather than a current level. Italy could not be retrieved.
The UK remains the outlier: a 10-year gilt at 5.15% is 35 bp above the equivalent Treasury and near a 19-year high, which is a remarkable place for a G7 sovereign to fund itself.
Yield Curve Spreads (US Treasury par curve, 9 September 2026): - 10Y-2Y spread: +40 bp. Positively sloped, and comfortably out of the inversion that defined 2022 to 2024, but well short of the roughly 75 bp that would count as historically steep. The curve has a normal shape without a normal amount of term premium at the front. - 10Y-3M spread: +88 bp. No recession signal from the classic version of the indicator.
The shape worth noting is at the very long end, where the 20-year and the 30-year both settled at 5.28%. The small 20s-30s inversion that had persisted for months closed on this session, the 30-year having risen three basis points against the 20-year's two. It reflects the concentration of issuance and index demand around the 20-year point rather than any view on the next thirty years, and a flat reading is the more normal state of that segment.
OAT-Bund Spread: around 84.7 bp as of 4 September, the freshest quote retrievable. With French 10-year yields now reported at their highest since November 2008 and the Bund at 3.40%, this spread needs a fresher read than the data supports today; it is the number to watch through tomorrow's ECB press conference.
Yield Curve Charts
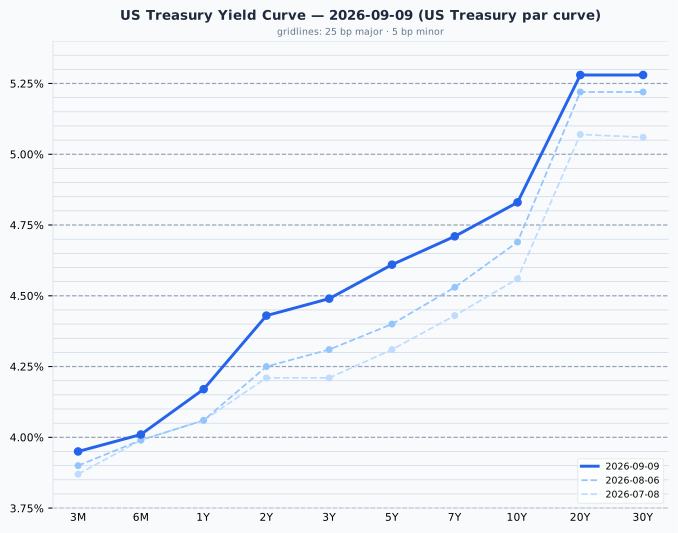
The US curve is positively sloped throughout, steepening gently from 3.95% at three months to 4.83% at ten years before flattening to a dead level of 5.28% between twenty and thirty years. Against a month ago it has shifted up roughly 18 to 21 bp across the belly, with the 2-year up 18 bp and the 10-year up 14 bp, a repricing of Fed expectations concentrated in the two to seven year part of the curve rather than a change in its overall shape; the front and the long end have moved much less, the 3-month up 5 bp and the 30-year up 6 bp. The 3-month at 3.95% sits 33 bp above the Fed funds target midpoint of 3.625%, which is bill pricing anticipating the 16 September meeting rather than a data anomaly.
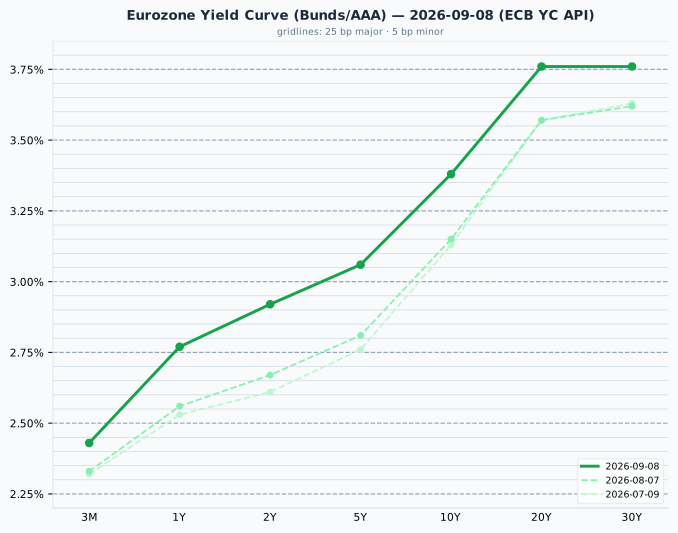
The euro AAA curve is steeper than the US one in relative terms, rising from 2.43% at three months to 3.38% at ten years and 3.76% at thirty, with no inversion anywhere. The shift since 8 August is much larger than the US one: the 10-year is up 23 bp, the 2-year up 25 bp and the 5-year up 25 bp in a month, against 11 to 14 bp for Treasuries. Europe is repricing its policy path faster than the US is repricing its own, which is the bond-market expression of the same asymmetry the equity indices showed today.
Credit Markets (from FRED, 8 September 2026)
| Market | OAS Spread | Series ID |
|---|---|---|
| US Investment Grade | 81 bp | BAMLC0A0CM |
| US High Yield | 267 bp | BAMLH0A0HYM2 |
| Euro High Yield | 265 bp | BAMLHE00EHYIOAS |
All three are historically tight: US high yield at 267 bp is below the 300 to 500 bp range that counts as normal, and investment grade at 81 bp is at the very tight edge of its 80 to 150 bp band. Euro high yield at 265 bp is inside its US equivalent, which is unusual and sits oddly with European equities having just had their worst day in weeks. Credit is not corroborating the risk-off signal coming from European stocks and the oil market. Either credit is complacent, or the equity move is a sector rotation dressed up as a selloff. The evidence so far leans towards the second: nine of eleven US sectors fell, but none by more than 1.11%, with energy and technology higher and the European damage concentrated in industrials and banks rather than spread across the market. That is a shallow, discriminating move, not a liquidation. Tight spreads still leave very little cushion if it turns out to be the first.
Real Yields (US and Euro Area)
| Region | Nominal 10Y | Expected inflation | Real 10Y | How the real yield is obtained |
|---|---|---|---|---|
| United States | 4.83% | 2.37% (residual) | 2.46% | Measured. TIPS trade, so the market quotes a real yield directly; expected inflation is the residual, the breakeven |
| Euro area | 3.38% | 2.04% (measured) | 1.34% (residual) | Constructed. No euro inflation-linked benchmark is published, so a survey expectation is subtracted from the nominal yield |
US figures from the US Treasury par and real curves, 9 September 2026. Euro nominal from the ECB AAA curve, 8 September 2026; euro inflation expectation from the ECB Survey of Professional Forecasters, 2026 Q3, at 2.037%.
The two rows are built in opposite directions. The US real yield is a price someone actually pays, with expected inflation inferred from it; the euro real yield is inferred from a survey, and nobody trades it. Treat the euro figure as the softer of the two. Two mismatches follow: the US breakeven carries an inflation risk premium that a survey response does not, and the SPF horizon is five years against the bond's ten.
Decomposing the 145 bp nominal gap between the two 10-years gives 33 bp of expected-inflation difference and 112 bp of real-rate difference. Roughly three-quarters of the gap is real, so this is a real-rate story rather than an inflation story, and the split has widened on the real side since early August. Note that the inflation component has grown from 18 bp a month ago to 33 bp now, which is the oil move beginning to show up in US breakevens more than in a quarterly euro survey that has not been re-run.
The US-euro real rate gap is not an investment opportunity
The US real yield has exceeded the euro one in every quarter since 2014, and today's 112 bp is close to typical. It is a structural feature reflecting higher US trend growth, euro-area excess savings, Bund scarcity and US fiscal supply, not a trade a euro-based reader can capture. Hedging the currency cancels it, because the forward rate is set precisely to remove the interest differential; unhedged, buying Treasuries for the real yield is a bet on the dollar wearing a bond's clothing. A real yield is real in its own currency: 2.46% means 2.46% above US inflation, which is not a real return for someone who spends euros. State the gap as a macro fact about relative policy stance and growth expectations, and draw no portfolio conclusion from it.
Bond Portfolio Implications
On current income alone, the US bond wins outright: 4.83% from a 10-year Treasury against a 4.06% earnings yield on the S&P 500, a gap of -0.77 pp. In Europe the equity still wins, 5.67% against 3.38%, a gap of +2.29 pp.
Two structural biases to keep in view before leaning on those numbers. First, the gap ignores growth entirely. A coupon is fixed for a decade while the earnings behind an equity yield grow roughly with inflation, so the gap understates equities by approximately expected inflation. Running it against real yields instead corrects this and is the cleaner statement: +1.60 pp for the US, +4.32 pp for Europe. The correction is worth 2.37 pp in the US, more than the gap itself, and it flips the sign. That magnitude, rather than either version of the number, is the point. Second, an equity holder does not receive the full earnings yield; only the dividend and buyback portion arrives as cash, and the remainder is retained and reinvested at management's discretion. Both caveats matter when the comparison is framed as one of income, as it is here.
The gap describes today's trade-off between two income streams. It is not a forecast, and the cross-country comparison in particular partly measures the difference between two currencies rather than a difference in risk compensation, which is why the real-yield pair is quoted alongside it.
Duration risk. A 100 bp rise in yields costs roughly 8% to 9% on a 10-year bond and considerably more further out. That is the live question here, because the euro curve has moved 23 to 25 bp in a month and an oil shock is a straightforwardly bad environment for duration: it raises inflation, and it pushes the central banks that meet in the next nine days towards tightening. Short duration continues to look like the better-compensated end of the trade. The 2-year Treasury at 4.43% gives up 40 bp against the 10-year while carrying roughly a fifth of the interest-rate sensitivity, and in Europe the 2-year AAA at 2.92% gives up 46 bp against the 10-year for a similar reduction in risk. Reaching for the long end in this environment is being paid very little for a great deal of exposure.
Currencies & Commodities
Currencies:
| Pair | Rate | Source |
|---|---|---|
| EUR/USD | 1.1618 | FRED DEXUSEU (4 Sep 2026) |
| USD Index | 118.07 | FRED DTWEXBGS (4 Sep 2026) |
| USD/JPY | 153.63 | web search (9 Sep 2026) |
| GBP/USD | 1.3555 | web search (9 Sep 2026) |
| USD/CHF | 0.8098 | web search (9 Sep 2026) |
The two FRED series are stale by three business days and predate this week's escalation entirely. The yen at 153.63 was firmer by about 0.23% today, a mild safe-haven bid rather than a flight.
Commodities (all from front-month futures via yfinance):
| Commodity | Price | Day Chg % | Ticker | Source |
|---|---|---|---|---|
| Brent Crude | 101.21 | +3.36% | BZ=F | yfinance |
| WTI Crude | 96.05 | +3.25% | CL=F | yfinance |
| Gold ($/oz) | 4,460.70 | +0.49% | GC=F | yfinance |
| Silver ($/oz) | 68.646 | +2.46% | SI=F | yfinance |
| Copper ($/lb) | 6.8885 | +0.95% | HG=F | yfinance |
| Nat Gas ($/MMBtu) | 2.822 | -3.22% | NG=F | yfinance |
Day changes are settlement to settlement, the 9 September settlement against the 8 September settlement, which is the market convention for a completed session. These are closing figures, not last trades: several contracts traded on for hours after settlement was struck and their last prints differ, WTI's by about 12 cents. Contract months are October for WTI (CLV26) and natural gas (NGV26), November for Brent (BZX26) and December for the metals (GCZ26, SIZ26, HGZ26); the front month is unchanged from the previous session, so no roll distorts any day change here.
Crude is the whole story. Brent above $100 is a level it has touched only briefly this cycle, and its $101.21 settlement is 19.7% below its 52-week high of $126.10 while sitting 72.4% above the 52-week low of $58.72, which is the range that tells you how violently this market has moved in a year. WTI settled at $96.05, 19.6% below its own 52-week high of $119.48. Both contracts' record prices date from July 2008 and describe a different market, so the distance to them carries no useful information today.
Copper set a second consecutive record settlement, closing at $6.8885/lb against the $6.8235 record it set yesterday, up 0.95% on the day and a fraction below its own session high of $6.8915, which is now the 52-week high. The metal is up 52.3% from its 52-week low of $4.5215, driven by mine supply failing to keep pace with data centre, grid and renewables demand, with the tariff scramble and now an energy shock layered on top.
The precious metals split. Gold settled at $4,460.70, 20.1% below its all-time high of $5,586.20, set on 29 January 2026, adding just 0.49% on a day of tanker strikes in the Persian Gulf. Silver settled at $68.646, 43.4% below its all-time high of $121.30 from the same day, but it did move, up 2.46%, the largest gain in the metals complex and well ahead of gold. Both records are inside the last twelve months and coincide with their 52-week highs, so these are real drawdowns from a recent peak. Gold is the one that failed to respond: whatever drove January's spike has unwound and the monetary metal is not currently functioning as the geopolitical hedge its reputation implies, while silver's move looks more like the industrial leg of the same trade that is driving copper.
Natural gas settled at $2.822, down 3.2%, and sits near the bottom of its 52-week range of $2.48 to $7.83. Henry Hub is a domestic North American market, structurally insulated from Gulf shipping risk, and today it went the other way from crude, which is the cleanest illustration available of what this shock is and is not.
Crypto: no notable moves retrieved.
Sector & Theme Highlights
Best performing: energy, on an oil move that goes straight to producer margins, closing up 0.63% against a falling index. Technology was the only other sector to finish higher, up 0.29%, extending the pattern of the past fortnight in which the AI complex absorbs almost none of the macro stress landing on everything else. Communications was close to flat at -0.04%. Only two of the eleven sectors gained on the day and nine fell.
Worst performing: consumer staples at -1.11%, consumer discretionary at -1.05% and industrials at -1.01%. The notable thing about that list is how tight it is: at midday healthcare had been down around 2.5%, but by the close no sector had lost more than 1.11%, so the selling ended up shallower and far more evenly spread than it had been earlier in the session. Breadth was still clearly negative, decliners leading advancers by roughly 16 to 7, and small caps underperformed, the Russell 2000 down 1.30% against the S&P's 0.48%. In Europe, where the session had already finished, the damage stayed concentrated in industrials and banks, the two sectors most exposed respectively to an input-cost shock and to a curve that is repricing faster than the economy behind it.
Themes. The energy shock has become the organising fact of this market, and it discriminates sharply by geography: an energy exporter with a technology-heavy index lost half a point today while energy importers with industrial indices lost between one and two. The AI capex complex remains the market's shock absorber, up on a down day for the third time in a fortnight, which is either a genuine insulation from macro or a very crowded assumption of one. And the electrification theme, which shows up as copper at record highs, is now compounding with the energy shock rather than being offset by it.
Top Stories (Global)
- US Central Command destroyed five Iranian oil tankers, including one near Kharg Island, the terminal handling the bulk of Iran's crude exports, in response to Iranian ballistic missile attempts against US warships. This moved the conflict from a shipping-risk story to an export-infrastructure story.
- Iran said it had attacked more than a dozen vessels attempting to transit the Strait of Hormuz without its permission. Roughly a fifth of the world's seaborne crude passes through the strait, and the risk premium now embedded in Brent reflects the possibility of genuine interruption rather than harassment.
- Brent crude settled above $100 for the first time since late July, at $101.21, with WTI at $96.05, up 3.36% and 3.25% respectively and roughly 25% since early August.
- The 10-year Bund reached 3.40%, its highest since April 2011, with French yields at their highest since November 2008 and Dutch yields at 15-year highs, one day before an ECB decision at which consensus expects a 25 bp rise to 2.50%.
- European equities fell to one-week lows, the STOXX 600 down 1.41% with industrials and banks worst hit, a materially sharper reaction than the 0.48% decline in the S&P 500.
- COMEX copper set a second consecutive record settlement at $6.8885/lb, above yesterday's record of $6.8235.
- Technology was one of only two S&P 500 sectors to close higher, up 0.29%, with Oracle's first-quarter fiscal 2027 results due after Thursday's close and the AI infrastructure read-across the reason the whole complex is watching.
Looking Ahead
Central banks - Thursday 10 September: ECB decision. Consensus expects a 25 bp rise in the deposit rate to 2.50%, the first move of this cycle. Today's oil move makes the decision itself close to a formality and shifts everything onto the press conference: the question is whether Lagarde treats an energy shock as a reason to keep going or as a reason to pause after one move. The euro curve has repriced 23 to 25 bp in a month already. - Wednesday 16 September: FOMC. Roughly 65% priced for 25 bp, with bill pricing implying much the same, supported by August payrolls of +162,000 and unemployment at 4.1%. - Thursday 17 to Friday 18 September: BOJ. About 63% priced for a move from 1.00%. The bank has explicitly named crude and the weak yen in its inflation warning, so today's move helps the hawks.
Economic releases - Thursday 10 September: US PPI for August, before the open and hours before the ECB. - Friday 11 September: US CPI for August, the last major print before the FOMC. Consensus is around +0.4% m/m and 3.4% y/y headline with core at 2.4%. It will contain only the earliest part of the crude pass-through; September's print will carry far more. - Euro area final HICP follows the ECB decision.
Earnings - Thursday 10 September: Oracle reports first-quarter fiscal 2027 results after the US close, with consensus around $19.1bn of revenue and $1.30 of EPS. The stock has now risen roughly 10% across two sessions into it.
Geopolitical - Middle East supply risk is the dominant variable in every asset class right now. The specific escalation to watch is whether attacks extend from tankers to fixed export infrastructure, and whether transit through Hormuz is genuinely interrupted rather than threatened. - The US-Canada tariff round remains in effect, and French fiscal risk and German politics both continue to feed the European rate story.
Market closures - No closures in the next five trading days across the US, UK, Germany, France, Japan, Australia, Switzerland, Canada, Korea or Brazil. - Further out: Japan 21 September (Respect for the Aged Day) and 23 September (Autumnal Equinox Day), the first falling three days after the BOJ decision; Korea 24 to 26 September (Chuseok); Canada 30 September (National Day for Truth and Reconciliation). - The holiday cache holds no data for India, so Indian closures cannot be checked from it.