2026 06 29
Global Financial Briefing — Monday, 29 June 2026
Market Overview
Global markets are firmly in risk-on mode to open the week, led by a sharp tech-driven surge on Wall Street. The S&P 500 is up ~1.1% and the Nasdaq 100 is rallying 2.2% intraday, with two distinct catalysts driving the move: the US Supreme Court's rejection of a challenge to Fed Governor Lisa Cook's appointment (removing uncertainty around Federal Reserve independence) and reports that the US and Iran have agreed to stand down from retaliatory attacks, with diplomacy described as "on track." Together, these two developments — one domestic/institutional, one geopolitical — have cleared a cloud of uncertainty that had weighed on sentiment through late June. Oil prices are also rising as the Iran premium fades to modest levels rather than spiking; markets are interpreting a pause rather than resolution. Alphabet's addition to the Dow Jones Industrial Average is adding another 4%+ contributor to tech's momentum.
European markets closed ahead of the US rally and posted a mixed session — indices essentially flat to marginally negative, with the STOXX 600 barely changed (+0.04%) and CAC 40, DAX, and FTSE all down slightly, reflecting cautious positioning ahead of a data-heavy week. Asia-Pacific delivered broadly positive results for its Monday session: Hang Seng gained 1.6%, Shanghai rose 1.2% on momentum from China re-opening stimulus, and the Nikkei edged up 0.15% despite continuing JPY weakness following the BOJ's historic rate hike to 1.0% on June 16.
The overarching macro backdrop remains complex. US headline CPI has re-accelerated sharply to 4.17% YoY in May 2026 — up from 2.39% in January — almost certainly reflecting tariff pass-through. Core CPI remains more contained at 2.82%, but the gap between headline and core is the widest in three years. The Fed, holding at 3.50–3.75%, is navigating a genuine dilemma: real policy rates (relative to headline inflation) are negative, yet cutting would risk entrenching inflation. Credit markets are signalling no distress — US high-yield spreads at 283 bps are at historically tight levels — but the negative equity risk premium (-0.63%) for the S&P 500 remains a structural concern for long-term equity investors, even as the current momentum is upward.
Global Indices Snapshot
Americas
US and Brazilian markets in REGULAR session (intraday pricing as of ~13:00 ET).
| Index | Level | Day Chg | Day Chg % | Source |
|---|---|---|---|---|
| S&P 500 | 7,435.56 | +81.54 | +1.11% | yfinance ^GSPC (intraday) |
| Nasdaq 100 | 29,748.54 | +630.30 | +2.16% | yfinance ^NDX |
| Dow Jones | 52,219.92 | +343.81 | +0.66% | yfinance ^DJI |
| Brazil IBOV | 173,522.7 | +227.56 | +0.13% | yfinance ^BVSP |
FRED SP500 last official close: 7,354.02 (26 Jun). Today's intraday S&P level is from yfinance; session ongoing. 52-week range: 6,174.97–7,620.90. S&P trades 2.4% below its 52-week high.
Europe
European data reflects today's close (29 Jun).
| Index | Level | Day Chg | Day Chg % | Source |
|---|---|---|---|---|
| Euro STOXX 600 | 636.11 | +0.23 | +0.04% | yfinance ^STOXX |
| Euro STOXX 50 | 6,231.63 | +10.08 | +0.16% | yfinance ^STOXX50E |
| CAC 40 | 8,367.33 | -17.54 | -0.21% | yfinance ^FCHI |
| DAX | 24,626.89 | -44.33 | -0.18% | yfinance ^GDAXI |
| FTSE 100 | 10,484.22 | -23.80 | -0.23% | yfinance ^FTSE |
| SMI (Swiss) | 14,223.90 | +51.19 | +0.36% | yfinance ^SSMI |
Asia-Pacific
Asia-Pacific data reflects today's close (29 Jun).
| Index | Level | Day Chg | Day Chg % | Source |
|---|---|---|---|---|
| Nikkei 225 | 69,468.11 | +107.23 | +0.15% | yfinance ^N225 |
| Hang Seng | 23,026.68 | +354.82 | +1.57% | yfinance ^HSI |
| Shanghai Comp | 4,073.90 | +46.64 | +1.16% | yfinance 000001.SS |
| ASX 200 | 8,823.40 | +59.20 | +0.68% | yfinance ^AXJO |
| Kospi (Korea) | 8,394.65 | -16.56 | -0.20% | yfinance ^KS11 |
| India Nifty 50 | 23,946.25 | -109.75 | -0.46% | yfinance ^NSEI |
Emerging Markets
US session in progress (29 Jun).
| Index | Level | Day Chg % | Source |
|---|---|---|---|
| MSCI EM (EEM) | 67.32 | +0.19% | yfinance EEM |
| India Nifty 50 | 23,946 | -0.46% | yfinance ^NSEI |
| South Africa | (not retrieved) | — | yfinance ^J203 |
Index Valuations & Investment Risk
Valuation Table
| Index | Trailing P/E (live) | Hist avg trailing P/E (†) | Premium vs hist avg |
|---|---|---|---|
| S&P 500 | 26.53x | ~16–18x | +56.1% ⚠️ |
| Nasdaq 100 | 33.22x | ~25–30x | +20.8% ⚠️ |
| Euro STOXX 600 | 18.13x | ~15–17x | +13.3% |
| CAC 40 | 17.49x | ~14–16x | +16.6% |
| DAX | 17.98x | ~15–17x | +12.4% |
| FTSE 100 | 17.68x | ~13–15x | +26.3% ⚠️ |
| Nikkei 225 | 23.64x | ~20–22x | +12.6% |
| MSCI EM | 17.82x | ~13–15x | +27.3% ⚠️ |
(†) Hist avg trailing P/E: static long-run reference constants. Premium computed as (live P/E ÷ midpoint of hist avg range − 1) × 100%. ⚠️ = >20% above historical average.
Trailing P/E sourced from yfinance trailingPE on ETF proxies: SPY (S&P 500), QQQ (Nasdaq 100), EXSA.DE (STOXX 600), CAC.PA (CAC 40), EXS1.DE (DAX), ISF.L (FTSE 100), 1321.T (Nikkei 225), EEM (MSCI EM).
Investment Risk Assessment for ETF Investors
United States (S&P 500 / Nasdaq ETFs)
The US equity market carries the most stretched valuation of any major region. The S&P 500's trailing P/E of 26.53x sits 56% above its long-run historical average — well into the "historically stretched" zone (>40% above avg). The earnings yield is (1÷26.53) = 3.77%, which is meaningfully lower than the current 10Y Treasury yield of 4.40% (FRED DGS10, 2026-06-25), producing a negative equity risk premium of −0.63%. This is one of the most bearish valuation configurations for equities vs bonds since the late 1990s and early 2000s.
The 10Y TIPS real yield (FRED DFII10) stands at 2.19% — well above zero — indicating a genuinely restrictive real discount rate for future earnings. The S&P 500 trades 2.4% below its 52-week high of 7,620.90, is above both its 50-day MA (7,363) and 200-day MA (6,925), and VIX at 18.41 signals only moderate near-term fear. Credit spreads are historically tight, suggesting markets are not pricing in material default risk. The Nasdaq 100 at 33.22x trailing P/E (21% above its long-run avg) reflects the same theme: AI-driven earnings growth is being priced in at high multiples.
Risk score: High valuation risk / low margin of safety. The near-term momentum is strong, but the negative ERP and elevated real yields represent a structural headwind, particularly if headline inflation remains elevated and the Fed is unable to cut rates.
Europe (STOXX 600 / CAC 40 / DAX ETFs)
European equities offer a far better valuation picture. The STOXX 600 trailing P/E of 18.13x is 13% above its long-run average — elevated but not extreme. The Euro ERP = (1÷18.13) = 5.52% − 2.86% (Germany 10Y Bund, web search, 2026-06-26) = +2.66% — comfortably positive and among the most attractive in the developed world. The DAX (17.98x, 12% above avg) and CAC 40 (17.49x, 17% above avg) similarly offer meaningful earnings yield over Bund rates.
For the CAC 40 in particular, the OAT-Bund spread (most recent data: ~69 bps as of late May 2026) reflects manageable French fiscal risk. The BTP-Bund spread on Italy (approximately 78 bps, derived from BTP 10Y ~3.64% minus Bund 10Y 2.86%) is near multi-year lows — a positive signal for peripheral risk appetite. Currency risk: EUR/USD at 1.147 (FRED DEXUSEU, 2026-06-18) means USD-based investors have benefited from EUR strength over the past year.
Risk score: Moderate — relative value attractive vs US, manageable fiscal risks, positive ERP.
Japan (Nikkei / TOPIX ETFs)
The Nikkei at 23.64x trailing P/E is 13% above its long-run average. ERP = (1÷23.64) = 4.23% − 2.61% (JGB 10Y, web search, 2026-06-27) = +1.62% — positive but compressing. The critical variable is the BOJ: its June 16 hike to 1.0% (highest since 1995) signals ongoing normalisation. USD/JPY at 161.80 (web search, 2026-06-25) means the yen remains structurally weak despite the hike — JPY currency hedging costs are elevated for EUR-based investors, though unhedged exposure to a strengthening yen remains a structural bet worth considering. Corporate governance reforms continue to be a positive multi-year tailwind.
Risk score: Moderate — BOJ policy trajectory is the key risk; JPY hedging critical for non-JPY investors.
Emerging Markets (MSCI EM ETFs)
MSCI EM (EEM, 17.82x) trades 27% above its historical average — the second most elevated region after the US and FTSE. The earnings yield is (1÷17.82) = 5.61%, but EM carries additional currency risk, political risk, and commodity sensitivity. China's weight in EM indices (via Hang Seng and Shanghai, both up today on stimulus tailwinds) continues to be a concentration risk. Hang Seng at 23,027 is 14.6% below its 52-week high of 28,056 and also below its 50-day (25,372) and 200-day (25,942) moving averages — technically bearish on a relative basis despite today's bounce.
Risk score: Moderate — valuation elevated vs own history; China remains the swing factor.
Disclaimer: This is financial information, not personalised investment advice. Past valuations do not guarantee future returns. Consult a financial advisor before investing.
US Economic Indicators (FRED — authoritative)
| Indicator | Current | Prior | Delta | Reference Date | FRED Series |
|---|---|---|---|---|---|
| CPI YoY % | 4.17% | 3.78% | +0.39pp | May 2026 | CPIAUCSL |
| Core CPI YoY % | 2.82% | 2.74% | +0.08pp | May 2026 | CPILFESL |
| Unemployment Rate | 4.3% | 4.3% | flat | May 2026 | UNRATE |
| Nonfarm Payrolls | +172K | +179K | −7K | May 2026 | PAYEMS |
| 10Y TIPS Real Yield | 2.19% | — | — | 25 Jun 2026 | DFII10 |
FRED macro data is monthly, typically lagging 4–6 weeks. NFP delta shows month-over-month change in thousands. Prior CPI/Core CPI reflects April 2026 readings.
Key concern: Headline CPI has re-accelerated from 2.39% in January 2026 to 4.17% in May — a 178 basis point surge over four months. Core CPI at 2.82% is rising more slowly, pointing to energy and goods (likely tariff-impacted) as the main drivers. With the Fed holding at 3.50–3.75%, the real policy rate relative to headline CPI is now negative (3.63% effective FFR − 4.17% CPI = −0.54%). The labour market remains solid: unemployment steady at 4.3% and +172K NFP is healthy, limiting the Fed's room to respond to any growth slowdown with cuts.
Economic releases this week (week of 29 Jun 2026): Holiday-shortened week (US markets closed Friday 3 July). Key expected releases include US ISM Manufacturing (Tuesday), JOLTS (Wednesday), ADP private payrolls (Wednesday), and June NFP (likely moved to Thursday 2 July given the Friday holiday). US Initial Jobless Claims also expected this week.
Fixed Income & Bond Analysis
All US Treasury yields from FRED (as of 2026-06-25). European yields from web search.
Policy Rates
| Central Bank | Rate | Source |
|---|---|---|
| Fed Funds (upper) | 3.75% | FRED DFEDTARU (2026-06-29) |
| Fed Funds (lower) | 3.50% | FRED DFEDTARL (2026-06-29) |
| Effective FFR | 3.63% | FRED DFF (2026-06-25) |
| ECB Deposit Rate | 2.25% | FRED ECBDFR (2026-06-29) |
| BOJ Policy Rate | 1.00% | web search (BOJ, 2026-06-16) |
| BOE Bank Rate | ~3.73% | FRED IUDSOIA / SONIA proxy (2026-06-25) |
The BOJ's June 16 hike to 1.0% — the highest policy rate in Japan since 1995 — is the most significant recent central bank action globally. The ECB continues its cutting cycle, having reduced the deposit rate from a peak of 4.0% in 2024; at 2.25%, the ECB is now approaching what most estimates place as the neutral rate (estimated 2.0–2.5%). The Fed has been on hold as inflation re-accelerates.
Government Bond Yields
| Country | 2Y Yield | 10Y Yield | 30Y Yield | Source / Date |
|---|---|---|---|---|
| USA | 4.09% | 4.40% | 4.86% | FRED (2026-06-25) |
| Germany | (n/a) | 2.86% | (n/a) | web search (2026-06-26) |
| France | (n/a) | (n/a) | (n/a) | (not found for today) |
| UK | 4.18% | 4.736% | (n/a) | web search (2Y: Jun 18; 10Y: Jun 29) |
| Japan | (n/a) | 2.61% | (n/a) | web search (2026-06-27) |
| Italy | (n/a) | ~3.64% | (n/a) | web search (recent data) |
Note: ECB YC API returned HTTP 503 today; only partial European yields available via web search. France OAT 10Y and Bund 2Y/30Y not retrieved for today. Italy BTP 10Y approximate.
Estimated BTP-Bund 10Y spread: ~78 bps (3.64% − 2.86%), computed from data with slightly different observation dates.
OAT-Bund spread: Most recent available data is 69 bps as of late May 2026. Current level not retrieved.
Yield Curve Spreads (FRED pre-computed, as of 2026-06-26)
- 10Y-2Y spread: +31 bps (FRED T10Y2Y, 2026-06-26) — modestly positive, normalising after an extended inversion. The curve is flat by historical standards but no longer inverted; the recession signal from this spread has faded.
- 10Y-3M spread: +55 bps (FRED T10Y3M, 2026-06-26) — positive, confirming the curve has fully un-inverted across all standard maturities. Neither spread signals imminent recession risk on its own.
- Context: The normalisation of the yield curve from a deep inversion (2022–2024) to flat-to-positive reflects the Fed's rate cuts from the 5.25–5.50% peak. However, the re-acceleration of CPI may limit further cuts and keep the short end elevated.
Yield Curve Charts
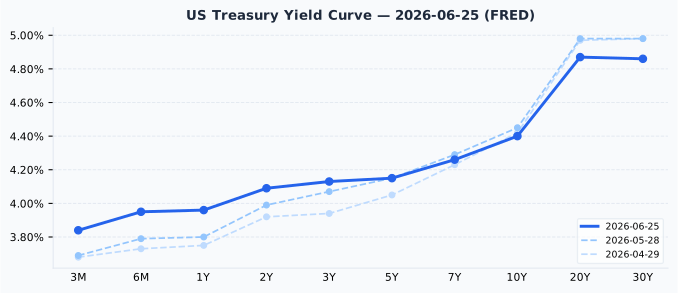
The US curve (FRED, 2026-06-25) shows a modestly upward-sloping short-to-medium segment (3.84% at 3M to 4.40% at 10Y) that steepens sharply at the ultra-long end (4.87% at 20Y, 4.86% at 30Y). Relative to one month ago (FRED, 2026-05-28), the 3M-to-7Y segment has risen by 11–15 bps as CPI re-accelerated and markets priced out Fed cuts, while the 10Y-30Y segment has compressed 9–12 bps — a classic bull-flattening dynamic at the long end.
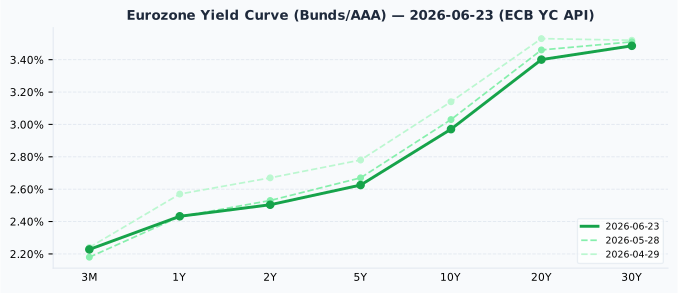
The ECB AAA yield curve (most recent available: ECB API, 2026-06-23) shows a gently upward-sloping structure from 2.23% (3M) to 2.97% (10Y) and 3.49% (30Y). Compared to one month ago (2026-05-28), the entire ECB curve has shifted down 5–10 bps, reflecting continued ECB easing and softer European inflation data. The curve has also steepened slightly — the ECB appears closer to its terminal rate at the short end, and long-term inflation expectations remain anchored.
Sanity check: US 3M yield (3.84%) vs Fed Funds midpoint ((3.50+3.75)/2 = 3.625%): deviation of 21 bps — within the 50 bps tolerance.
Credit Markets (FRED — authoritative, as of 2026-06-26)
FRED OAS spreads converted from percentage points to basis points (×100).
| Market | OAS Spread | Interpretation | FRED Series |
|---|---|---|---|
| US Investment Grade | 77 bps | Historically tight | BAMLC0A0CM |
| US High Yield | 283 bps | Historically tight | BAMLH0A0HYM2 |
| Euro High Yield | 267 bps | Historically tight | BAMLHE00EHYIOAS |
All three credit spreads are well inside their long-run "normal" ranges (US HY normal: 300–500 bps; US IG normal: 80–150 bps). At 283 bps, US HY is below the bottom of its normal range — a historically tight level that signals either very strong credit conditions, elevated complacency, or both. Similarly, US IG at 77 bps sits below the 80 bps floor of its normal range. This is consistent with a benign credit environment but also raises the question of whether risk is being adequately compensated.
Bond Portfolio Implications
The US equity risk premium remains negative at −0.63% (earnings yield 3.77% minus 10Y Treasury 4.40%). This is unusual and historically associated with compressed forward equity returns over a 3–5 year horizon. Bonds are offering more yield than equities on an earnings basis for US investors for the first time in decades.
Europe presents the opposite picture: Euro ERP at +2.66% means European equities offer a meaningful return premium over Bunds. For a EUR-based investor, the risk-adjusted case for European equities over core government bonds remains positive.
Duration risk context: a 100 bps rise in the 10Y yield would produce approximately 8–9% price loss on a 10-year bond. With inflation uncertainty elevated and 10Y Treasuries at 4.40%, the risk of a further yield rise (if CPI continues to climb) remains real. Short duration and floating-rate exposure are natural hedges in this environment; ultra-long duration (20Y–30Y) appears unattractive given the 4.87% level and the inflation risk.
Currencies & Commodities
Currencies:
| Pair | Rate | Source / Date |
|---|---|---|
| EUR/USD | 1.1470 | FRED DEXUSEU (2026-06-18 — stale) |
| USD Index | 120.40 | FRED DTWEXBGS (2026-06-18 — stale) |
| USD/JPY | 161.80 | web search (2026-06-25) |
| GBP/USD | 1.3191 | web search (2026-06-25) |
| USD/CHF | 1.2344 | web search (2026-06-25) |
Note: FRED DEXUSEU and DTWEXBGS data is published with a 10+ day lag — most recent available is 2026-06-18. More current FX rates from web search are as of June 25.
USD/JPY at 161.80 is striking: despite the BOJ hiking to 1.0% on June 16, the yen remains under significant downward pressure, suggesting the rate differential with the US (Fed Funds 3.63% vs BOJ 1.0%) continues to overwhelm the BOJ's policy signal. The BOJ's stated path of further hikes toward a neutral rate of ~2% may eventually provide a floor for the yen.
Commodities (all from yfinance MCP front-month futures, 2026-06-29):
| Commodity | Price | Day Chg % | Ticker | % vs ATH |
|---|---|---|---|---|
| Brent Crude ($/bbl) | 73.77 | +1.61% | BZ=F | -50.0% |
| WTI Crude ($/bbl) | 70.60 | +1.98% | CL=F | -52.1% |
| Gold ($/troy oz) | 4,031.50 | -1.58% | GC=F | -27.8% |
| Silver ($/troy oz) | 58.76 | -1.53% | SI=F | -51.6% |
| Copper ($/lb) | 6.178 | -0.47% | HG=F | -7.1% |
| Nat Gas ($/MMBtu) | 3.166 | -3.45% | NG=F | -79.9% |
Oil: WTI (+1.98%) and Brent (+1.61%) are climbing on US-Iran de-escalation news — the ceasefire signal removes an acute supply-disruption tail risk, but markets are treating it cautiously. WTI at $70.60 is 52.1% below its all-time high of $147.27; Brent at $73.77 is 50.0% below its all-time high of $147.43. Both trade in the mid-range of their 52-week bands.
Gold: At $4,031.50/oz, gold is 27.8% below its all-time high of $5,586.20, which was also the 52-week high — meaning gold peaked earlier this year and has since corrected meaningfully. The daily decline of 1.58% today is consistent with risk-on rotation: as equities surge and geopolitical fear recedes, gold as a safe haven gives back some ground. The 52-week low is $3,262.00, so gold remains elevated in historical terms.
Silver: At $58.76/oz, silver is 51.6% below its all-time high of $121.30 (also reached within the past 52 weeks), reflecting an exceptionally volatile year. The deeper percentage decline vs gold suggests industrial demand concerns outweigh monetary demand for silver in the current environment.
Copper: At $6.178/lb, copper is 7.1% below its all-time high of $6.6525 — still close to record levels and signalling continued strength in industrial and energy-transition demand. The 52-week low is $4.32/lb, underscoring how far copper has run.
Natural Gas: At $3.166/MMBtu, Henry Hub nat gas is 79.9% below its all-time high of $15.78 and also below its 52-week high of $7.827. The -3.45% move today reflects mild weather expectations and ample storage.
Crypto: No notable moves >3% reported in major cryptocurrencies today.
Sector & Theme Highlights
Leading themes today: - AI/Tech mega-cap renaissance: Nasdaq +2.2% led by Alphabet (+4%+), which joins the Dow Jones Industrial Average. The tech sector is repricing AI monetisation as more credible, driving outsized PE multiples (QQQ at 33.22x). AI infrastructure spending remains a macro growth driver that partly justifies premium valuations. - Geopolitical de-escalation: US-Iran "stand down" lifts risk appetite globally. Energy stocks are mixed — oil prices are rising but the risk premium compression counterbalances the price move. - Media restructuring: Comcast's planned spinoff of its media and tech businesses (+6%) is the most significant corporate restructuring announcement of the session, reflecting the accelerating disruption of traditional media by streaming and tech platforms. - Materials/Industrials M&A: Martin Marietta's $13.5B Lhoist deal (-2.9%) highlights ongoing consolidation in the building materials sector, but the market is penalising dilution. - BOJ policy normalisation: With BOJ at 1.0%, Japanese banks and financials are benefiting from wider lending margins — a domestic Japanese equity theme. - Inflation trade: The CPI re-acceleration to 4.17% keeps real assets (commodities, TIPS, infrastructure) in focus as an inflation hedge. However, today's gold decline shows the trade is not one-directional.
Worst performing globally: - Safe-haven assets: gold and silver declining on risk-on; nat gas under pressure on seasonality; yen weak on BOJ/Fed differential. Korea (-0.20%) and India (-0.46%) underperformed in Asia.
Top Stories (Global)
- Supreme Court rejects challenge to Lisa Cook's Fed seat: The ruling removes uncertainty around Federal Reserve Board independence and composition. Markets cheered the stability signal — it reduces the tail risk of political interference in monetary policy.
- US-Iran de-escalation: Both countries reportedly agree to pause retaliatory attacks, with diplomatic talks described as "on track." Oil prices rise modestly but have not spiked — markets see a pause rather than a lasting resolution.
- Alphabet joins Dow Jones: As of today, Alphabet (Google parent) replaces an outgoing constituent in the DJIA. Its first day as a Dow member saw a 4%+ gain, adding significant index points to the Dow. This cements Big Tech's dominance in benchmark indices.
- Comcast announces spinoff plan (+6%): The media conglomerate plans to split its media and technology businesses into two separately publicly traded companies. The separation is expected within approximately one year. Signals confidence in unlocking hidden value via focused pure-play entities.
- Martin Marietta / Lhoist deal ($13.5B, stock −2.9%): Building materials consolidation; market concerned about dilution and integration risk.
- BOJ rate at 31-year high: The June 16 hike to 1.0% — the BOJ's highest rate since 1995 — continues to reverberate. Board member Tamura indicated further hikes toward a 2% neutral rate at quarterly intervals. JPY weakness persisting at 161.8 vs USD despite hike.
- US CPI re-acceleration (released last month): May CPI at 4.17% YoY (up from 3.78% in April) is the most significant fundamental data point shaping the macro backdrop this week. The Fed's next move is now genuinely uncertain — market expectations may be shifting toward a longer hold.
Looking Ahead
Key events in the next 5 trading days (week of 29 June – 3 July 2026):
Economic calendar: - Monday 29 Jun: Dallas Fed Manufacturing Index (US) - Tuesday 30 Jun: US ISM Manufacturing PMI; Chicago PMI; JOLTS Job Openings; Eurozone CPI flash estimate (June) - Wednesday 1 Jul: ADP US private payrolls (June); US factory orders; Eurozone/UK/Germany manufacturing PMIs - Thursday 2 Jul: US June Nonfarm Payrolls (likely moved from Friday due to holiday); Initial Jobless Claims; US Trade Balance - Friday 3 Jul: US Independence Day (observed) — US markets closed. Canada markets also closed (Canada Day falls Saturday 28 Jun; some exchanges may observe on Friday or Monday)
Market closures (from 2026 holiday calendar): - Friday 3 July 2026: US Independence Day (observed) — NYSE, NASDAQ, CME closed. Shortened trading week. - Wednesday 1 July 2026: Canada Day — TSX closed.
Central bank & earnings calendar: - No major central bank meetings this week (next FOMC is late July; next ECB is mid-July). - Earnings season effectively between cycles; Q2 earnings season begins in earnest mid-July.
Geopolitical watch: - US-Iran diplomatic track: whether the "stand down" translates into a more durable agreement or breaks down. - BOJ next policy meeting: July — market will watch CPI data to gauge pace of further hikes. - US-China trade: ongoing tariff situation continues to be the likely driver behind headline CPI acceleration.