2026 08 31
Global Financial Briefing — Monday, 31 August 2026
Americas index levels, the US-listed ETF rows (EEM, EZA) and every day change attached to them reflect the 31 August closing print. US Treasury figures, the curve spreads and the US yield curve chart use Treasury's settled 31 August par and real curves. The six commodity rows are the last trade of the 31 August session rather than the exchange settlement, which had not published in time; the basis line under that table says so. Currencies, macro releases, policy rates, the euro area bond rows and the ECB yield curve chart are dated inline.
Market Overview
The dominant story today is a synchronised selloff at the short end of the global government bond curve, and it is the same story on three continents. Japan's 2-year JGB touched a 31-year high, Germany's 2-year bund reached its highest level since July 2024, and short rates rose in parallel across the UK, Spain, Portugal, Poland and Switzerland. The US settled move was much smaller than the day's live quotes implied. The 10-year finished at 4.75%, up 2.0 bp, the 30-year at 5.25%, up 3.0 bp, and the 5-year at 4.49%, up 1 bp, while the 2-year was unchanged at 4.34% and the 3-month rose 1 bp to 3.91% (US Treasury par curve, 2026-08-31). So the US barely participated in the front-end story that defined the session elsewhere: its own front end sat still, and what movement there was came from the belly and the long end. Friday's settled curve had delivered the sharper move, with the 2-year up 14 bp to 4.34% and the 10-year up 6 bp to 4.73%.
The proximate cause is a repricing of the policy path in the wrong direction for risk assets. Fed Chair Kevin Warsh, speaking at a G20 conference this morning, characterised the environment as "one of a global investment surge," a framing that markets read as hawkish and that pushed expectations toward a hike at the next meeting rather than a cut. The dollar firmed on it, the yen broke through 160 and is now on intervention watch, and the front end sold off. Energy is the second leg of the same argument: crude jumped on renewed fighting around the Strait of Hormuz, after US forces struck Iranian missile launchers and the 60-day deadline for a negotiated end to the conflict expired with no talks scheduled (web, 2026-08-31). WTI ended the session up 3.49% at $86.31 and Brent up 2.80% at $88.53. Higher energy feeds directly into the inflation prints that are keeping central banks defensive, and Germany's flash CPI this morning made the mechanism visible: headline inflation at 2.9% came in below the 3.0% consensus, which is the good news, but it is up from 2.8% and the acceleration is almost entirely energy, which rose 10.5% year on year against 8.3% in July.
Equities took this poorly nearly everywhere. Europe closed broadly lower with the DAX off 1.17% and the Euro STOXX 50 off 1.01%, but the US closed mixed rather than uniformly lower: the Dow fell 0.70% and the S&P 500 0.33%, while the Nasdaq 100 recovered through the afternoon to finish 0.08% higher, having been down 0.33% at midday. There are three further exceptions worth naming. Brazil's IBOV closed up 1.00%, the strongest major index of the day, helped by the energy complex. The Shanghai Composite gained 0.86%, largely insulated from the developed-market rate story. And the FTSE 100 is unchanged because the UK is closed for the Summer Bank Holiday, so London sat out the session entirely. Volatility has not confirmed the equity weakness: the VIX closed Friday at 14.43 (FRED VIXCLS, 2026-08-28), a low reading, and credit spreads remain historically tight. This is a rates event being transmitted into equities through the discount rate, not a growth scare or a credit event.
Global Indices Snapshot
Americas
| Index | Level | Day Chg | Day Chg % | Source |
|---|---|---|---|---|
| S&P 500 | 7,686.14 | -25.62 | -0.33% | yfinance ^GSPC |
| Nasdaq 100 | 29,456.97 | +23.55 | +0.08% | yfinance ^NDX |
| Dow Jones | 53,185.90 | -374.09 | -0.70% | yfinance ^DJI |
| Brazil IBOV | 177,418.78 | +1,754.16 | +1.00% | yfinance ^BVSP |
Americas data reflects the 31 Aug close. The Dow's 0.70% fall against the Nasdaq 100's 0.08% gain says the damage is in the value and cyclical end rather than in large-cap technology, which is the reverse of the pattern a pure rate shock usually produces. The afternoon widened that split rather than narrowing it: at midday the Nasdaq 100 was down 0.33% alongside the Dow, and it was the last few hours that separated them.
Europe
| Index | Level | Day Chg | Day Chg % | Source |
|---|---|---|---|---|
| Euro STOXX 600 | 651.10 | -4.06 | -0.62% | yfinance ^STOXX |
| Euro STOXX 50 | 6,420.16 | -65.51 | -1.01% | yfinance ^STOXX50E |
| CAC 40 | 8,334.50 | -66.68 | -0.79% | yfinance ^FCHI |
| DAX | 26,258.11 | -311.88 | -1.17% | yfinance ^GDAXI |
| FTSE 100 | 10,824.26 † | — | — | yfinance ^FTSE |
| SMI (Swiss) | 14,286.43 | -113.34 | -0.79% | yfinance ^SSMI |
† FTSE 100: 31 August is the Summer Bank Holiday in the UK, so the London market was closed today. The level shown is the 28 August close.
Continental European data reflects today's close (31 Aug). The DAX gave back more than it gained on Friday, dropping back below its 52-week high of 26,618.74, which it had closed within a couple of points of on Friday.
Asia-Pacific
| Index | Level | Day Chg | Day Chg % | Source |
|---|---|---|---|---|
| Nikkei 225 | 66,311.93 | -93.63 | -0.14% | yfinance ^N225 |
| Hang Seng | 25,566.99 | -17.80 | -0.07% | yfinance ^HSI |
| Shanghai Comp | 3,986.30 | +34.12 | +0.86% | yfinance 000001.SS |
| ASX 200 | 9,076.00 | -16.30 | -0.18% | yfinance ^AXJO |
| Kospi (Korea) | 6,820.02 | +31.14 | +0.46% | yfinance ^KS11 |
Asia-Pacific data reflects today's close (31 Aug). Day changes match the levels published in Friday's briefing. Asia was notably calm given that its own bond market produced the day's most extreme print: the Nikkei fell only 0.14% on a session in which the 2-year JGB hit a 31-year high.
Emerging Markets
| Index | Level | Day Chg % | Source |
|---|---|---|---|
| MSCI EM (EEM) | 67.02 | -0.18% | yfinance EEM |
| India Nifty 50 | 24,080.40 | -0.39% | yfinance ^NSEI |
| South Africa | 70.50 | -0.31% | yfinance EZA |
EEM and EZA are US-listed ETFs and reflect the 31 Aug close. The Nifty 50 reflects today's Indian close. EZA's fall tracks the softness in precious metals, to which it is heavily weighted through its mining constituents, and it more than halved into the close as the metals pared their losses.
Index Valuations & Investment Risk
Valuation Table
| Index | Trailing P/E (live) | Hist avg trailing P/E (†) | Premium to hist mid |
|---|---|---|---|
| S&P 500 | 25.78x | ~16-18x | +51.7% |
| Nasdaq 100 | 30.53x | ~25-30x | +11.0% |
| Euro STOXX 600 | 17.92x | ~15-17x | +12.0% |
| CAC 40 | 17.10x | ~14-16x | +14.0% |
| DAX | 19.01x | ~15-17x | +18.8% |
| FTSE 100 | 18.20x | ~13-15x | +30.0% |
| Nikkei 225 | 22.33x | ~20-22x | +6.3% |
| MSCI EM | 17.38x | ~13-15x | +24.1% |
(†) Hist avg trailing P/E: static long-run reference constants, not live data.
Trailing P/E (live): yfinance trailingPE on ETF proxies (SPY, QQQ, EXSA.DE, CAC.PA, EXS1.DE,
ISF.L, 1321.T, EEM). Bold marks a premium above 20% to the historical midpoint. The FTSE 100
reading is Friday's, since London did not trade today.
Investment Risk Assessment for ETF Investors
United States (S&P 500 / Nasdaq ETFs)
The S&P 500 at 25.78x trailing earnings sits 52% above the midpoint of its long-run range, by a wide margin the most stretched entry in the table. Its earnings yield is 3.88% (1÷25.78) against a settled 10-year Treasury of 4.75% (US Treasury par curve, 2026-08-31), so the earnings yield gap is -0.87 pp: on settled prices the government bond pays more current income than the index does. Put both legs on the same inflation footing, using the 10-year TIPS real yield of 2.44% (US Treasury real curve, 2026-08-31), and the gap is +1.44 pp. The correction is 2.31 pp wide and flips the sign, which is the number actually worth carrying away: whether this comparison reads as "bonds win" depends almost entirely on whether the two legs are measured consistently. Note also that an equity holder does not receive the full 3.88%; only the dividend and buyback portion arrives as cash, and the rest is retained inside the businesses.
The index closed at 7,686.14, above its 50-day (7,563.79) and 200-day (7,118.72) moving averages and 1.7% below its 52-week high of 7,816.70, so the trend structure is intact despite today's move. The risk that repriced today is the rate path. A market carrying a 52% valuation premium is a long-duration asset in the literal sense, and a Fed chair talking about an investment surge rather than a slowdown moves the discount rate the wrong way for exactly the highest-multiple holdings. The Nasdaq 100 at 30.53x is only 11% above its own historical range, which reads as reassuring until you note that the range was set in a materially lower-rate era.
Europe (STOXX 600 / CAC 40 / DAX ETFs)
European valuations remain far less demanding. The STOXX 600 at 17.92x yields 5.58% (1÷17.92) against a euro AAA 10-year of 3.28% (ECB YC API, 2026-08-28), a euro earnings yield gap of +2.30 pp, against -0.87 pp in the US. On real yields the euro gap is +4.34 pp versus the US +1.44 pp, using a euro real 10-year of 1.24% (AAA nominal less long-term HICP expectations, ECB SPF 2026 Q3).
That difference is genuine but it is not purely a statement about relative risk compensation. Part of it is the difference between US and euro-area inflation and policy paths, and the euro real yield is the softer of the two numbers because it is constructed from a survey rather than traded (see Real Yields below). The US still trades at a 44% multiple premium to the STOXX 600, a gap that has persisted for years and is partly explained by sector mix. Being 52% above its own history is a separate and stronger claim than being expensive relative to Europe.
The CAC 40 at 17.10x remains the cheapest large European index on this measure. At 8,334.50 it is below its 50-day average of 8,463.04 though still above its 200-day (8,229.03), and 4.8% below its 52-week high. The DAX at 19.01x has slipped just under the 20% premium threshold after today's 1.17% fall. French fiscal risk stays the specific European tail risk, with the September budget the next scheduled test; note in the bond section below that the market's euro-area anxiety has now rotated decisively from Rome to Paris.
On currency: a euro-based investor holding EUR-quoted European funds has no FX effect on the quoted value of the holding, but real exposure persists inside the earnings, since CAC 40 and STOXX 600 constituents are multinationals earning substantially abroad. The exposure is smaller, slower and partly hedged by foreign cost bases, not absent.
Japan (Nikkei / TOPIX ETFs)
The Nikkei at 22.33x is the most reasonably valued major developed index relative to its own history, 6% above midpoint, and it fell only 0.14% today. The dominant variable is policy and it is now acute. The BOJ holds at 1.00% (web search), having hiked in June to the highest level since 1995 and held on 31 July while warning that core inflation would run clearly above 2% from the second half of its fiscal year. Today the 2-year JGB reached a 31-year high and the 10-year is at 2.95%, up 2 bp. For a euro-based investor the currency call likely matters more than the equity call: the yen has broken 160 per dollar and is on intervention watch, which is a two-sided setup into the September meeting. Corporate governance reform remains a structural tailwind independent of the macro. The index is 9.0% below its 52-week high of 72,831.73 and below its 50-day average.
Emerging Markets (MSCI EM ETFs)
EEM at 17.38x is 24% above its historical range, an awkward reading for an asset class whose main attraction is meant to be its discount to developed markets. A hawkish Fed is a straightforwardly negative input here, since a firmer dollar tightens financial conditions across the complex. The China weight remains the single dominant factor, and China was the bright spot today with the Shanghai Composite up 0.86%, though it is still marginally below its 200-day average of 4,011.80. Korea deserves a separate flag: the Kospi rose 0.46% today but sits 27% below its 52-week high of 9,385.59 and 4.7% below its 50-day average, so the recent damage there is substantial.
Overall Risk Score: High valuation risk in the US, low margin of safety. Moderate and closer to fair value in Europe and Japan. Emerging markets look less attractive than their reputation suggests on this measure. The risk common to all four, and the one that moved today, is that the policy path may now be pointing up rather than down.
Disclaimer: This is financial information, not personalised investment advice. Past valuations do not guarantee future returns. Consult a financial advisor before investing.
US Economic Indicators (FRED - authoritative)
| Indicator | Current | Prior | Delta | Reference Date | FRED Series |
|---|---|---|---|---|---|
| CPI YoY % | 3.30% | 3.46% | -0.16 pp | Jul 2026 | CPIAUCSL |
| Core CPI YoY % | 2.47% | 2.57% | -0.10 pp | Jul 2026 | CPILFESL |
| Unemployment Rate | 4.1% | 4.2% | -0.1 pp | Jul 2026 | UNRATE |
| Nonfarm Payrolls | -23k | +20k | -43k | Jul 2026 (m/m) | PAYEMS |
| 10Y TIPS Real Yield | 2.44% | 2.42% | +2 bp | 31 Aug / 28 Aug | DFII10 |
Note: FRED macro data is monthly and typically lags four to six weeks. The July reference month is unchanged, so the monthly rows are the same figures Friday's briefing carried. The real yield row is daily, and both legs come from the US Treasury real curve; the 31 August curve has since published, so the row now carries today's 2 bp rise rather than Friday's 8 bp one. The tension in this table is unchanged and is precisely what makes Warsh's remarks consequential: headline CPI above 3% alongside payrolls that turned negative in July.
Other economic releases today:
| Indicator | Actual | Consensus | Prior | Surprise |
|---|---|---|---|---|
| Germany flash CPI YoY (Aug) | 2.9% | 3.0% | 2.8% | 0.1 pp cooler, accelerating |
| Germany flash HICP YoY (Aug) | 2.9% | 3.1% | 2.8% | 0.2 pp cooler |
| Germany CPI MoM (Aug) | +0.2% | — | — | — |
| Germany core CPI YoY (Aug, est.) | 2.4% | — | — | — |
| Germany energy prices YoY (Aug) | +10.5% | — | +8.3% | energy the dominant driver |
Germany's print is the one release that matters today and it cuts both ways. Undershooting consensus is a relief, but the direction is up, from 2.8% to 2.9%, and the composition is uncomfortable: core is running at 2.4% while energy contributed a 10.5% year-on-year rise against 8.3% in July. With oil up more than 2% today on Middle East tensions, that energy contribution has a reason to persist into the September print. Italy and the euro area aggregate follow tomorrow.
Fixed Income & Bond Analysis
Policy Rates
| Central Bank | Rate | Source |
|---|---|---|
| Fed Funds (upper) | 3.75% | FRED DFEDTARU |
| Fed Funds (lower) | 3.50% | FRED DFEDTARL |
| Effective FFR | 3.63% | FRED DFF (2026-08-27) |
| ECB Deposit Rate | 2.25% | FRED ECBDFR |
| BOJ Policy Rate | 1.00% | web search |
| BOE Bank Rate | ~3.73% | FRED IUDSOIA (SONIA proxy, 2026-08-26) |
Government Bond Yields
| Country | 2Y Yield | 10Y Yield | 30Y Yield | Day Chg (10Y) | Source |
|---|---|---|---|---|---|
| USA | 4.34% | 4.75% | 5.25% | +2.0 bp | US Treasury par curve (2026-08-31) |
| Euro AAA | 2.81% | 3.28% | 3.73% | — | ECB YC API (2026-08-28) |
| France | — | ~4.11% | — | — | web (2026-08-31) |
| UK | — | 5.16% | — | — | web (2026-08-28) |
| Japan | — | 2.95% | — | +2.0 bp | web (2026-08-31) |
| Italy | — | ~4.15% | — | — | web (2026-08-31) |
This table is settled data. The US row is today's and carries a single date throughout: all three maturities and the +2.0 bp day change come from the 31 August par curve measured against the 28 August curve. The euro area row is still Friday's, so the US and Euro AAA rows do not share a date. The Germany row appears as "Euro AAA" because it is the ECB's AAA-rated euro area composite rather than the Bund specifically.
Two things stand out. The UK 10-year at 5.16% is the developed-market outlier: 43 bp over the equivalent Treasury and 188 bp over the euro AAA curve, and it rose to a 14-month high on Friday before London closed for the holiday. And France has become the euro area's problem sovereign rather than Italy. The OAT at roughly 4.11% is now trading at or above the BTP at roughly 4.15%, a crossover that would have looked implausible a year ago, while the BTP-Bund spread has narrowed to about 83 bp. A direct OAT-Bund print was not retrievable today; the last one found was 83.6 bp on 21 August, which is stale and should be treated as indicative only. The 2-year gilt was again not retrievable, so that cell is blank rather than estimated.
Yield Curve Spreads (both recomputed from the 31 August par curve):
- 10Y-2Y spread: +41 bp (US Treasury par curve, 2026-08-31). Positive and therefore not inverted, but well short of the roughly 75 bp that would count as steep. This is a normal but flattish curve, and it steepened by 2 bp today, with the 10-year rising while the 2-year sat still. That partly retraces Friday's flattening, when the 2-year rose 14 bp against the 10-year's 6 bp. A front end selling off faster than the long end is the signature of a market pulling forward its expectation of tighter policy, which is what Friday delivered and what Warsh's remarks encouraged; the settled US curve did not extend it today.
- 10Y-3M spread: +84 bp (US Treasury par curve, 2026-08-31). Comfortably positive and not signalling recession on this measure. The 3-month at 3.91% sits 28 bp above the Fed Funds target midpoint of 3.625%, within tolerance but leaning in the direction of a bill market that is pricing some probability of a hike rather than a cut.
OAT-Bund Spread: not directly retrieved today. The relevant euro-area credit signal today came instead from the BTP-Bund spread at roughly 83 bp and from the OAT trading through the BTP, both consistent with the market's sovereign risk focus having rotated from Italy to France.
Yield Curve Charts
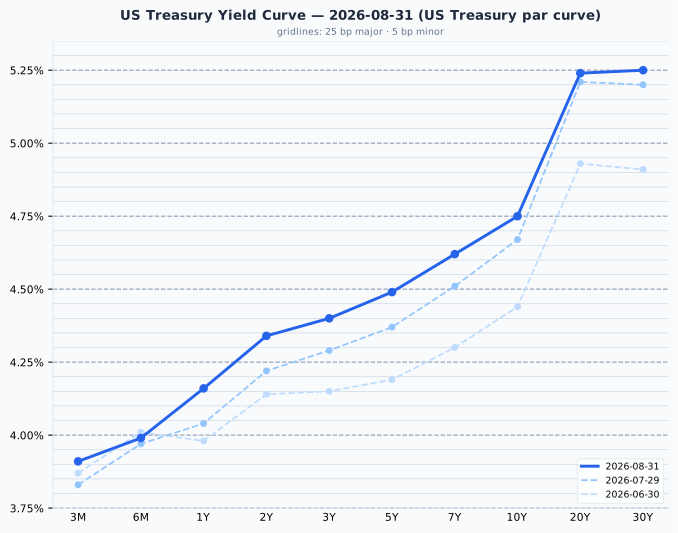
The US curve is upward sloping throughout with a pronounced steepening beyond the 10-year, where the 20-year and 30-year sit at 5.24% and 5.25% against 4.75% at ten years. Against the 29 July curve the whole structure has shifted up, and the shift is largest in the front and the belly: the 1-year, the 2-year and the 5-year are each 12 bp higher, while the 20-year is up only 3 bp and the 30-year 5 bp. The month's move has been a front-end repricing, not a term-premium story.
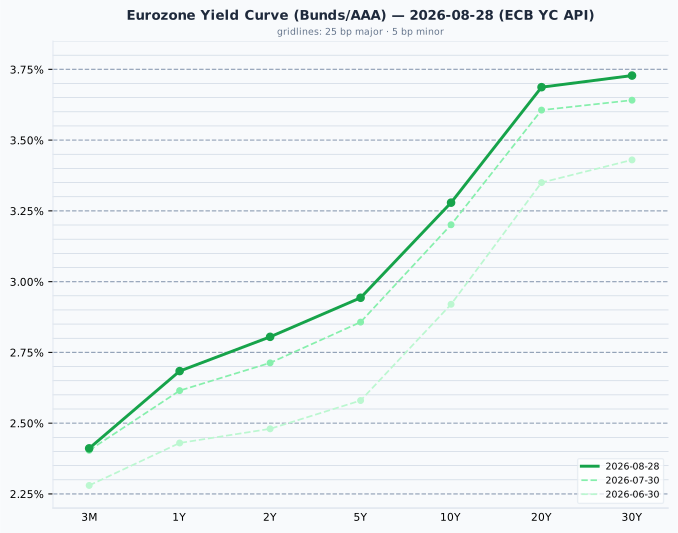
The euro AAA curve is also upward sloping and considerably flatter in absolute terms, spanning 2.41% at three months to 3.73% at thirty years. Against the 30 July curve it has shifted up by roughly 7 to 9 bp at every maturity from one year out to thirty, while the 3-month has barely moved at all, up under 1 bp. That is a more uniform move than the US curve made over the same month, where the long end was flat and the front and belly did all the work. The euro area is repricing in the same direction as the US, but the shape of its move says the market is lifting the whole expected path rather than pulling a specific hike forward, which is consistent with the ECB sitting at a 2.25% deposit rate and facing an inflation print that undershot consensus today.
Credit Markets (from FRED, authoritative)
| Market | OAS Spread | Series ID |
|---|---|---|
| US Investment Grade | 79 bp | BAMLC0A0CM |
| US High Yield | 260 bp | BAMLH0A0HYM2 |
| Euro High Yield | 255 bp | BAMLHE00EHYIOAS |
All three observations are dated 2026-08-28. Every one of these is historically tight. US high yield at 260 bp is below the 300 to 500 bp range that counts as normal, and nowhere near the 500 bp that would signal stress. US investment grade at 79 bp is just below the bottom of its 80 to 150 bp normal band. Euro high yield at 255 bp is inside its US equivalent, which is unusual and reflects both the euro area's shorter-duration high yield universe and a genuine bid for the asset class.
The reading is worth pairing with the equity move above. Credit is not corroborating today's risk-off tone at all. When spreads are this compressed the compensation for taking corporate credit risk is thin, and the asymmetry runs against the holder: there is far more room to widen than to tighten. That is a statement about the price of risk today, not a prediction that it will widen.
Real Yields (US and Euro Area)
| Region | Nominal 10Y | Expected inflation | Real 10Y | How the real yield is obtained |
|---|---|---|---|---|
| United States | 4.75% | 2.31% (residual) | 2.44% | Measured. TIPS trade, so the market quotes a real yield directly; expected inflation is the residual (the breakeven) |
| Euro area | 3.28% | 2.04% (measured, SPF) | 1.24% | Constructed. No euro inflation-linked benchmark is published, so a survey expectation is subtracted from the nominal |
US legs from the US Treasury par and real curves (2026-08-31); euro nominal from the ECB YC API (2026-08-28); euro inflation expectation from the ECB Survey of Professional Forecasters, 2026 Q3.
The two rows are built in opposite directions, and that matters for how much weight each carries. The US real yield is a market price that someone actually trades, with expected inflation inferred from it. The euro real yield is the residual left after subtracting a survey from a nominal yield, so it is the softer of the two numbers and should be treated as such. Two mismatches follow when the pair is compared: the US breakeven embeds an inflation risk premium that a survey does not, and the SPF horizon is five years against the bond's ten.
Decomposing the 147 bp nominal gap between the two regions gives 27 bp of expected-inflation difference (2.31% against 2.04%) and 120 bp of real rate difference (2.44% against 1.24%). As on recent days, this is overwhelmingly a real rate story rather than an inflation story, and the inflation component has widened slightly since earlier in the month.
On the US-euro real rate gap
State that 120 bp as a macro fact about relative policy stance and growth expectations, and stop there. It is not a trade a euro-based reader can capture. Hedging the currency cancels the advantage almost exactly, because the forward rate is set to remove the interest differential, and unhedged it is a currency bet rather than a bond decision. A real yield is real in its own currency: 2.44% means 2.44% above US inflation, which is not a real return for someone who spends euros. The gap has been positive in every quarter since 2014, and a differential of that size and persistence would have been arbitraged away long ago if it were capturable.
Bond Portfolio Implications
On settled prices the US comparison currently favours bonds on current income: the 10-year Treasury at 4.75% pays more than the S&P 500's 3.88% earnings yield, a gap of -0.87 pp. In Europe the comparison runs the other way, with the STOXX 600's 5.58% earnings yield 2.30 pp above the euro AAA 10-year at 3.28%. Both figures describe today's trade-off between two instruments at today's prices, and neither forecasts which will perform better; the gap leaves out earnings growth entirely, which is the whole reason the real-yield version above moves the US number by 2.31 pp.
Duration is where the day's move bites. A 100 bp rise in yields costs roughly 8 to 9% in price on a 10-year bond, and the US long end has been backing up steadily: the 30-year settled at 5.25%, near the top of its recent range. The front end offers a genuine alternative right now, with the 2-year at 4.34% and the 3-month at 3.91%, giving up only 41 bp against the 10-year for a fraction of the duration risk. In a market whose policy path is being repriced upward rather than down, being paid almost as much to sit at the short end is the more defensible position, and it is the trade the curve's flattening is implicitly rewarding.
Currencies & Commodities
Currencies:
| Pair | Rate | Source |
|---|---|---|
| EUR/USD | 1.1684 | FRED DEXUSEU (2026-08-21) |
| USD Index | 118.06 | FRED DTWEXBGS (2026-08-21) |
| USD/JPY | 160.07 | web search (2026-08-31) |
| GBP/USD | 1.3539 | web search (2026-08-31) |
| USD/CHF | 0.8083 | web search (2026-08-31) |
The two FRED series are both dated 21 August and are therefore a week and a half stale; web sources put EUR/USD nearer 1.159 today, so the dollar is stronger than the FRED row implies. Treat the DEXUSEU and DTWEXBGS figures as reference points rather than today's market. The live story is the yen: at 160.07 it has broken a level that puts Japanese authorities on intervention watch, and it got there on dollar strength following Warsh's remarks rather than on anything domestic.
Commodities (all from front-month futures via yfinance):
| Commodity | Price | Day Chg % | Ticker | Source |
|---|---|---|---|---|
| Brent Crude | 88.53 | +2.80% | BZ=F | yfinance |
| WTI Crude | 86.31 | +3.49% | CL=F | yfinance |
| Gold ($/oz) | 4,497.30 | -0.72% | GC=F | yfinance |
| Silver ($/oz) | 67.205 | -0.86% | SI=F | yfinance |
| Copper ($/lb) | 6.689 | +0.45% | HG=F | yfinance |
| Nat Gas ($/MMBtu) | 2.929 | +1.42% | NG=F | yfinance |
Day changes are last trade at the end of the 31 August session vs the prior session's settlement (28 August). The exchange settlements for 31 August had not published in time, so these are the session's final traded prices rather than its settlement prices, and they are not directly comparable with a settlement-to-settlement quote from a wire.
Energy leads and the metals lag, which is the clean signature of a geopolitical supply story rather than a demand story. WTI's 3.5% gain on the Hormuz escalation is the day's largest move in either direction across the whole briefing, and it extended through the afternoon rather than fading: the midday reading was 2.5%. It is the input that makes the German energy-inflation figure above a forward-looking problem rather than a backward-looking one. Both crude contracts sit well within their 52-week ranges: WTI between 54.98 and 119.48, Brent between 58.72 and 126.10. Neither is anywhere near a record, and their all-time highs date from July 2008, in a market since rebuilt by US shale, so the distance is arithmetic without much meaning. Natural gas at 2.929 is up 1.42% but remains close to the bottom of its 52-week range of 2.483 to 7.827.
The precious metals sold off on the same news that lifted crude, which is worth pausing on: a firmer dollar and a higher real yield outweighed the safe-haven bid. Both pared their losses into the end of the session, roughly a quarter of the decline in each case. Gold at $4,497.30 is 19.5% below its all-time high of $5,586.20, set on 29 January 2026, and that high is also its 52-week high. Silver at $67.205 is 44.6% below its all-time high of $121.30, also set on 29 January 2026. Both are substantial drawdowns from records set only seven months ago, and neither should be described as near its highs. Copper is the exception: at $6.689 it is 0.9% below its all-time high of $6.75 set on 26 August, so it is genuinely trading at all-time highs, and it was the only metal to rise today.
None of the six front-month contracts is near a roll. The nearest expiry is the October WTI contract (CLV26.NYM) on 22 September, three weeks out, so the quoted levels should stay continuous through the coming sessions.
Crypto: no moves above 3% today; omitted.
Sector & Theme Highlights
- Energy is the day's clear leader across every region, on Middle East supply risk rather than demand. This is also the channel through which the bond story is being sustained: energy was the single largest contributor to Germany's August inflation acceleration.
- Rate-sensitive and cyclical equities are the day's losers. The Dow's 0.70% fall against the Nasdaq 100's 0.08% gain is the tell, and in Europe the Euro STOXX 50's 1.01% decline against the broader STOXX 600's 0.62% points the same way, toward large-cap cyclicals and financials rather than technology.
- Precious metals miners dragged, visible in EZA's 0.31% fall, which is a cleaner read on the gold and silver move than the metals tickers alone, though the drag eased into the close as both metals pared their losses.
- The global front-end repricing is the cross-market theme of the day and it is unusually synchronised: Japan, Germany, the UK, Spain, Portugal, Poland and Switzerland all saw short rates rise together. Synchronised moves of this kind usually reflect a common driver, and here it is a shared reassessment of how much more inflation the energy complex is about to deliver.
- AI capital expenditure remains the structural bull case underneath US equities, and Warsh's "global investment surge" framing is a hawkish restatement of exactly that theme: strong investment demand is a reason for rates to stay high, not a reason for them to fall.
Top Stories (Global)
- Synchronised global short-end selloff. Japan's 2-year JGB hit a 31-year high and Germany's 2-year bund its highest since July 2024, with short rates also rising in the UK, Spain, Portugal, Poland and Switzerland. This is the day's defining cross-market event.
- Fed Chair Warsh talks up a "global investment surge" at the G20. Markets read the remarks as hawkish and moved toward pricing a hike at the next meeting. The dollar firmed and the US front end sold off.
- Yen breaks 160 per dollar, putting Japanese authorities on intervention watch ahead of the BOJ's September meeting. The BOJ currently holds at 1.00%, the highest since 1995.
- Oil jumps on renewed Strait of Hormuz fighting. US forces struck Iranian missile launchers and the 60-day deadline for a negotiated settlement lapsed with no talks scheduled, leaving WTI up 3.49% at $86.31 and Brent up 2.80% at $88.53 (web, 2026-08-31). Energy supply risk is now feeding directly into the inflation outlook that is keeping central banks defensive.
- August closes higher despite the day's fall. The S&P 500 ended the month up 2.6%, its first monthly gain since May (web, 2026-08-31), so today's decline came against a month that was firmly positive rather than as the continuation of a drawdown.
- German flash CPI comes in at 2.9% year on year, below the 3.0% consensus but up from July's 2.8%. Energy prices rose 10.5% year on year against 8.3% in July, making energy the dominant driver. Core is estimated at 2.4%.
- France displaces Italy as the euro area's sovereign risk focus. The 10-year OAT at roughly 4.11% is trading at or above the BTP at roughly 4.15%, while the BTP-Bund spread has narrowed to around 83 bp.
- UK markets closed for the Summer Bank Holiday, leaving the FTSE 100 at Friday's 10,824.26 and the 10-year gilt at 5.16%, a 14-month high reached before the long weekend.
Looking Ahead
Economic releases (next 1-5 trading days):
- Tuesday 1 September: Euro area and Italy flash CPI for August, the sequel to today's German print and the more important number for the ECB. Manufacturing PMIs for France, Germany, the UK and the euro area. In the US, the ISM Manufacturing PMI.
- Midweek: JOLTS job openings, the ADP employment report and durable goods orders in the US.
- Thursday 3 September: US initial jobless claims and the ISM Services PMI.
- Friday 4 September: The US employment situation report. This is the week's main event, and it matters more than usual: July payrolls were negative at -23k while headline CPI runs above 3%, so this print goes straight to the question Warsh's remarks raised today about which side of the mandate the Fed is now weighting.
Central banks:
- No scheduled Fed, ECB or BOJ decisions this week. The BOJ's meeting on 17-18 September is the next major event, and today's 31-year high in the 2-year JGB together with the yen through 160 raises the stakes on it considerably.
- Watch for further Fed commentary following today's G20 remarks. With the September meeting approaching, the messaging is doing the work that the data alone has not settled.
Market closures:
- Monday 7 September: United States (Labour Day), Canada (Labour Day) and Brazil (Independence Day). Three of the four Americas markets in this briefing will be closed, which will make that session's Americas table a holiday-format one.
- No closures scheduled in Germany, France, the UK, Japan, Australia, Switzerland or South Korea through 15 September.
- India's holiday list is absent from the cache for 2026, so Indian closures cannot be confirmed from it. That gap is stated rather than filled from memory.