2026 08 26
Global Financial Briefing — Wednesday, 26 August 2026
Americas index levels, the US-listed EM ETF rows, commodities and all day changes reflect the 26 August closing print; the USA bond row, the curve spreads, the real-yield figures and the US yield curve chart use Treasury's settled 26 August par curve. Currencies, credit spreads, the VIX, policy rates, the euro area rows and the ECB curve chart are dated inline.
Market Overview
The whole session was a waiting room for one earnings report. Nvidia published fiscal Q2 2027 results after the US close, and the market spent the day refusing to take a position ahead of it. Tuesday's chip-led rally (S&P 500 +0.3% to 7,677.28, Nasdaq Composite +0.7%, Nvidia itself +2.2%) drained away over the morning, but the afternoon took most of it back: the S&P 500 finished essentially flat at 7,675.70, down 0.02%, and the Nasdaq 100 closed 0.05% higher after being off 0.22% at midday. Only the Dow held a real loss, at 0.21%. The closing tape reads as position-trimming that ran out of conviction before the bell rather than as a directional view; the one detail worth noting is that the Nasdaq 100 is the only major US index that finished below its 50-day average, which is a fair summary of where the anxiety was concentrated.
Outside the US the tone is better. Asia closed broadly higher, led by the Kospi (+0.97%), with the Nikkei (+0.62%), Shanghai (+0.59%) and Hang Seng (+0.56%) all firm; Australia (−0.40%) and India (−0.52%) were the exceptions. Europe finished flat to slightly up, the STOXX 600 unchanged at 656.41 with the CAC 40 (+0.27%) and the Euro STOXX 50 (+0.23%) doing the work and the FTSE 100 (−0.07%) marginally negative. The divergence is not a story about relative fundamentals so much as one about index composition: the regions with the least semiconductor weight had the least reason to sit on their hands today.
The bond story is a partial give-back. Tuesday delivered a second consecutive rally as oil fell more than 3%, taking the 10-year down 6.0 bp to 4.64% and the 2-year down 7 bp to 4.17%. The settled par curve for 26 August gives a little of that back: the 10-year at 4.66% and the 2-year at 4.19% are both 2.0 bp higher, the 3-year is up 4 bp, the 30-year up 1 bp and the 3-month bill 1 bp lower. What is notable is that the give-back did not come from crude. Oil traded higher through the session but settled marginally below Tuesday, so the small rise in yields arrived without the inflation input that had been driving the move in both directions earlier in the week. The euro AAA curve, whose freshest settled reading is 25 August, eased 3.6 bp to 3.24% on that day, in line with Tuesday's US rally. Volatility was unbothered: the VIX settled at 15.45 on 25 August, down from 15.85, which is the low end of the moderate band and not the pricing of a market that expected the evening to go badly.
Global Indices Snapshot
Americas
| Index | Level | Day Chg | Day Chg % | Source |
|---|---|---|---|---|
| S&P 500 | 7,675.70 | −1.58 | −0.02% | yfinance ^GSPC |
| Nasdaq 100 | 29,224.52 | +15.29 | +0.05% | yfinance ^NDX |
| Dow Jones | 53,463.88 | −113.52 | −0.21% | yfinance ^DJI |
| Brazil IBOV | 174,586.27 | +9.47 | +0.01% | yfinance ^BVSP |
Americas data reflects the 26 Aug close. FRED's own SP500 observation for 26 August is 7,675.70, matching the S&P 500 close above to the cent.
Europe
| Index | Level | Day Chg | Day Chg % | Source |
|---|---|---|---|---|
| Euro STOXX 600 | 656.41 | −0.07 | −0.01% | yfinance ^STOXX |
| Euro STOXX 50 | 6,470.74 | +15.11 | +0.23% | yfinance ^STOXX50E |
| CAC 40 | 8,462.39 | +23.19 | +0.27% | yfinance ^FCHI |
| DAX | 26,285.96 | +19.82 | +0.08% | yfinance ^GDAXI |
| FTSE 100 | 10,878.12 | −8.04 | −0.07% | yfinance ^FTSE |
| SMI (Swiss) | 14,542.90 | +17.61 | +0.12% | yfinance ^SSMI |
European data reflects today's close (26 Aug).
Asia-Pacific
| Index | Level | Day Chg | Day Chg % | Source |
|---|---|---|---|---|
| Nikkei 225 | 66,262.16 | +405.73 | +0.62% | yfinance ^N225 |
| Hang Seng | 25,652.97 | +141.87 | +0.56% | yfinance ^HSI |
| Shanghai Comp | 3,912.52 | +23.08 | +0.59% | yfinance 000001.SS |
| ASX 200 | 9,127.80 | −36.80 | −0.40% | yfinance ^AXJO |
| Kospi (Korea) | 6,808.21 | +65.47 | +0.97% | yfinance ^KS11 |
Asia-Pacific data reflects today's close (26 Aug).
Emerging Markets
| Index | Level | Day Chg % | Source |
|---|---|---|---|
| MSCI EM (EEM) | 67.17 | −0.12% | yfinance EEM |
| India Nifty 50 | 24,207.75 | −0.52% | yfinance ^NSEI |
| South Africa | 71.68 | −1.14% | yfinance EZA |
EEM and EZA are USD-denominated US-listed ETFs and reflect the 26 Aug NYSE close. The Nifty 50 figure is the 26 Aug Indian close (15:30 IST).
Positioning within the 52-week range. No index in the tables closed at the top of its range, though several are close: the SMI is 0.9% below its 52-week high, the FTSE 100 and the STOXX 600 about 1.0% below, the DAX 1.1% below and the S&P 500 1.8% below. The dispersion sits at the other end of the table. The Kospi is 27.5% below its 52-week high despite the day's gain, the Nikkei 9.0% below, Hang Seng 8.6% and Shanghai 8.1%. Five indices closed under their 50-day averages (Nasdaq 100, CAC 40, Nikkei 225, Shanghai and Kospi) and three under their 200-day (Hang Seng, Shanghai and the Nifty 50), so the strength in the European and US headline numbers is not evenly shared.
Index Valuations & Investment Risk
Valuation Table
| Index | Trailing P/E (live) | Hist avg trailing P/E (†) | Premium to hist mid |
|---|---|---|---|
| S&P 500 | 25.77x | ~16-18x | +51.6% |
| Nasdaq 100 | 30.33x | ~25-30x | +10.3% |
| Euro STOXX 600 | 18.10x | ~15-17x | +13.1% |
| CAC 40 | 17.35x | ~14-16x | +15.7% |
| DAX | 19.03x | ~15-17x | +18.9% |
| FTSE 100 | 18.29x | ~13-15x | +30.6% |
| Nikkei 225 | 22.31x | ~20-22x | +6.2% |
| MSCI EM | 17.44x | ~13-15x | +24.6% |
(†) Static long-run reference constants, the one figure here not fetched live. Live trailing P/E is
the yfinance trailingPE field on the ETF proxies SPY, QQQ, EXSA.DE, CAC.PA, EXS1.DE, ISF.L,
1321.T and EEM. All eight returned a value, and each is within 0.3% of its 26 August close-based
level.
Three indices carry a premium above the 20% flag: the S&P 500 at +51.6%, the FTSE 100 at +30.6% and MSCI EM at +24.6%. The S&P figure is the one that has been stretching for months and is the least surprising; the FTSE reading deserves a caveat, because a 18.3x trailing multiple on an index whose long-run average is 13-15x reflects a changed sector mix (less oil and mining weight, more of everything else) as much as a re-rating of the same businesses. The Nasdaq 100, counter-intuitively, carries the smallest premium in the table at +10.3%, because its historical benchmark is already high. That is a reminder that "premium to own history" and "expensive" are not the same statement.
Investment Risk Assessment for ETF Investors
United States (S&P 500 / Nasdaq ETFs). The S&P 500 earns 3.88% (1÷25.77) against a 10-year Treasury at 4.66%, an earnings yield gap of −0.78 pp: on the 26 August closing prices the bond pays more current yield than the index. Corrected for inflation, using the TIPS real yield of 2.34% rather than the nominal, the gap is +1.54 pp, and the size of that correction (2.34 pp, enough to flip the sign) is the interesting part of the calculation rather than either endpoint. See the Bond Portfolio Implications section for what this measure can and cannot support. The index is 1.8% below its 52-week high and above both its 50-day (7,554) and 200-day (7,109) averages, so the price trend is intact; the risks are concentration in a handful of semiconductor and platform names, the Nvidia print as a single-event catalyst for the whole complex, and a real yield of 2.34% that keeps the discount rate on long-duration earnings high. The Nasdaq 100 at 30.33x, 5.0% below its 52-week high and below its 50-day average, is where those risks are most concentrated.
Europe (STOXX 600 / CAC 40 / DAX ETFs). The STOXX 600 earns 5.53% (1÷18.10) against a euro AAA 10-year of 3.24%, a nominal gap of +2.28 pp. On real yields, using the constructed euro real 10-year of 1.21%, the gap is +4.32 pp. Both are far wider than the US, but part of that difference is simply the gap between US and euro-area inflation and policy paths rather than a difference in risk compensation, and the decomposition below shows how much: of the 142 bp between the two nominal 10-year yields, only 28 bp is expected inflation and 113 bp is real. So the euro advantage in the gap is mostly a real-rate story, not an inflation illusion, but the euro real yield is the softer of the two numbers because it is constructed from a survey rather than traded. European multiples are 13-19% above their long-run averages, which is elevated but nothing like the US stretch. Risks: French fiscal politics (the OAT-Bund spread at 83.6 bp on the 21 August reference), export exposure to a slowing China, and the fact that the DAX sits about 1% below its 52-week high after a strong run, with the CAC about 3% below.
On currency, a euro-based investor holding EUR-quoted European funds has no FX effect on the quoted value of the holding, but real FX exposure remains inside the earnings: CAC 40 and STOXX 600 constituents are multinationals with large foreign revenue bases. The exposure is smaller, slower and partly hedged by foreign cost bases, not absent.
Japan (Nikkei / TOPIX ETFs). At 22.31x the Nikkei carries the smallest premium in the table after the Nasdaq 100, and the index is 9.0% below its 52-week high and below its 50-day average despite today's 0.62% gain. The dominant variable is the BOJ. The policy rate is 1.00% after the June hike, the July meeting held 8-1 with one member proposing 1.25%, and the July summary of opinions flagged upside price risks and a hike pace potentially faster than the market expects, all of which keeps September live. With USD/JPY around 159, a rate rise is as much a currency event as a rate event for a foreign holder, and the hedge decision is likely to matter more than the equity call. Corporate governance reform remains the structural support underneath the multiple.
Emerging Markets (MSCI EM ETFs). EEM's 17.44x is a +24.6% premium to its 13-15x long-run average, which is unusual: the EM discount to developed markets that the asset class is normally bought for is much narrower than its history. EEM is 6.1% below its 52-week high and above both moving averages. China weight is the swing factor and the Chinese market is the weak spot in the table: Shanghai is below both its 50-day and 200-day averages and 8.1% off its 52-week high, Hang Seng below its 200-day. South Africa (EZA) is the day's worst performer at −1.14% and sits 12.3% below its high.
Overall Risk Score (qualitative, not financial advice): High valuation risk in the US, low margin of safety, with a negative nominal earnings yield gap and a 51.6% premium to historical multiples. Moderate in Europe and Japan, where premiums are in the 6-19% range and the earnings yield gap is comfortably positive. Moderate in EM, where the usual valuation discount has largely closed while the political and currency risks have not.
Disclaimer: This is financial information, not personalised investment advice. Past valuations do not guarantee future returns. Consult a financial advisor before investing.
US Economic Indicators (FRED, authoritative)
| Indicator | Current | Prior | Delta | Reference Date | FRED Series |
|---|---|---|---|---|---|
| CPI YoY % | 3.30% | — | — | Jul 2026 | CPIAUCSL |
| Core CPI YoY % | 2.47% | — | — | Jul 2026 | CPILFESL |
| Unemployment Rate | 4.1% | — | — | Jul 2026 | UNRATE |
| Nonfarm Payrolls | 158,858k | 158,881k | −23k | Jul 2026 | PAYEMS |
| 10Y TIPS Real Yield | 2.34% | — | — | 2026-08-26 | DFII10 (US Treasury real curve) |
FRED macro data is monthly and lags four to six weeks, so July is still the latest reference month and nothing in this table has moved since yesterday. The awkward combination stands: headline CPI at 3.30% against core at 2.47%, with an outright 23k contraction in payrolls. Energy is most of the wedge between the headline and the core figure, which is why the oil move has been driving the bond market both ways this week.
Other economic releases on 26 August. US durable goods orders for July rose 1.1% on the month to $339.3bn, comfortably ahead of a consensus near 0.5%, with transportation equipment up 2.3% doing most of the work. Excluding transportation the gain was a softer 0.4%, below the 0.6% expected, so the headline is stronger than the underlying trend. The week's substantive US data is still ahead: the Q2 GDP revision and the July core PCE price index, the Fed's preferred inflation measure. No major euro-area release landed on the day, after Tuesday's Ifo business climate beat (88.8 against 87.2 consensus).
Fixed Income & Bond Analysis
Policy Rates
| Central Bank | Rate | Source |
|---|---|---|
| Fed Funds (upper) | 3.75% | FRED DFEDTARU (2026-08-26) |
| Fed Funds (lower) | 3.50% | FRED DFEDTARL (2026-08-26) |
| Effective FFR | 3.63% | FRED DFF (2026-08-24) |
| ECB Deposit Rate | 2.25% | FRED ECBDFR (2026-08-26) |
| BOJ Policy Rate | 1.00% | web search (held 31 Jul 2026, 8-1) |
| BOE Bank Rate | ~3.73% | FRED IUDSOIA (SONIA proxy, 2026-08-24) |
Government Bond Yields
| Country | 2Y Yield | 10Y Yield | 30Y Yield | Day Chg (10Y) | Source |
|---|---|---|---|---|---|
| USA | 4.19% | 4.66% | 5.18% | +2.0 bp | US Treasury par curve (2026-08-26) |
| Euro AAA | 2.75% | 3.24% | 3.70% | −3.6 bp | ECB YC API (2026-08-25) |
| Germany | (not retrieved) | (not retrieved) | (not retrieved) | — | — |
| France | (not retrieved) | 4.08% | (not retrieved) | — | web (2026-08-21 ref) |
| UK | (not retrieved) | 4.99% | (not retrieved) | — | web (2026-08-26) |
| Japan | (not retrieved) | 2.89% | (not retrieved) | — | web (2026-08-26) |
| Italy | (not retrieved) | 4.04% | (not retrieved) | — | web (2026-08-18 ref) |
The USA row is settled par-curve data for 26 August throughout, with the day change measured against the 25 August curve. Treasury publishes each session's curve in the late afternoon ET, so the 26 August curve is the settled record of the session this briefing covers. The Euro AAA row is the ECB's AAA-rated euro area composite for 25 August, with the day change against the 24 August curve from the same source; the ECB publishes a day later than Treasury, which is why the two rows carry different dates.
No Bund-specific quote was retrievable today, so the Germany row is blank rather than filled from the composite. Two independent checks put the Bund close to the AAA 10-year of 3.24% anyway: the composite is dominated by Germany, and the 21 August OAT-Bund spread of 83.6 bp against the same day's OAT at 4.08% implies a Bund of roughly 3.24%. The UK remains the outlier of the group: a 10-year gilt at 4.99% is 35 bp over the equivalent Treasury and more than 175 bp over the euro AAA curve. The Italy-France 10-year gap has essentially closed, with the BTP at 4.04% (18 August reference) below the OAT at 4.08% (21 August reference); the two dates differ, so treat the sign of that gap as indicative rather than settled.
Yield Curve Spreads (US Treasury par curve, 2026-08-26):
- 10Y-2Y spread: +47 bp. Positively sloped and normal, neither inverted nor steep by historical standards. It has widened over the past month as the front end priced more easing than the long end.
- 10Y-3M spread: +81 bp. Comfortably positive, so the classic recession signal is not firing. Two years ago this measure was deeply inverted; its return to positive territory reflects the Fed having cut the front end rather than any collapse in long yields.
OAT-Bund spread: 83.6 bp on the 21 August reference. This is the standing French fiscal risk indicator and it has not been quotable fresher today. Below roughly 60 bp the market is relaxed about French budget politics; above 80 bp it is charging a visible premium, which is where it sits.
Yield Curve Charts
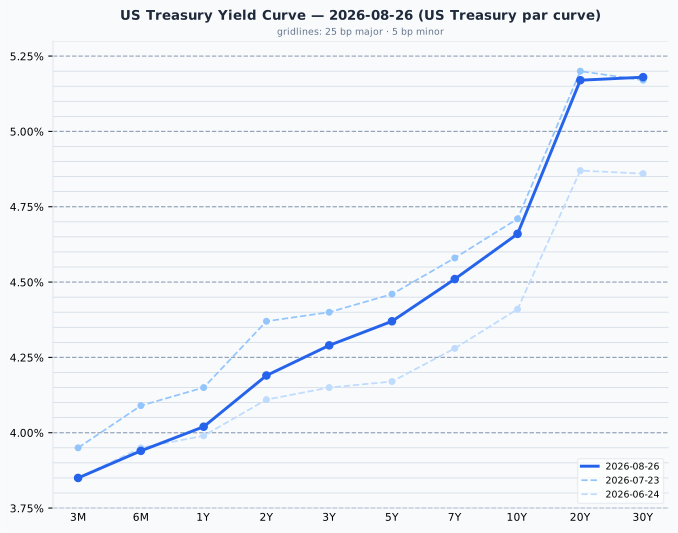
The US curve is normally shaped and rises throughout to 20 years before flattening: it runs from 3.85% at 3 months to 4.66% at 10 years and 5.17% at 20 years, with the 30-year adding only a further basis point to 5.18%. The belly is the shallow stretch, gaining just 8 bp between 3 and 5 years. Against the 23 July curve a month ago the move is a bull steepening at the short end, with the 2-year down 18 bp to 4.19% and the 3-month down 10 bp, while the 30-year is a basis point higher at 5.18%: the market has added front-end easing without changing its view of the terminal long rate.
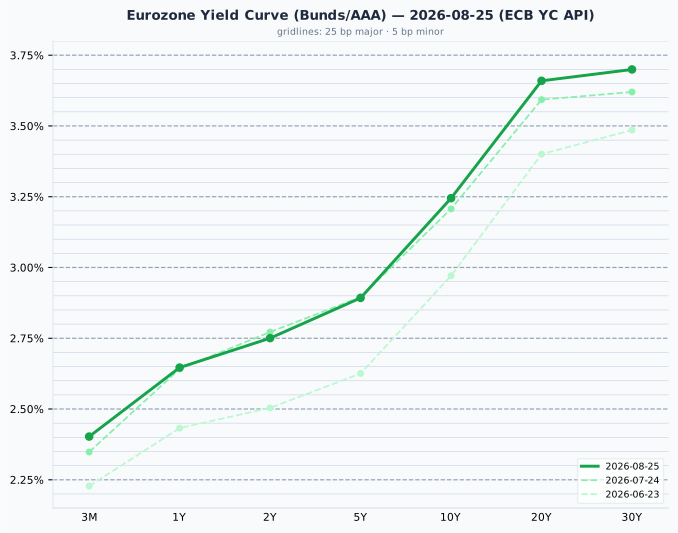
The euro AAA curve is upward sloping throughout, from 2.40% at 3 months to 3.24% at 10 years and 3.70% at 30 years, and it flattens noticeably beyond 20 years. Since 24 July the whole curve has shifted up, the 10-year by 4 bp and the 30-year by 8 bp, and against 23 June the move is much larger: 10-year +27 bp and 30-year +21 bp. Where the US curve has been steepening from the front, the euro curve has been rising bodily, which is the more conventional signature of receding rate-cut expectations.
Credit Markets (FRED, authoritative)
| Market | OAS Spread | Series ID |
|---|---|---|
| US Investment Grade | 81 bp | BAMLC0A0CM |
| US High Yield | 270 bp | BAMLH0A0HYM2 |
| Euro High Yield | 257 bp | BAMLHE00EHYIOAS |
All three as of 25 August. US high yield at 270 bp is below the 300-500 bp normal range, so historically tight; investment grade at 81 bp is at the very tight edge of its 80-150 bp band. Euro high yield at 257 bp is tighter still than its US counterpart. Credit is not corroborating any of the equity-market caution visible in today's tape, which is the usual pattern: spreads this narrow say the market sees no default cycle coming, and they also leave very little cushion if that view changes. Both US series widened by 1 bp from the previous session, which is noise.
Real Yields (US and Euro Area)
| Region | Nominal 10Y | Expected inflation | Real 10Y | How the real yield is obtained |
|---|---|---|---|---|
| United States | 4.66% | 2.32% (residual) | 2.34% | Measured. TIPS trade, so the market quotes a real yield directly; expected inflation is the residual, the breakeven |
| Euro area | 3.24% | 2.04% (measured) | 1.21% | Constructed. No euro inflation-linked benchmark is published, so a survey expectation is subtracted from the nominal yield |
US figures: US Treasury par curve and real curve, 2026-08-26. Euro figures: ECB YC API 2026-08-25 and ECB SPF long-term HICP expectation, 2026 Q3.
The two rows are built in opposite directions. The US real yield is a market price and the inflation number is inferred from it; the euro inflation number is a survey and the real yield is inferred from that. Only the US figure is something anyone actually trades, so treat the euro one as the softer of the two. Two mismatches follow from the construction: the US breakeven carries an inflation risk premium that a survey does not, and the SPF horizon is five years against the bond's ten.
Decomposing the 142 bp nominal gap between the two 10-year yields gives 28 bp of expected-inflation difference (2.32% against 2.04%) and 113 bp of real-rate difference (2.34% against 1.21%). It is overwhelmingly a real-rate story, not an inflation one, and this split moves with the cycle rather than staying fixed.
The US-euro real rate gap is not an investment opportunity
The US real yield has exceeded the euro one in every quarter since 2014, and the 113 bp reading today is if anything below the long-run mean of about 152 bp. It is a structural feature of higher US trend growth, euro-area excess savings, Bund scarcity and US fiscal supply, not a trade a euro-based reader can capture. Hedged back into euros, the differential cancels almost exactly, because the forward rate is set to remove it. Unhedged, buying Treasuries for the real yield is a currency bet dressed as a bond decision. A real yield is real in its own currency: 2.34% means 2.34% above US inflation, which is not a real return for someone who spends euros.
Bond Portfolio Implications
On the 26 August closing numbers a 10-year Treasury at 4.66% pays more current yield than the S&P 500's 3.88% earnings yield, a gap of −0.78 pp. In Europe the comparison runs the other way, with the STOXX 600 at 5.53% against a euro AAA 10-year of 3.24%, a gap of +2.28 pp.
What this measure is and is not. This is the earnings yield gap, not the equity risk premium. The ERP is expected total return minus the risk-free rate and needs a growth estimate; the gap deliberately omits growth. Its virtue is that it uses nothing but quoted prices, so it tells an investor honestly what is available today: lock in this bond coupon, or accept equity risk at this earnings yield. Its limits are equally real. It does not forecast whether equities will beat bonds, and no forward-return conclusion should be drawn from the negative US reading.
Two structural biases to keep in view. First, the gap ignores growth: the bond coupon is fixed for a decade while the earnings behind the equity yield grow roughly with inflation, so the nominal gap understates equities by approximately expected inflation. The real-yield version corrects this, and for the US the correction is 2.34 pp, large enough to turn −0.78 pp into +1.54 pp. Second, an equity holder does not receive the full earnings yield in cash; only the dividend and buyback portion arrives, and the rest is retained.
The cross-country comparison needs the same care. The euro gap looks 3.06 pp better than the US one on nominal yields and 2.78 pp better on real yields, and the decomposition above shows the difference survives the inflation correction largely intact. That is a genuine observation about relative pricing, but it is one about two different currencies' real rates rather than a portfolio instruction.
Duration. A 100 bp rise in yields costs roughly 8-9% on a 10-year bond and materially more at the 30-year point, where the US curve is at 5.18%. With the 10Y-2Y spread at only 47 bp, an investor is being paid 47 bp to take eight extra years of duration risk, which is thin compensation. The front end is where the yield is cheapest to own: 4.19% at two years is 90% of the 10-year yield for a fraction of the interest-rate exposure.
Currencies & Commodities
Currencies:
| Pair | Rate | Source |
|---|---|---|
| EUR/USD | 1.1684 | FRED DEXUSEU (2026-08-21) |
| USD Index | 118.06 | FRED DTWEXBGS (2026-08-21) |
| USD/JPY | ~159.34 | web search (26 Aug) |
| GBP/USD | ~1.37 | web search (26 Aug) |
| USD/CHF | ~0.8117 | web search (26 Aug) |
The two FRED series are three business days stale, which is normal for the weekly-published broad dollar index but means EUR/USD here is a 21 August reference rather than today's rate. The GBP/USD figure is derived from a quoted USD/GBP of 0.73 and should be treated as approximate. USD/JPY near 159 is the number to watch into the BOJ's September meeting: it is the level that has been doing most of the work in the BOJ's own commentary about imported price pressure.
Commodities (all front-month futures):
| Commodity | Price | Day Chg % | Ticker | Source |
|---|---|---|---|---|
| Brent Crude | 86.94 | −0.38% | BZ=F | yfinance |
| WTI Crude | 82.23 | −0.16% | CL=F | yfinance |
| Gold ($/oz) | 4,653.3 | −0.88% | GC=F | yfinance |
| Silver ($/oz) | 68.026 | −0.96% | SI=F | yfinance |
| Copper ($/lb) | 6.7015 | −1.67% | HG=F | yfinance |
| Nat Gas ($/MMBtu) | 2.874 | +1.88% | NG=F | yfinance |
Day changes are settlement (26 Aug) against the prior session's settlement (25 Aug), which is the market convention for a completed session. Settlements are struck between 13:00 and 14:30 ET, so they differ from the last trade of the session, which runs on until 17:00 ET.
Crude gave back its intraday bounce. WTI traded higher for most of the session after Tuesday's fall of more than 3%, but settled at 82.23, down 0.16% on the day, and Brent settled at 86.94, down 0.38%. That changes how the week reads: the oil-down, bonds-up chain that drove Monday and Tuesday did not reverse on Wednesday, it simply stopped. WTI sits in the upper-middle of its 52-week range of 54.98 to 119.48, and Brent similarly against 58.72 to 126.10. Neither carries a meaningful all-time-high comparison: those records date from July 2008, in a physically and structurally different market.
Precious metals gave ground. Gold settled at 4,653.3, 16.7% below its all-time high of 5,586.20, set on 29 January 2026, and silver settled at 68.026, 43.9% below its all-time high of 121.30 from the same date. Both records are recent enough to be meaningful reference points, and both metals have spent the seven months since in a substantial drawdown rather than consolidating near the top.
Copper needs a note on mechanics. The generic HG=F quote rolled from the September contract to December between Tuesday's figures and Wednesday's, so the 6.7015 settlement is not comparable at the level of the price with Tuesday's 6.7075 print: the two are different contracts, and December trades above September in the current term structure. The day change of −1.67% is like-for-like, December's settlement against December's own prior settlement. No distance-from-record figure is quoted off the generic series here, because a spliced front-month series is not a sound basis for one across a roll: its own daily candle for 26 August closes at 6.5945 against December's actual 6.7015 settlement, a 1.6% gap that is the contract switch rather than a price move. Measured on the December contract's own history, where the highest print is 6.96 from 6 August, Wednesday's settlement is 3.7% below the record.
Natural gas was the day's biggest mover at +1.88%, but from a low base: 2.874 is 15.7% above its 52-week low of 2.483 and far under the 7.827 high of the past year. Its 2005 record is too old to be a useful comparison. One contract in the table does face a near expiry: the November Brent contract behind BZ=F stops trading on 31 August, so that generic rolls to December within days, and the level will step with it. The October WTI contract runs to 22 September.
Crypto: no notable moves today.
Sector & Theme Highlights
- Semiconductors were the entire theme. Tuesday's US gains were led by information technology (+0.9% on the sector SPDR) and communication services (+0.8%), with Nvidia up 2.2% into its print. Wednesday trimmed those gains at midday and then restored most of them into the close, leaving the Nasdaq 100 fractionally higher and the S&P 500 flat; the Nasdaq 100 alone finishing below its 50-day average is the visible expression of where the caution sat. Nvidia's report cleared the bar and guided above consensus, which sets the tone for the AI complex globally, including the Korean and Taiwanese supply chain that helped the Kospi to +0.97% on the day.
- Energy as the macro transmission channel. The week's pattern has been oil down leading bonds up leading equities up. On Wednesday the chain went quiet: crude settled marginally lower and yields still rose 2 bp, the sort of small disagreement that shows up when the market is waiting on something else. With headline CPI at 3.30% against core at 2.47%, energy is most of the wedge, and the bond market is treating crude as a live inflation input rather than a sector story.
- Precious metals out of favour. Gold and silver both settled lower and both sit well below their January records, an unusual combination with real yields at 2.34%: high real rates raise the opportunity cost of holding a non-yielding asset, and that is showing.
- China still the soft spot. Shanghai gained 0.59% on the day but remains below both its 50-day and 200-day averages, and the Hang Seng is below its 200-day. This is the main drag inside the EM complex and a live risk for European exporters.
- UK divergence. A 10-year gilt at 4.99% against a euro AAA 10-year of 3.24% is a substantial funding-cost gap for a developed economy, and it coexists with an FTSE 100 trading at a 30.6% premium to its long-run multiple.
Top Stories (Global)
- Nvidia beat on fiscal Q2 2027 and guided well above consensus. Revenue was $96.2bn, up 106% year on year and 18% on the quarter, against expectations near $92bn; non-GAAP EPS was $2.22 against roughly $2.09 expected, on a gross margin of 75.0%. The guidance was the larger surprise, at about $108bn for Q3 against a $104bn consensus, with management pointing to supply as the binding constraint into fiscal 2028. The shares rose around 4% in after-hours trading. The report landed after the closing prints in this briefing, so none of the index levels above include the reaction. It was the dominant single event of the day and the reason US indices spent the session drifting rather than trending.
- US equities closed higher on Tuesday 25 August: Dow +0.3% to 53,577.40, S&P 500 +0.3% to 7,677.28, Nasdaq Composite +0.7%, led by a chip rally ahead of the Nvidia report. Wednesday itself finished close to unchanged, the S&P 500 off 0.02% and the Dow off 0.21%.
- Treasury yields fell for a second consecutive session Tuesday, the 10-year down more than 7 bp as oil eased; the settled par curve puts the fall at 6.0 bp, to 4.64%. Wednesday gave 2.0 bp of that back, the settled 10-year closing at 4.66%.
- WTI fell over 3% on Tuesday and failed to hold a Wednesday rebound, settling 0.16% lower at 82.23. Crude was the proximate driver of the bond rally earlier in the week, but not of Wednesday's small back-up in yields.
- US durable goods orders rose 1.1% in July, reported Wednesday morning and well above a consensus near 0.5%, though the ex-transportation gain of 0.4% undershot the 0.6% expected.
- The BOJ's September meeting remains live. The bank held at 1.00% on 31 July by 8-1, with one member proposing 1.25%, and its July summary of opinions flagged upside inflation risks and a possibly faster hike pace than markets expect. USD/JPY near 159 keeps the pressure on.
- French fiscal risk is still priced at 83.6 bp over Germany on the 21 August reference, while the Italy-France 10-year gap has narrowed to roughly zero, an unusual convergence between the two large non-core euro issuers.
- German data was firm this week, with the Ifo business climate index at 88.8 against 87.2 consensus, a one-year high and a fourth consecutive increase, and Q2 GDP at +0.3% quarter on quarter on the final reading.
Looking Ahead
Next 1-5 trading days:
- This week: US Q2 GDP revision and the July core PCE price index. Core PCE is the Fed's preferred inflation gauge and the most consequential US data point before the next FOMC decision, with the target range currently 3.50-3.75%.
- BOJ September meeting. Not in this window, but positioning for it is already visible in JGBs (10-year at 2.89%) and in the yen. Any BOJ commentary between now and then will be read closely.
- Euro-area flash HICP is due at the start of next week and will be the next real test of the ECB's hold at a 2.25% deposit rate.
Market closures (Nager.Date holiday calendar, 2026):
- Monday 31 August: United Kingdom, Summer Bank Holiday. The LSE is closed; expect thin European volumes and no FTSE 100 print that day.
- Monday 7 September: United States and Canada (Labour Day) and Brazil (Independence Day). Outside the five-day window but the next major closure after the UK.
- No closures are scheduled for Germany, France, Japan, Australia, Switzerland or Korea in the next five trading days. That calendar's India entry is empty for 2026, so Indian closures are not covered by this list.