2026 09 28
Global Financial Briefing — Monday, 28 September 2026
Americas index levels, US-listed ETFs, US sector funds, commodities and day changes reflect the 28 Sep close (commodities the 28 Sep settlements), and the US Treasury curve is the 28 Sep close. The euro AAA curve, FX and macro figures are dated inline.
Market Overview
Bond yields rose around the world today and pulled gold and US equities down with them. The 10-year Treasury closed at 5.24% and the 30-year at 5.56%, both up 7 bp on the day (US Treasury par curve, 28 Sep); the press reports these as the highest closes since 2007 and 2004 respectively, and at midday the 10-year touched 5.26% (Motley Fool, Yahoo Finance). The day's main news came from the Middle East: over the weekend President Trump rejected Iran's offer to reopen the Strait of Hormuz within seven days in exchange for lifting the US naval blockade of Iranian ports, waiving sanctions on Iranian oil and a ceasefire that would include Lebanon, and he told aides he expects US strikes to resume after November's midterm elections (NBC, Al Jazeera, The Hill). Yet the rise in yields was not about inflation: the 10-year real yield rose as much as the nominal (7 bp), leaving expected inflation unchanged, and the 2-year rose most (+11 bp) as markets priced another Fed rise after the 16 September hike to 3.75–4.00%.
Oil itself did less than the headlines suggest. November WTI (CLX26) jumped as high as $96.54 in Asian trading but settled at $92.60, up only 0.21% on Friday's settlement, after reports that Saudi Arabia has restarted its East-West pipeline, which carries crude to the Red Sea and avoids Hormuz, following repairs (Fortune, Trading Economics). The December Brent contract (BZZ26) settled up 0.40% at $97.83. Precious metals took the rate rise hardest: December gold (GCZ26) settled down 3.54% at $4,168.40, because a bond paying over 5% makes an asset that pays nothing more expensive to hold, and silver fell 4.76%. The three main US indices closed lower: the S&P 500 fell 0.77% to 7,683.69, the Nasdaq 100 1.08% and the Dow 0.67%. Communication services (−1.58%), consumer discretionary (−1.41%) and financials (−1.19%) were the weakest sectors; only health care (+0.33%), consumer staples (+0.27%) and energy (+0.10%) rose. Nvidia gained 1.7% after announcing a $150 billion share buyback, while MongoDB lost 18.5% after its chief executive, Chirantan Desai, left for Meta Platforms (Motley Fool).
Europe closed flat: the STOXX 600 finished unchanged at 638.68, the CAC 40 up 0.01% and the DAX down 0.13%. Long European yields are at multi-year highs: the 10-year Bund is quoted at 3.63%, its highest since June 2009, and the 10-year gilt at 5.40%, the highest in nearly two decades (Trading Economics). French and Italian 10-year yields rose about 5 bp against 1 bp for Germany, widening the premium France pays over Germany to 115 bp. ECB President Christine Lagarde said the ECB's inflation forecasts for 2027 and 2028 are pushed up by energy while wage pressure stays contained; on 28 September money markets priced about 100 bp of further ECB rate rises by the end of 2027 (Trading Economics). Asia fell as Korea and mainland China reopened after their holidays: the Kospi dropped 2.70%, with Samsung Electronics and SK Hynix both down more than 5% (TradingKey), Shanghai lost 1.67% and India's Nifty 1.56%, while Hong Kong rose 0.54%. The Nikkei fell 0.73%.
Global Indices Snapshot
Americas
| Index | Level | Day Chg | Day Chg % | Source |
|---|---|---|---|---|
| S&P 500 | 7,683.69 | −59.72 | −0.77% | yfinance ^GSPC |
| Nasdaq 100 | 30,276.81 | −331.32 | −1.08% | yfinance ^NDX |
| Dow Jones | 51,481.51 | −347.11 | −0.67% | yfinance ^DJI |
| Brazil IBOV | 182,991.12 | −485.73 | −0.26% | yfinance ^BVSP |
Americas data reflects the 28 Sep close. The S&P 500 is 1.70% below its record of 7,816.70 and 0.62% above its 50-day average (7,636). The Nasdaq 100 is 1.58% below its record. The Dow is 2.49% below its 50-day average (52,797).
Europe
| Index | Level | Day Chg | Day Chg % | Source |
|---|---|---|---|---|
| Euro STOXX 600 | 638.68 | +0.03 | +0.00% | yfinance ^STOXX |
| CAC 40 | 8,078.48 | +0.68 | +0.01% | yfinance ^FCHI |
| DAX | 25,374.42 | −34.22 | −0.13% | yfinance ^GDAXI |
| FTSE 100 | 10,684.88 | −10.37 | −0.10% | yfinance ^FTSE |
| SMI (Swiss) | 13,942.91 | −2.80 | −0.02% | yfinance ^SSMI |
European data reflects today's close (28 Sep). All five indices remain below their 50-day averages: the FTSE by 0.77%, the STOXX 600 by 1.48%, the DAX by 1.69%, the SMI by 2.24% and the CAC 40 by 3.64%. The CAC is also 1.98% below its 200-day average (8,242); the others are above theirs. The Euro STOXX 50 closed at 6,301.28, down 0.02%.
Asia-Pacific
| Index | Level | Day Chg | Day Chg % | Source |
|---|---|---|---|---|
| Nikkei 225 | 65,877.62 | −486.59 | −0.73% | yfinance ^N225 |
| Hang Seng | 24,642.51 | +132.42 | +0.54% | yfinance ^HSI |
| Shanghai Comp | 3,823.62 ‡ | −64.75 | −1.67% | yfinance 000001.SS |
| ASX 200 | 8,679.70 | +14.70 | +0.17% | yfinance ^AXJO |
| Kospi (Korea) | 6,889.74 † | −191.18 | −2.70% | yfinance ^KS11 |
Asia-Pacific data reflects today's close (28 Sep). † Kospi: the change is against the 23 September close; Korea was closed 24–25 September for Chuseok, so today's fall covers three sessions of global news. ‡ Shanghai Comp: the change is against the 24 September close; mainland China was closed on 25 September.
Emerging Markets
| Index | Level | Day Chg % | Source |
|---|---|---|---|
| MSCI EM (EEM) | 67.20 | −1.15% | yfinance EEM |
| India Nifty 50 | 22,780.25 | −1.56% | yfinance ^NSEI |
| South Africa | 64.47 | −3.02% | yfinance EZA |
EEM, EZA and the Nifty reflect the 28 Sep close. On Friday EEM rose 1.09% in New York while Korea and mainland China were shut; their first sessions back did not confirm that rise.
Index Valuations & Investment Risk
Valuation Table
| Index | Trailing P/E (live) | 50-day avg | 100-day avg | 200-day avg |
|---|---|---|---|---|
| S&P 500 | 24.7x | 25.7x | — | — |
| Nasdaq 100 | 30.0x | 30.3x | — | — |
| Euro STOXX 600 | 17.6x | 18.2x | — | — |
| CAC 40 | 16.5x | 17.3x | — | — |
| DAX | 18.0x | 18.6x | — | — |
| FTSE 100 | 15.2x | 17.4x | — | — |
| Nikkei 225 | 21.8x | 21.7x | — | — |
| MSCI EM | 14.3x | 16.1x | — | — |
Averages of the daily trailing P/E readings recorded since 1 May 2026 (n = 98); shown for reference only.
Investment Risk Assessment for ETF Investors
United States (S&P 500 / Nasdaq ETFs)
The S&P 500's trailing P/E of 24.7x gives an earnings yield of 4.04% (1÷24.74). Against the 10-year Treasury at 5.24% (US Treasury par curve, 28 Sep), the earnings yield gap is −1.20 pp: a 10-year government bond currently pays more in income than the index's earnings amount to per dollar invested. Measured against the real 10-year yield of 2.90% (US Treasury real curve, 28 Sep), the gap is +1.14 pp; the difference between the two, about 2.3 pp, is the correction for the fact that company earnings tend to grow with inflation while a bond coupon is fixed. Of the earnings yield, only the part paid out as dividends and buybacks reaches the holder as cash. The index sits 1.70% below its record and 6.64% above its 200-day average (7,205), so the price has not yet adjusted much to yields above 5%. The Nasdaq 100 at 30.0x is more exposed still: its earnings yield of 3.33% is 1.91 pp below the 10-year Treasury. Today's sector moves show what rising yields do: the funds holding communication services and consumer discretionary shares, where more of the value lies in profits expected years ahead, fell the most, while health care and consumer staples held up.
Europe (STOXX 600 / CAC 40 / DAX ETFs)
The STOXX 600 at 17.6x gives an earnings yield of 5.69% (1÷17.58); against the 10-year Bund at 3.63% (Trading Economics, 28 Sep) the euro earnings yield gap is +2.06 pp, and against the euro-area real 10-year yield of 1.58% (see Real Yields below) it is +4.11 pp. The S&P 500 trades at a 41% P/E premium to the STOXX 600 (24.7x against 17.6x). Part of the difference between the US and euro gaps reflects different inflation and policy paths rather than different compensation for risk, which is why the real-yield versions are shown alongside. The CAC 40 at 16.5x is the cheapest of the three major euro indices and also the weakest: 3.64% below its 50-day and 1.98% below its 200-day average, with the French 10-year now 115 bp above Germany's. For a euro investor holding euro-quoted funds, the quoted value carries no exchange-rate effect, but the constituents earn a large share of their profits abroad, so a weaker dollar still reaches their earnings.
Japan (Nikkei / TOPIX ETFs)
The Nikkei ETF proxy trades at 21.8x. The Bank of Japan raised its policy rate to 1.25% on 18 September, its second rise this year after the 16 June move to 1.00%, and the 10-year JGB yield is 3.10% (Trading Economics, 28 Sep). The yen is near 157 per dollar; last week the finance minister said President Trump had raised concern about the weak yen. For a euro investor an unhedged Japan fund carries the yen's moves in full, so the choice between a hedged and an unhedged fund matters as much as the view on Japanese shares.
Emerging Markets (MSCI EM ETFs)
EEM trades at 14.3x, the cheapest of the eight indices in the table, and below its own 50-day average reading (16.1x). Today's fall in New York (−1.15%) is consistent with what the local markets did: Korea −2.70%, mainland China −1.67%, India −1.56%, with Hong Kong the exception at +0.54%. Korea's fall was led by the two memory-chip makers, Samsung Electronics and SK Hynix, each down more than 5% (TradingKey). Rising US yields hurt emerging markets through the local economy rather than only through the exchange rate: companies and governments with dollar debt pay more, foreign money tends to leave, and local central banks come under pressure to raise their own rates. That applies whatever currency the investor spends. The conversion effect for a euro holder is smaller, since the euro also slipped against the dollar today (−0.11%).
Overall Risk Score: - United States: High valuation risk / low margin of safety. A negative nominal earnings yield gap, an index close to its record, and 10-year yields still rising. - Europe: Moderate. Positive earnings yield gaps on both measures, but rising Bund and OAT yields and a CAC below both its moving averages. - Japan: Moderate. Valuation near its recent average; the BOJ and the yen are the main risks. - Emerging Markets: Attractive relative valuation, with higher US yields and an unresolved Hormuz dispute as the near-term headwinds.
US Economic Indicators (FRED - authoritative)
| Indicator | Current | Prior | Delta | Reference Date | FRED Series |
|---|---|---|---|---|---|
| CPI YoY % | 3.35% | 3.30% | +0.05 pp | Aug 2026 (prior Jul) | CPIAUCSL |
| Core CPI YoY % | 2.45% | 2.47% | −0.02 pp | Aug 2026 (prior Jul) | CPILFESL |
| Unemployment Rate | 4.1% | 4.1% | 0.0 pp | Aug 2026 (prior Jul) | UNRATE |
| Nonfarm Payrolls | +162k | +21k | +141k | Aug 2026 (prior Jul), monthly chg | PAYEMS |
| 10Y TIPS Real Yield | 2.90% | 2.83% | +7 bp | 28 Sep 2026 (prior 25 Sep) | DFII10 (US Treasury real curve) |
Headline inflation at 3.35% is running well above core at 2.45%, which is the gap energy prices open up: the Hormuz dispute works on inflation through fuel, not through wages. September's employment report is due on Friday 2 October.
Other economic releases today: no major scheduled data. The week's calendar is below under Looking Ahead.
Fixed Income & Bond Analysis
US Treasury yields in the tables come from the US Treasury's own daily feed and are the 28 September close. European, UK and Japanese yields are from Trading Economics, 28 September.
Policy Rates
| Central Bank | Rate | Source |
|---|---|---|
| Fed Funds (upper) | 4.00% | FRED DFEDTARU (28 Sep) |
| Fed Funds (lower) | 3.75% | FRED DFEDTARL (28 Sep) |
| Effective FFR | 3.88% | FRED DFF (25 Sep) |
| ECB Deposit Rate | 2.50% | FRED ECBDFR (28 Sep) |
| BOJ Policy Rate | 1.25% | web search (raised 18 Sep 2026) |
| BOE Bank Rate | ~3.73% | SONIA/FRED IUDSOIA (24 Sep) |
The Fed raised its target range to 3.75–4.00% on 16 September, its first hike since 2023. The ECB deposit rate has been 2.50% since 10 September, its second hike this year after 17 June's move to 2.25%. UK money markets priced about an 85% chance on 28 September of a Bank of England rise in November (Trading Economics).
Government Bond Yields
| Country | 2Y Yield | 10Y Yield | 30Y Yield | Day Chg (10Y) | Source |
|---|---|---|---|---|---|
| USA | 4.92% | 5.24% | 5.56% | +7 bp | US Treasury par curve (28 Sep) |
| Germany | 3.27% | 3.63% | 3.96% | +0.9 bp | web (Trading Economics, 28 Sep) |
| France | — | 4.78% | — | +5.1 bp | web (Trading Economics, 28 Sep) |
| UK | 4.89% | 5.40% | 5.89% | +4.9 bp | web (Trading Economics, 28 Sep) |
| Japan | — | 3.10% | — | +2.8 bp | web (Trading Economics, 28 Sep) |
| Italy | — | 4.60% | — | +5.4 bp | web (Trading Economics, 28 Sep) |
US day change is 28 Sep vs 25 Sep.
Yield Curve Spreads (US Treasury par curve, 28 Sep): - 10Y-2Y spread: +32 bp. Positive and moderately sloped: neither inverted nor steep. Investors are asking a modest extra yield for lending over ten years rather than two. - 10Y-3M spread: +96 bp. Firmly positive, not a recession signal. The 3-month bill at 4.28% sits about 40 bp above the Fed funds midpoint of 3.875%, consistent with the bill market expecting another Fed rise within the next few months.
OAT-Bund Spread: the French 10-year at 4.78% against the Bund at 3.63% puts the spread at 115 bp, about 4 bp wider on the day. France is paying more than Italy (4.60%), whose spread over Germany is 97 bp. French and Italian 10-year yields rose by about the same amount (5.1 bp and 5.4 bp, against 0.9 bp for the Bund), so the widening reads as a move in the higher-yielding euro bonds generally rather than a French event.
Yield Curve Charts
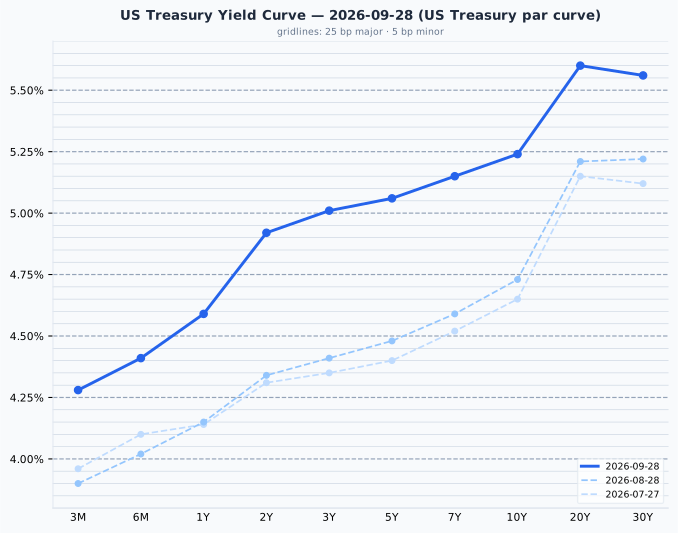
The US curve on 28 September rises from 4.28% at 3 months to 5.60% at 20 years, dipping slightly to 5.56% at 30 years. Since 28 August the whole curve has moved up by about half a percentage point at short and middle maturities (2-year from 4.34% to 4.92%, 10-year from 4.73% to 5.24%) and by less at the long end (30-year from 5.22% to 5.56%), the pattern of a market pricing more Fed rises.
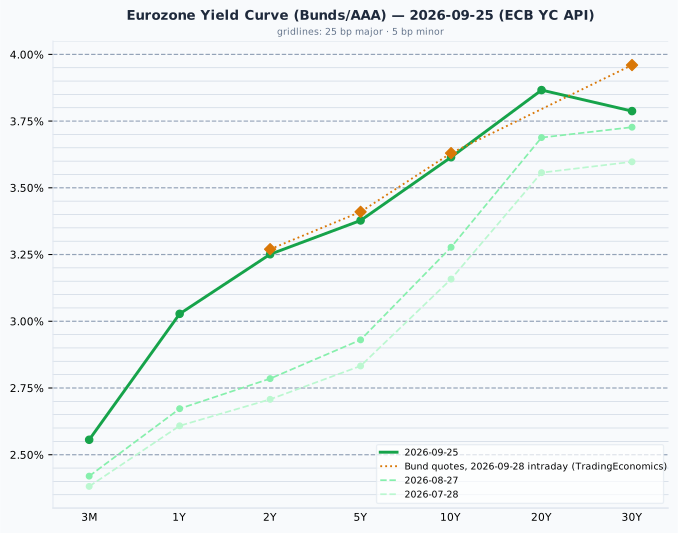
The euro AAA curve on 25 September slopes upward from 2.56% at 3 months to 3.87% at 20 years, dipping to 3.79% at 30 years. Since 27 August it has risen 47 bp at the 2-year (2.79% to 3.25%) and 34 bp at the 10-year (3.28% to 3.61%), led by the short end after the ECB's 10 September hike. Today's Bund quotes (amber) sit 2 to 3 bp above the plotted 25 September curve out to 10 years but 17 bp above it at 30 years (3.96% against 3.79%). The curve is the ECB's fitted AAA euro-area curve and the quotes are individual German bonds, which normally sit a few bp apart; the 30-year gap was also 17 bp on Friday, so today's figure reflects that difference in construction rather than a new rise.
Credit Markets (from FRED, authoritative)
| Market | OAS | Obs. date | vs prior obs | Series ID |
|---|---|---|---|---|
| US Investment Grade | 81 bp | 25 Sep | +2 bp | BAMLC0A0CM |
| US High Yield | 293 bp | 25 Sep | +13 bp | BAMLH0A0HYM2 |
| Euro High Yield | 279 bp | 25 Sep | +2 bp | BAMLHE00EHYIOAS |
Change is 25 Sep vs 24 Sep.
Credit spreads are the 25 September close; today's session is not in them yet. US high yield at 293 bp is still below the 300–500 bp band that is normal for it, so lenders to riskier companies are asking historically little extra over Treasuries, even after Friday's 13 bp widening. Investment grade at 81 bp is at the low end of its 80–150 bp normal range. The VIX was last recorded at 14.21 (FRED VIXCLS, 22 Sep), a low reading, but it is six days old and predates today's fall.
Real Yields (US and Euro Area)
| Region | Nominal 10Y | Expected inflation | Real 10Y | How the real yield is obtained |
|---|---|---|---|---|
| United States | 5.24% (28 Sep) | 2.34% (nominal − real, residual) | 2.90% (28 Sep) | Measured. Inflation-protected Treasuries (TIPS) trade, so the market quotes a real yield directly; expected inflation is the residual |
| Euro area | 3.61% (ECB AAA, 25 Sep) | 2.04% (ECB SPF, 2026 Q3, measured) | 1.58% (nominal − expected, residual) | Constructed. No euro inflation-linked benchmark is published, so a survey expectation is subtracted from the nominal yield |
Only the US real yield is a market price; the euro figure is derived from a survey and is the softer of the two numbers. The US figure also includes a premium investors demand for inflation risk that a survey does not, and the survey's horizon is five years against the bond's ten. With the US leg at 28 September and the euro leg at 25 September, the 163 bp gap between US and euro nominal 10-year yields splits into about 30 bp of expected-inflation difference (2.34% against 2.04%) and about 132 bp of real-rate difference (2.90% against 1.58%): nearly all of it is a difference in real rates. The US real yield rose 7 bp on 28 September, from 2.83% on 25 September, matching the nominal rise, so expected inflation was unchanged.
Why the US real-yield advantage is not a return a euro investor can capture
A real yield is real in its own currency: 2.90% is 2.90% above US inflation, not above euro-area inflation. Hedging a Treasury back into euros removes the interest-rate difference through the forward exchange rate, so the hedged return ends up close to the euro bond's; left unhedged, the extra yield becomes a bet on the dollar rather than a bond decision. The gap describes the difference between the two economies' growth and policy settings, and has persisted in every quarter since 2014 for that reason.
Bond Portfolio Implications
- S&P 500 earnings yield gap: 4.04% (1÷24.74) − 5.24% = −1.20 pp nominal; +1.14 pp against the 2.90% real yield.
- Euro earnings yield gap: 5.69% (1÷17.58) − 3.63% (Bund) = +2.06 pp nominal; +4.11 pp against the 1.58% euro real yield.
These compare the income on offer today: a US investor can lock in 5.24% for ten years in Treasuries, against an earnings yield of about 4% on the S&P 500 that grows with profits but is only partly paid out. They say nothing about which asset will return more over the coming years.
A 10 bp rise in yields is an ordinary day's move. At today's settled par yields it costs:
| Maturity | Yield | Modified duration | Loss for a 10 bp rise | Months of coupon lost |
|---|---|---|---|---|
| 2-year | 4.92% | 1.88 | 0.19% | 0.5 |
| 10-year | 5.24% | 7.71 | 0.77% | 1.8 |
| 30-year | 5.56% | 14.51 | 1.44% | 3.1 |
Par-bond figures at the 28 Sep settled yields.
Today's 7 bp rise at the 10-year is seven-tenths of the table's row, a loss of about 0.5% or about a month and a quarter of coupon. With the 2-year paying 4.92% for less than a quarter of the 10-year's price sensitivity, short maturities still offer most of the income for far less exposure to further rises while the Fed keeps pushing yields up.
Currencies & Commodities
Currencies
| Pair | Rate | Day chg % | Source |
|---|---|---|---|
| EUR/USD | 1.1380 | −0.11% | yfinance (19:49 CEST) |
| USD Index (DXY, ICE) | 101.14 | +0.17% | yfinance (19:40 CEST) |
| USD/JPY | 157.21 | +0.01% | yfinance (19:50 CEST) |
| GBP/USD | 1.3269 | +0.18% | yfinance (19:49 CEST) |
| USD/CHF | 0.8312 | +0.35% | yfinance (19:50 CEST) |
FX quotes as of 19:40–19:50 CEST; day change vs the previous 17:00 ET close.
The dollar firmed modestly as US yields rose. Sterling gained against it (+0.18%) as UK markets priced a Bank of England rise, while the Swiss franc weakened most (−0.35% against the dollar). The yen was unchanged near 157.
Commodities
| Commodity | Price | Day Chg % | Ticker | Source |
|---|---|---|---|---|
| Brent Crude | 97.83 | +0.40% | BZ=F | yfinance |
| WTI Crude | 92.60 | +0.21% | CL=F | yfinance |
| Gold ($/oz) | 4,168.40 | −3.54% | GC=F | yfinance |
| Silver ($/oz) | 61.72 | −4.76% | SI=F | yfinance |
| Copper ($/lb) | 6.6335 | −1.96% | HG=F | yfinance |
| Nat Gas ($/MMBtu) | 3.106 | −3.69% | NG=F | yfinance |
Prices are 28 Sep settlements; day changes are settlement vs the prior session's settlement (25 Sep).
The table shows the December Brent contract (BZZ26), November WTI (CLX26), December gold, silver and copper, and November natural gas, the same contracts as Friday's briefing. Press reports today quoted Brent between about $105 and $107 (CNBC, Trading Economics), some $8 above the December contract here; those reports do not name the contract month, so the table does not use that figure. The WTI quotes in the same reports agree with the November contract. Both crude contracts remain far below their 52-week highs (Brent $126.10, WTI $119.48) and well above their 52-week lows ($58.72 and $54.98).
Gold at $4,168.40 is 25.4% below its all-time high of $5,586.20 (29 January 2026) and 10% above its 52-week low of $3,785.50. Silver at $61.72 is 49.1% below its all-time high of $121.30, set the same day. Copper at $6.63 is slightly below its all-time high of $6.83, set on 22 September, 2.9% away. Natural gas at $3.11 sits in the lower part of its 52-week range ($2.48 to $7.83).
Crypto: not covered today.
Sector & Theme Highlights
US sector funds (Select Sector SPDRs, 28 Sep close): health care (XLV) +0.33%, consumer staples (XLP) +0.27% and energy (XLE) +0.10% were the only sectors up. Communication services (XLC) −1.58%, consumer discretionary (XLY) −1.41% and financials (XLF) −1.19% were the weakest, followed by industrials (XLI) −0.97%, technology (XLK) −0.89%, materials (XLB) −0.66%, utilities (XLU) −0.66% and real estate (XLRE) −0.51%.
- Rising yields versus long-dated profits: the sectors whose value depends most on earnings far in the future (communication services, consumer discretionary) fell more than those with steady current income (health care, staples).
- Precious metals: gold (−3.54%) and silver (−4.76%) fell sharply as higher yields raised the cost of holding assets that pay no interest.
- Memory chips: Samsung Electronics and SK Hynix each fell more than 5% in Seoul (TradingKey), the main reason for the Kospi's 2.70% drop, while Intel and AMD fell in New York on concerns about AI safety (Motley Fool). Nvidia rose 1.7% on its $150 billion buyback.
- Energy and Hormuz: crude swung on the Iran headlines but settled close to flat, and energy shares rose only 0.10%; the Saudi East-West pipeline restart limits how far a Hormuz closure can squeeze supply.
Top Stories (Global)
- Trump rejects Iran's Hormuz proposal. Iran offered to reopen the strait and resume nuclear talks within seven days if the US lifted its blockade of Iranian ports, waived oil sanctions and observed a ceasefire including Lebanon; Trump said he rejected it, and told aides he expects strikes to resume after the midterms (NBC, Al Jazeera, The Hill).
- Long yields at multi-year highs. The 10-year Treasury touched 5.26% at midday and closed at 5.24%, the highest close since 2007 per the press, and the 30-year closed at 5.56%, the highest since 2004; the 10-year Bund reached 3.63%, the highest since June 2009; the 10-year gilt 5.40%, the highest in nearly two decades (Motley Fool, Trading Economics, Yahoo Finance).
- Gold falls 3.5%, silver 4.8% as rising yields and expectations of another Fed rise reduce the appeal of assets that pay nothing.
- Lagarde: energy prices push up the ECB's 2027–28 inflation forecasts while wage growth stays contained; on 28 September markets priced about 100 bp of ECB rises by the end of 2027 (Trading Economics).
- Korea reopens with a 2.7% fall after Chuseok, led by Samsung Electronics and SK Hynix; Shanghai drops 1.7% after its own holiday, and India's Nifty closes below 23,000 on oil worries (AP, TradingKey, HDFC Sky).
- Nvidia announces a $150 billion share buyback; MongoDB falls 18.5% after its CEO leaves for Meta (Motley Fool).
- Saudi Arabia restarts its East-West pipeline after repairs, which let WTI give back most of an early jump to $96.54 (Fortune, Trading Economics).
Looking Ahead
- Tuesday 29 September: US Conference Board consumer confidence and JOLTS job openings.
- Wednesday 30 September: third estimate of US second-quarter GDP, with the BEA's annual revisions, and August personal income and outlays, including the PCE price index the Fed targets (one calendar lists PCE for Thursday instead).
- Thursday 1 October: ISM manufacturing index and weekly jobless claims. The PCE reading is the next test of the roughly 70% chance futures put on an October Fed rise at the end of last week.
- Friday 2 October: US September employment report.
- Middle East: any change in the US-Iran standoff over Hormuz moves oil, and through oil the inflation outlook and bond yields.
- Bonds: whether the 10-year Treasury holds above 5.2% and the 10-year Bund above 3.6%; both are at their highest since 2007 and 2009 respectively.
- Japan: the next BOJ meeting is on 28 October; the yen near 157 per dollar keeps the question of intervention open.
Market closures - Wednesday 30 September: Canada, National Day for Truth and Reconciliation (public holiday). - Saturday 3 October: Germany, German Unity Day (falls on a weekend; no trading-day closure).
Special Analysis: Why MongoDB Lost 18% When Its Chief Executive Left for Meta
Added 29 September 2026. MongoDB's shares fell 18.5% on 28 September, taking about $6bn off its market value, after its chief executive of eleven months left with immediate effect to run Meta's new business selling AI tools to companies, one day before MongoDB's Investor Day. The company had just reported its fastest revenue growth in several years and reaffirmed its guidance, so the fall measures how much of a share price set at almost 12 times sales rested on confidence in who would keep that growth going.
What happened
Before Monday's open, MongoDB announced that Chirantan "CJ" Desai had resigned as president and chief executive, effective immediately, to become Meta Platforms' chief enterprise platform officer, reporting to Mark Zuckerberg. Meta launched the unit the same day: the Meta Enterprise Platform will sell Meta's AI tools, including the Muse agent, the Muse API and the Muse Code coding product, to businesses and developers (Meta). Desai, previously head of product and engineering at Cloudflare and before that president and chief operating officer of ServiceNow, had taken over on 10 November 2025 from Dev Ittycheria, who ran MongoDB from 2014 and stayed on its board as an adviser. Ittycheria now returns as interim chief executive while the board and an executive search firm look for a permanent one. The company's filing says the resignation "is not due to any disagreement with the Company", and it reaffirms the third-quarter and full-year guidance issued on 1 September.
The shares opened at $311.35, 24% below Friday's close of $410.44, touched $300.00, 27% below it, and closed at $334.68, down 18.46%: buyers recovered about a third of the worst loss during the session. Volume was 17.8 million shares, against 1.0 to 2.1 million a day over the previous two weeks. The company's market value fell from $33.0bn to $26.9bn. The close is near the 31 July level of $337.48, so the fall erased everything the shares had gained since the end of July, including an August rise that peaked at $473.10 on 14 August, but no more.
The business Desai was running
MongoDB sells a database that stores information as flexible documents rather than in the fixed rows and columns of a traditional relational database. Of its $772m of revenue in the quarter to July, $566m (73%) came from Atlas, the service in which MongoDB runs the database for customers on the major cloud providers' infrastructure and charges them for use. Most of the rest comes from Enterprise Advanced, a licence for companies that run the database on their own servers, often sold in multi-year deals whose timing makes that revenue uneven from quarter to quarter.
| Quarter to | Revenue | Operating profit, standard accounting | Stock-based pay | Free cash flow |
|---|---|---|---|---|
| Jul 2025 | $591m | −$65m (−11.0%) | $140m (23.7%) | $72m |
| Oct 2025 | $628m | −$18m (−2.9%) | $134m (21.3%) | $142m |
| Jan 2026 | $695m | +$0.3m (0.0%) | $144m (20.7%) | $178m |
| Apr 2026 | $688m | −$25m (−3.6%) | $138m (20.0%) | $199m |
| Jul 2026 | $772m | +$28m (3.7%) | $149m (19.3%) | $139m |
Company figures via Yahoo Finance; the fiscal year ends in January. Figures in brackets are shares of revenue. Operating profit is after stock-based pay; free cash flow is cash from operations less capital spending.
Revenue in the quarter to July was 30.5% higher than a year earlier, the highest growth "in several years" in the company's words, and under standard accounting rules (GAAP) MongoDB made an operating profit of $28m against a $65m loss a year earlier. Its adjusted operating margin, which leaves out stock-based pay, was 24%, up from 15%. The difference between the two measures is the pay the company issues in shares, $149m in the quarter or 19% of revenue. Shareholders bear that cost through dilution rather than through cash, since each new share shrinks existing holders' slice of the company; that is also why free cash flow runs far above operating profit. The balance sheet is not a concern: $2.4bn of cash and short-term investments against $55m of debt, and share buybacks of about $100m a quarter this year.
The shares had already fallen once this month
The results published after the close on 1 September beat analysts' forecasts and raised the full-year revenue outlook to $2.99bn to $3.03bn, yet the shares fell 13.5% the next day, to $375.40. Guidance for the third quarter, $756m to $761m of revenue, is 1% to 2% below the quarter just reported and implies Atlas growth of about 26%, after about 29% in each of the five quarters to July; management also said it would stay cautious in forecasting Enterprise Advanced, whose multi-year deals are hard to time (Investing.com). The shares then rose 20%, from $356.00 on 8 September to $428.36 on 23 September, and closed at $410.44 on Friday.
That is the context for Monday. Since December 2025 the shares have moved more than 13% in a day after three quarterly reports: up 22% on 2 December, down 22% on 3 March and down 13.5% on 2 September. Each was a verdict on the growth outlook, and each moved the price by an amount that would be extraordinary for a company valued on the profits it earns today. Monday's news concerned not the numbers but the people expected to deliver them.
How little it takes to move a price set on distant growth
The valuation formula used in the 23 September Special Analysis makes this concrete. If a company's earnings grow at a constant rate g for ever and investors require a return r, its price-to-earnings ratio is approximately (1÷(r − g)). On analysts' forecast of next year's earnings, which leave out stock-based pay, MongoDB traded at 52.7 times on Friday and 42.9 times at Monday's close. The first implies r − g of 1.90% (1÷52.7), the second 2.33% (1÷42.9). Holding the required return fixed, the whole of Monday's fall is equivalent to investors lowering the growth rate they assume MongoDB can sustain indefinitely by less than half a percentage point.
The formula is an illustration, not a valuation. MongoDB pays no dividend, its current growth of 20% to 30% is far above any rate a company can sustain for ever, and on earnings under standard accounting, which count stock-based pay as a cost, its price-to-earnings ratio over the past twelve months is 587. What the formula shows is how thin a margin the price leaves: when required return and assumed growth are two percentage points apart, a small doubt about growth is a large share of that gap. The sales multiple says the same. On Friday investors were paying 11.9 times the past twelve months' revenue of $2.78bn for a company with a 3.7% operating margin under standard accounting, so nearly all of the value rested on profits expected years ahead; Monday's close brought the multiple down to 9.7 times.
Why a chief executive's exit costs this much
Three features of the departure turned a change of management into a question about the growth itself.
The timing. The resignation took effect immediately, with no permanent successor named, one day before the Investor Day at which the company was due to present its strategy at Nasdaq in New York. William Blair's analyst said the announcement "creates more questions than answers" going into the event (TipRanks). An interim chief executive can reaffirm guidance, and the company did, but a multi-year plan presented under interim leadership carries less weight, because a permanent successor may change it.
What the departure signals. The person with the closest view of MongoDB's prospects chose to leave eleven months into the job. The filing rules out a disagreement, and a newly created role reporting directly to Zuckerberg is reason enough to move, but outside investors cannot know what Desai knew, and when the best-informed insider leaves they discount for the possibility of something they cannot see. The destination adds to the doubt: Meta's new unit will sell AI tools to the same corporate technology buyers to whom MongoDB sells its database.
Who delivers the growth. The 1 September guidance had already raised the question of whether Atlas can keep growing near 29%. The answer now rests with an interim leader and a successor not yet chosen. DA Davidson pointed to Desai's relationships with large corporate customers, which it said had helped MongoDB win larger and longer commitments, and kept its buy rating and $465 price target. The interim chief is no stranger, though: during Ittycheria's eleven years in charge, annual revenue grew from about $35m to more than $2.3bn (company), and Ittycheria has advised the company since stepping down. Needham called the timing "unfortunate" but said the departure did not appear to reflect weakness in the business, and kept its buy rating and $430 target (Yahoo Finance).
What it means for readers
Elsewhere on 28 September, rising yields drove the market: the Nasdaq 100 fell 1.08%, and the sectors whose value lies furthest in the future fell most. MongoDB's fall was specific to the company and far larger, but the mechanism is related. The thin gap between required return and assumed growth that makes a high-multiple stock sensitive to a rise in yields, as the 23 September Special Analysis measured, also makes it sensitive to anything that shakes confidence in the growth, a change of leader included. The mean analyst price target, $454 from 37 analysts on Yahoo Finance, predates any revisions for the departure. The tests come in order: the Investor Day on 29 September, now led by an interim chief executive; any target cuts in the days after it; and the third-quarter results, which Yahoo Finance expects around 1 December, where Atlas growth at or above the guided 26% would be the most direct evidence that the growth survives the change at the top.