2026 09 23
Global Financial Briefing — Wednesday, 23 September 2026
Americas index levels, European closes, commodities and day changes reflect the 23 Sep closing print. The US Treasury curve is the 23 Sep settled close, so the USA bond row, the spreads, the real yield and the US curve chart follow it. The euro AAA curve is the 22 September publication; FX, credit and macro figures are dated inline.
Market Overview
The US 10-year Treasury yield settled through 5% today, at 5.11% on the Treasury par curve, up 15.0 bp on the day and a level the financial press reports as the highest since July 2007. The move built through the session rather than fading: the 5.08% the yield printed late morning was not the top. This was not an American event: every major government bond market sold off together, and the cause arrived in the morning data. Flash PMIs came in hot on both sides of the Atlantic, with the US services index at 58.7, its strongest reading in nearly five years, against a 56.0 consensus, and the euro area composite at 53.1 from 52.0, the fastest expansion in almost three and a half years. In the US the demand is domestic, and orders are arriving faster than firms can fill them. Strong activity would be benign on its own; strong activity arriving with input and output prices rising at their fastest pace in four months is what moved yields. Oil did the rest, Brent rebounding after five consecutive declines as Saudi Arabia prepared to restart exports through its East-West pipeline and US-Iran talks were described as productive.
The result was a textbook rates shock rather than a growth scare. Sovereign 10-year yields rose 10 to 16 bp almost everywhere: Germany +10.6 bp, France +13.7 bp, Italy +16.3 bp, the UK +13.2 bp, Spain +13.1 bp (TradingEconomics, 23 September intraday), with the US settling at the top of that range, +15.0 bp. Equities gave way in proportion to their duration, the Nasdaq 100 closing down 0.85% against the S&P 500's 0.75% and the Dow's 0.68%, with energy the only sector to rise. The dollar rose against everything, the ICE index up 0.47% to 101.07, and gold settled 1.33% lower with silver down 2.35%, which is what a rise in real yields does to metals that pay no coupon. The driver behind the dollar, the metals and the equity ordering was the real yield: the 10-year US real yield rose 13 bp to 2.76% (US Treasury real curve, 23 September), almost the whole of the 15 bp rise in the nominal yield, so investors were demanding a higher return after inflation rather than pricing more inflation. Governor Barr's call for further tightening made the headlines, but the move came from the data.
For a euro-based reader the notable detail is beneath the euro-area aggregate. France returned to growth for the first time in ten months, and Germany expanded at its fastest pace in nearly a year, yet the French 10-year OAT at 4.644% now trades above the Italian BTP at 4.524%, with the OAT-Bund spread near 108 bp. Investors can see the French economy improving and still worry about the French state's finances, and today they did both: the better activity data did not stop lenders demanding more to hold French government debt, as the widening spread over Germany shows. The CAC 40 closed down 0.39% and sits 3.29% below its 50-day average, the weakest position among the major European indices relative to its own trend.
Global Indices Snapshot
Americas
| Index | Level | Day Chg | Day Chg % | Source |
|---|---|---|---|---|
| S&P 500 | 7,706.03 | -58.61 | -0.75% | yfinance ^GSPC |
| Nasdaq 100 | 30,470.29 | -262.10 | -0.85% | yfinance ^NDX |
| Dow Jones | 51,511.59 | -352.10 | -0.68% | yfinance ^DJI |
| Brazil IBOV | 185,814.10 | -1,608.82 | -0.86% | yfinance ^BVSP |
Americas data reflects the 23 Sep close. The S&P 500 is 1.05% above its 50-day average (7,626) and 7.14% above its 200-day (7,192), 1.42% below its record of 7,816.70. The Nasdaq 100 is 0.95% below its record of 30,762.20, still 4.28% above its 50-day. The Dow is 2.55% under its 50-day average (52,857) and 5.91% below its record. Since mid-month the heaviest drag has come from financial stocks (Goldman Sachs, American Express, Travelers, JPMorgan) and software (Salesforce, IBM), whose high share prices carry extra weight in a price-weighted index; Verizon, the Dow's most bond-like stock, fell furthest in percentage terms, down almost 10%. All four indices fell further into the close than they stood at late morning, and Brazil by far the most: the IBOV was down 0.17% at 11:48 ET and closed down 0.86%, a fall driven in the afternoon session alongside the US long end rather than by anything domestic.
Europe
| Index | Level | Day Chg | Day Chg % | Source |
|---|---|---|---|---|
| Euro STOXX 600 | 639.92 | -2.86 | -0.44% | yfinance ^STOXX |
| CAC 40 | 8,123.41 | -31.50 | -0.39% | yfinance ^FCHI |
| DAX | 25,410.63 | -168.22 | -0.66% | yfinance ^GDAXI |
| FTSE 100 | 10,705.26 | -3.07 | -0.03% | yfinance ^FTSE |
| SMI (Swiss) | 13,921.72 | -31.67 | -0.23% | yfinance ^SSMI |
European figures are the official 23 Sep closes. Every major European index fell on the day, the FTSE 100 only marginally, and the FTSE was still the region's best performer, its energy weighting doing the work on a day Brent rose almost 3%. Every major European index is also below its 50-day average: the STOXX 600 by 1.33%, the DAX by 1.45%, the FTSE by 0.50%, the SMI by 2.55% and the CAC 40 by 3.29%. All five remain above their 200-day averages except the CAC, which is 1.43% under its own (8,241).
Asia-Pacific
| Index | Level | Day Chg | Day Chg % | Source |
|---|---|---|---|---|
| Nikkei 225 | 65,018.95 † | — | — | yfinance ^N225 |
| Hang Seng | 24,834.12 | -253.63 | -1.01% | yfinance ^HSI |
| Shanghai Comp | 3,936.52 | -15.61 | -0.39% | yfinance 000001.SS |
| ASX 200 | 8,765.30 | +7.50 | +0.09% | yfinance ^AXJO |
| Kospi (Korea) | 7,080.92 | +63.01 | +0.90% | yfinance ^KS11 |
† Nikkei 225: 23 September is Autumnal Equinox Day, so Tokyo was closed today. It was also closed on Monday 21 September (Respect for the Aged Day), and press reporting confirms the exchange was shut for the whole of 21 to 23 September, the intervening Tuesday falling between two national holidays. The level shown is therefore the 18 September close, and no day change can be given. Other Asia-Pacific data reflects today's close (23 Sep). The Nikkei is 0.97% under its 50-day average (65,657) and 10.72% below its record of 72,831.73. The Kospi's 0.90% gain leaves it 5.94% above its 50-day and 13.54% above its 200-day, though still 24.55% below its record of 9,385.59. Both Chinese markets remain under their 200-day averages, the Hang Seng by 2.96% and Shanghai by 1.84%; the ASX 200 is 0.67% under its own.
Emerging Markets
| Index | Level | Day Chg % | Source |
|---|---|---|---|
| MSCI EM (EEM) | 67.71 | -2.01% | yfinance EEM |
| India Nifty 50 | 23,446.80 | +0.50% | yfinance ^NSEI |
| South Africa | 66.44 | -3.92% | yfinance EZA |
EEM and EZA are US-listed ETFs and reflect the 23 September NYSE close, so they carry the day's dollar move and the day's rates move, while the Nifty reflects its own 23 September close in Mumbai. EZA's 3.92% fall is the largest single-day move in the table, and the South African Reserve Bank is the main reason: the MPC raised the repo rate 25 bp to 7.25% unanimously, against a market looking for 7.00%, after surprising with a hold in July. The rand weakened past 16.40 per dollar even so, the 2035 government bond yield rose 13.5 bp to 8.72% and the JSE Top-40 fell 1.7% in local terms, which with the currency accounts for most of the dollar-denominated fall. Gold settling 1.33% lower and silver 2.35% lower added to it through the index's precious-metals miners, but it is the smaller part. EZA is 1.47% below its 50-day average and 4.09% below its 200-day, within a 52-week range of 60.27 to 81.76. EEM, at 2.63% above its 50-day and 5.39% below its 52-week high of 71.57, fell with the dollar rather than with any single market.
Index Valuations & Investment Risk
Valuation Table
| Index | Trailing P/E (live) | 50-day avg | 100-day avg | 200-day avg |
|---|---|---|---|---|
| S&P 500 | 24.8x | 25.9x | — | — |
| Nasdaq 100 | 30.2x | 30.4x | — | — |
| Euro STOXX 600 | 17.6x | 18.2x | — | — |
| CAC 40 | 16.6x | 17.4x | — | — |
| DAX | 18.0x | 18.7x | — | — |
| FTSE 100 | 15.3x | 17.6x | — | — |
| Nikkei 225 | 21.6x | 21.7x | — | — |
| MSCI EM | 14.4x | 16.2x | — | — |
Averages of the daily trailing P/E readings recorded since 1 May 2026 (n = 95); shown for reference only.
Investment Risk Assessment for ETF Investors
United States (S&P 500 / Nasdaq ETFs)
The S&P 500 at 24.8x trailing earnings (SPY) yields 4.03% on earnings, against a 10-year Treasury at 5.11% (US Treasury par curve, 23 September). The earnings yield gap is negative 1.08 pp: the settled Treasury pays a full point more in current yield than the index earns. Corrected for inflation the picture reverses, because the equity earnings behind that yield grow while a coupon does not: against the 2.76% real yield (US Treasury real curve, 23 September) the gap is positive 1.27 pp. The size of that correction, 2.35 pp, is larger than the gap itself and is the single most important caveat on the nominal figure. This describes today's trade-off between the two instruments and forecasts nothing about which will outperform.
The Nasdaq 100 at 30.2x earns 3.31%, a negative 1.80 pp gap to the nominal 10-year, and it is the index most exposed to what happened today: a 30x multiple is a long-duration asset, and its 0.85% fall against the Dow's 0.68% is that duration being repriced. The S&P 500 is 1.42% below its record and the Nasdaq 100 0.95% below its own, and both sit above their 50- and 200-day averages, so nothing in the price action suggests distress. The risk is concentration: the ten largest holdings, led by Nvidia, Apple and Microsoft, make up 46% of the Nasdaq 100 and 38% of the S&P 500, and they are the high-multiple stocks most exposed to a real yield of 2.76%, with a Fed that has told the market it is not finished. The 16 September dot plot had 16 of 18 participants expecting at least one further hike this year, and Governor Michael Barr said today that more tightening is likely needed. An investor buying the index here is accepting a negative current-income spread against Treasuries in exchange for growth that must now be discounted at a higher real rate.
Europe (STOXX 600 / CAC 40 / DAX ETFs)
The STOXX 600 at 17.6x earns 5.67%, a gap of positive 2.11 pp over the 10-year Bund at 3.56%, and positive 4.25 pp over the euro real 10-year of 1.42%. The DAX at 18.0x earns 5.55% (+1.99 pp over the Bund) and the CAC 40 at 16.6x earns 6.04%, but the CAC must be measured against its own government's cost of money: at an OAT yield of 4.644% the French gap is positive 1.39 pp, the narrowest in Europe and barely half the STOXX 600's. That is the cleanest way to see the French fiscal premium in equity terms. Europe trades at a 29% discount to the S&P 500 on trailing earnings (17.6x against 24.8x), a discount that widened today as the euro-area PMI improved.
Part of the transatlantic gap difference is simply the gap between US and euro policy and inflation paths rather than a difference in risk compensation, so the real-yield versions are the check: 1.27 pp for the US against 4.25 pp for the euro area. Europe's advantage survives the correction, and on this measure it is the wider of the two by a large margin. Today's data cuts both ways for the region: activity accelerating to a three-and-a-half-year high argues for the earnings, while input and output prices rising at their fastest in four months argues for an ECB that has hiked twice since June, most recently to 2.50% on 10 September, and a 2-year Bund up 7.8 bp on the day. The specific French risk is fiscal, not economic, and it is visible in a 108 bp OAT-Bund spread and an OAT now yielding more than a BTP.
On currency, a euro-based investor holding euro-quoted European funds has no FX effect on the quoted value of the holding, but real exposure remains inside the earnings: CAC 40 and STOXX 600 constituents are multinationals earning abroad, and a dollar up 0.47% today flatters their translated revenues. The exposure is smaller, slower and partly hedged by foreign cost bases, not absent.
Japan (Nikkei / TOPIX ETFs)
The Nikkei 225 at 21.6x (1321.T) earns 4.63%, against a 10-year JGB at 2.989%, a gap of positive 1.65 pp. Both legs are stale: Tokyo was closed for the whole of 21 to 23 September and the JGB quote is the 18 September close. The BOJ raised its policy rate to 1.25% on Friday 18 September, its second hike this year after 16 June's move from 0.75% to 1.00%, taking the rate to a 31-year high on a 7-2 vote with Asada and Sato dissenting; the new rate takes effect tomorrow, 24 September. The yen has weakened rather than strengthened through all of it, and USD/JPY at 158.34 tonight is back at the level that drew an official rate check on 21 September, with the government having already spent a record ¥15.4 trn defending the currency between 30 July and 26 August. For a EUR- or USD-based holder the currency decision remains the larger one: Tokyo reopens tomorrow facing three sessions of accumulated global news, a 5% US 10-year and a yen at the intervention zone. The governance reform programme, buybacks and cross-shareholding unwinds, remains the part of the case that does not depend on the yen.
Emerging Markets (MSCI EM ETFs)
MSCI EM at 14.4x is the cheapest market in the table, a 42% discount to the S&P 500, earning 6.92%. Today showed exactly what that discount pays for: a dollar up 0.47%, a US real yield settling at 2.76% and metals selling off produced a 2.01% fall in EEM, most of it during New York hours, after the Asian markets that make up the bulk of the index had already closed: Taiwan and Korea rose on the day in local terms while their US-listed funds fell 2 to 4%, so EEM's price ran ahead of its holdings. South Africa fell 3.92% on a hawkish surprise from its own central bank, and India rose 0.50% on its own domestic session. Emerging-market shares tend to fall when the dollar and US real yields rise: a stronger dollar weakens their currencies and raises the cost of their dollar debt, and a higher risk-free return in the US draws money away from riskier markets. Both rose today, and South Africa showed that an emerging market can be forced to raise its own rates into the same shock rather than cushion it. The China weight remains the structural question, with both mainland and Hong Kong indices below their 200-day averages, and the 14.4x multiple against a 16.2x 50-day reading shows the de-rating is recent.
Overall Risk Score: Moderate, with a clear regional split. The US is at high valuation risk and low margin of safety: a negative nominal earnings yield gap, a 24.8x multiple within 1.42% of a record, and a central bank signalling more tightening. Europe and emerging markets offer attractive relative valuation on both nominal and real measures, with the qualification that France carries an identifiable fiscal premium, and emerging markets remain exposed to a stronger dollar: for a euro investor the currency translation largely offsets, but the dollar debt and capital outflows that a strong dollar brings weigh on emerging-market companies whatever the investor's home currency. Credit and volatility markets are not corroborating any stress: the VIX at 14.21 and high yield at 268 bp both say complacency rather than fear.
US Economic Indicators (FRED - authoritative)
| Indicator | Current | Prior | Delta | Reference Date | FRED Series |
|---|---|---|---|---|---|
| CPI YoY % | 3.35% | 3.30% | +0.05 pp | Aug 2026 (prior Jul) | CPIAUCSL |
| Core CPI YoY % | 2.45% | 2.47% | -0.02 pp | Aug 2026 (prior Jul) | CPILFESL |
| Unemployment Rate | 4.1% | 4.1% | 0.0 pp | Aug 2026 (prior Jul) | UNRATE |
| Nonfarm Payrolls | +162k | +21k | +141k | Aug 2026 (prior Jul), monthly chg | PAYEMS |
| 10Y TIPS Real Yield | 2.76% | 2.63% | +0.13 pp | 23 Sep 2026 (prior 22 Sep) | DFII10 (US Treasury real curve) |
Note: FRED macro data is monthly and typically lags 4-6 weeks. Headline CPI at 3.35% is rising while core at 2.45% is not, which is the energy pass-through the bond market spent today pricing. The August payroll rebound to +162k from a revised +21k in July is the labour-market print behind the Fed's confidence. The real yield is from the US Treasury real curve, dated 23 September, with the prior from 22 September; its 13 bp rise in a single session is the mechanism behind the day's move in metals and in long-duration equity.
Other economic releases today (from web search):
| Indicator | Actual | Consensus | Prior | Reaction |
|---|---|---|---|---|
| Euro area composite PMI (flash, Sep) | 53.1 | — | 52.0 | Fastest in almost 3.5 years; France back to growth for the first time in 10 months, Germany fastest in nearly a year; new orders fastest since May 2022; input and output prices fastest in four months |
| Euro area manufacturing PMI (flash, Sep) | 52.7 | 52.6 | 52.7 | In line; output index 53.4, a 55-month high |
| US services PMI (flash, Sep) | 58.7 | 56.0 | 56.5 | Large upside surprise, highest in nearly five years; the day's main driver of the rates move |
| US manufacturing PMI (flash, Sep) | 57.0 | 53.6 | 53.9 | Large upside surprise |
| US composite PMI (flash, Sep) | 58.4 | — | 56.0 | Large upside surprise |
| API US crude stocks | +1.8 mn bbl | — | — | Crude build, with gasoline and distillate drawdowns; supportive of the oil rebound |
Fixed Income & Bond Analysis
Policy Rates
| Central Bank | Rate | Source |
|---|---|---|
| Fed Funds (upper) | 4.00% | FRED DFEDTARU (2026-09-23) |
| Fed Funds (lower) | 3.75% | FRED DFEDTARL (2026-09-23) |
| Effective FFR | 3.88% | FRED DFF (2026-09-21) |
| ECB Deposit Rate | 2.50% | FRED ECBDFR (2026-09-23) |
| BOJ Policy Rate | 1.25% | web search (raised 18 Sep 2026) |
| BOE Bank Rate | ~3.73% | FRED IUDSOIA (SONIA proxy, 2026-09-21) |
The Fed raised its target range by 25 bp to 3.75% to 4.00% on 16 September, its first increase since 2023. The ECB deposit rate has been 2.50% since 10 September, its second hike this year after 17 June's move to 2.25%. The BOJ's 1.25%, set on 18 September, is its second hike this year after 16 June's move from 0.75% to 1.00%, and takes effect tomorrow. Three of the four major central banks have therefore tightened within the last fortnight, and the gilt market prices a fourth, a 25 bp Bank of England hike in November.
Government Bond Yields
| Country | 2Y Yield | 10Y Yield | 30Y Yield | Day Chg (10Y) | Source |
|---|---|---|---|---|---|
| USA | 4.85% | 5.11% | 5.40% | +15.0 bp | US Treasury par curve (2026-09-23) |
| Germany | 3.29% | 3.56% | 3.85% | +10.6 bp | web |
| France | — | 4.64% | — | +13.7 bp | web |
| UK | 4.81% | 5.35% | 5.84% | +13.2 bp | web |
| Japan | — | 2.99% | — | +0.0 bp | web |
| Italy | — | 4.52% | — | +16.3 bp | web |
The USA row is Treasury's settled par curve for 23 September, with its day change against the 22 September curve (10Y 4.96%). European and UK figures are TradingEconomics quotes taken during the 23 September session, so they are intraday quotes while the US figure is a settlement. The Japanese 10-year is the 18 September close carried forward, Tokyo having been closed 21 to 23 September, so its day change describes that session and not today.
Yield Curve Spreads:
- 10Y-2Y spread: +26 bp (US Treasury par curve, 23 September): modestly positive, at the upper edge of what counts as flat and a long way from steep. The curve disinverted earlier this year and has stayed barely positive while the Fed tightened into it. Today's selloff was close to parallel across those two points, so a 15 bp move at the 10-year widened the spread by only 1 bp.
- 10Y-3M spread: +92 bp (US Treasury par curve, 23 September): positive and no longer signalling recession, which is the opposite of the reading this spread gave through the inversion. A bill yield of 4.19% against a 10-year of 5.11% is a market that expects policy to stay restrictive rather than to be cut, and the spread widened 12 bp today because the long end moved and the bill barely did.
The more interesting feature is at the very long end, where the 20-year at 5.45% yields 5 bp more than the 30-year at 5.40%. That small inversion has persisted for weeks and reflects the concentration of issuance and index demand at the 30-year point rather than any growth signal. The 3-month bill at 4.19% sits 31.5 bp above the 3.875% Fed funds midpoint, outside the 25 bp sanity band, which is the market pricing a further hike rather than a data problem.
OAT-Bund Spread: 108.5 bp (France 4.644% less Germany 3.559%, TradingEconomics, 23 September intraday), up from the 102.0 bp recorded on 22 September. The French 10-year has now moved above the Italian BTP at 4.524%, leaving France paying 12 bp more than Italy for ten-year money: the BTP-Bund spread, at 96.5 bp, is now narrower than France's, so Italy, the market's benchmark for a risky euro-area borrower since the 2010-12 debt crisis, borrows more cheaply than France. France also had the better data today, returning to growth for the first time in ten months, so this is a fiscal and political premium rather than a cyclical one.
Yield Curve Charts
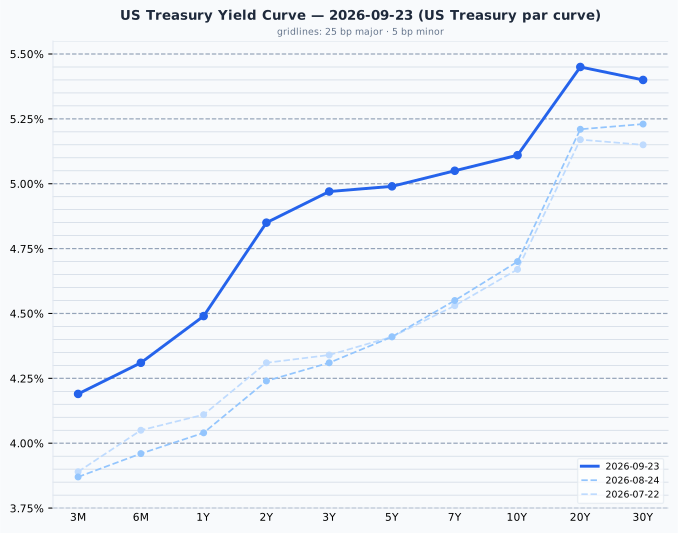
The curve is upward-sloping from the 3-month bill to the 20-year with a slight downward kink into the 30-year, and it is notably flat through the belly: 5-year at 4.99% and 7-year at 5.05% sit within 6 bp of each other. Against the 24 August curve the whole structure has shifted up and flattened hard, the 2-year up 61 bp and the 3-month up 32 bp as the Fed delivered and signalled more, while the 30-year rose 17 bp; the July curve sits lower again and almost parallel to August's, so essentially all of the last two months' repricing happened after mid-August.
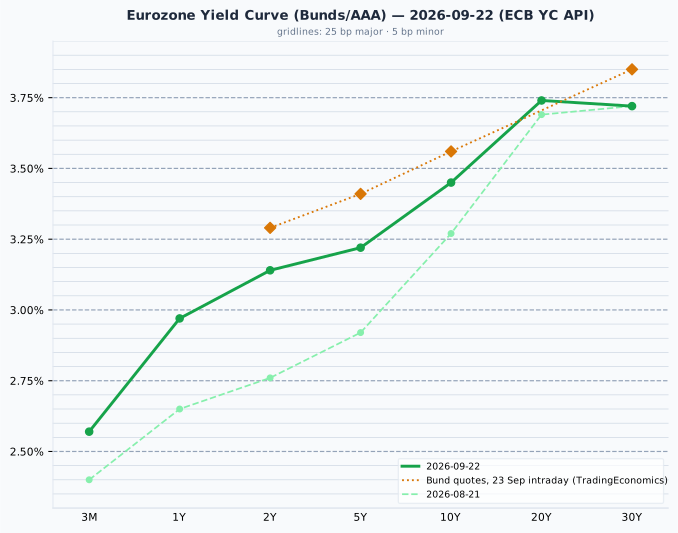
The euro AAA curve is cleanly upward-sloping to the 20-year and then flat to slightly inverted into the 30-year, mirroring the US shape at roughly 140 bp lower across the maturities. Since 21 August the front has done the moving here too, the 2-year up 37 bp and the 10-year up 18 bp while the 30-year is unchanged at 3.72%, a bear flattening driven by the ECB's 10 September hike and by pricing for a further move.
Today's Bund quotes sit above the plotted 22 September curve at every maturity, by between 10.7 bp at the 10-year and 19.3 bp at the 5-year, which is why the overlay appears. Part of that is genuine: the Bund sold off 8 to 13 bp today. Part is construction, because the curve is the ECB's fitted AAA euro-area curve and the quotes are on-the-run Bunds, which sit a few bp apart by design, so the 5-year gap is the only one clearly larger than both effects combined.
Credit Markets (from FRED, authoritative)
| Market | OAS | Obs. date | vs prior obs | Series ID |
|---|---|---|---|---|
| US Investment Grade | 77 bp | 2026-09-22 | 0 bp | BAMLC0A0CM |
| US High Yield | 268 bp | 2026-09-22 | +2 bp | BAMLH0A0HYM2 |
| Euro High Yield | 272 bp | 2026-09-22 | -1 bp | BAMLHE00EHYIOAS |
Change is 2026-09-22 vs 2026-09-21.
Credit spreads are the 22 September close; today's session is not in them yet. All three readings are historically tight: US investment grade at 77 bp is below the 80 to 150 bp normal band, and US high yield at 268 bp is below the 300 to 500 bp band that would count as normal, with euro high yield 4 bp wider than its US equivalent. Nothing here corroborates stress. The reading to take from it is that corporate borrowers are being asked for very little extra compensation at a moment when the risk-free rate they compete with has risen sharply, which compresses the relative attraction of credit rather than of the government bond.
Real Yields (US and Euro Area)
| Region | Nominal 10Y | Expected inflation | Real 10Y | How the real yield is obtained |
|---|---|---|---|---|
| United States | 5.11% | 2.35% (nominal − real, the residual) | 2.76% | Measured. TIPS trade, so the market quotes a real yield directly; expected inflation is the residual, the breakeven |
| Euro area | 3.45% | 2.04% (measured, ECB SPF 2026 Q3) | 1.42% | Constructed. No euro inflation-linked benchmark is published, so a survey expectation is subtracted from the nominal yield |
The two rows are built in opposite directions. The US measures the real yield and infers inflation; the euro area measures inflation and infers the real yield. Only the US figure, 2.76%, is a price anyone actually trades, so the euro 1.42% is the softer of the two and should be treated as such. Two mismatches follow from the construction: the US breakeven includes an inflation risk premium that a survey does not, and the SPF horizon is five years against the bond's ten.
Decomposing the 165.7 bp nominal gap between the two 10-year yields on these figures gives 31.3 bp of expected-inflation difference (2.35% against 2.04%) and 134.4 bp of real-rate difference (2.76% against 1.42%). The gap is overwhelmingly a difference in real rates, roughly four fifths of it, and not a difference in expected inflation. It widened by 15 bp today, and almost all of that came through the real leg rather than the breakeven, which is the same point the metals made. The US leg is dated 23 September and the euro leg 22 September, because the ECB publishes its curve a day in arrears; the euro nominal yield is that published curve and the expectation is a quarterly survey.
Why the US real-yield advantage is not a return a euro investor can capture
The 134 bp real-rate advantage in favour of US bonds is a structural feature of the two economies, reflecting higher US trend growth, euro-area excess savings, Bund scarcity and US fiscal supply. It is not a return a euro-based reader can capture. Hedging the currency removes it almost exactly, because the forward rate is set to eliminate the interest differential; unhedged, buying Treasuries for the yield is a bet on the dollar rather than a bond decision, and today's 0.47% dollar gain is the kind of move that dominates the carry in either direction. A real yield is real in its own currency: 2.76% means 2.76% above US inflation, which is not a real return for someone who spends euros. Read the gap as a statement about relative policy stance and growth expectations, and draw no portfolio conclusion from it.
Bond Portfolio Implications
On current income the answer is unusually clear for the US and unchanged for Europe. A 10-year Treasury settling at 5.11% pays more than the S&P 500 earns: the earnings yield gap is (1÷24.84) − 5.11% = negative 1.08 pp. For the euro area the sign is the other way, (1÷17.64) − 3.56% = positive 2.11 pp in favour of equities. So a dollar investor choosing between the two instruments today is being offered more contractual income by the bond, while a euro investor is not, and the difference between those two conclusions is mostly the 134 bp real-rate gap described above rather than anything about relative equity risk.
Two structural biases qualify the comparison whenever it carries weight. First, the gap ignores growth: a coupon is fixed for a decade while the earnings behind the equity yield grow roughly with inflation, so the nominal gap understates equities by approximately expected inflation. The real-yield version corrects this, and the size of the correction is the point of interest: 2.35 pp for the US, which flips the sign of the gap from negative 1.08 pp to positive 1.27 pp. Second, an equity holder does not receive the full earnings yield in cash; only the dividend and buyback portion arrives, the rest being retained. For the forward-looking valuation question, the earnings yield measured against its own history is the measure that carries predictive power, which this gap does not.
A 10 bp rise in yields is an ordinary day's move. At today's settled par yields it costs:
| Maturity | Yield | Modified duration | Loss for a 10 bp rise | Months of coupon lost |
|---|---|---|---|---|
| 2-year | 4.85% | 1.9 | 0.19% | 0.5 |
| 10-year | 5.11% | 7.75 | 0.77% | 1.8 |
| 30-year | 5.40% | 14.77 | 1.46% | 3.2 |
Today's 15 bp rise at the 10-year cost a holder about 1.2%, nearly three months of coupon. That asymmetry is the trade-off in the current environment: the short end now pays 4.85% while risking about 0.19% per 10 bp, which is a high coupon for very little duration, while the 30-year pays 5.40% for nearly eight times the sensitivity in a market where the 20-year already yields more. Unless the view is specifically that policy rates fall materially from here, the front and belly of the curve are being paid nearly as well as the long end for a fraction of the risk, and today's 15 bp move at the 10-year is a reminder of how quickly the long end gives back months of carry.
Currencies & Commodities
Currencies (all from live yfinance quotes):
| Pair | Rate | Day chg % | Source |
|---|---|---|---|
| EUR/USD | 1.1393 | -0.52% | yfinance (17:48 CEST) |
| USD Index (DXY, ICE) | 101.07 | +0.47% | yfinance (17:38 CEST) |
| USD/JPY | 158.34 | +0.65% | yfinance (17:48 CEST) |
| GBP/USD | 1.3252 | -0.70% | yfinance (17:48 CEST) |
| USD/CHF | 0.8251 | +0.67% | yfinance (17:48 CEST) |
FX quotes as of 17:48 CEST; day change vs the previous 17:00 ET close.
The dollar rose against all four counterparts, which is what a US rates shock does when it comes from strong data rather than from stress. Sterling was the weakest despite gilt yields rising 13 bp, a combination that says the UK move was about inflation and supply rather than about growth. USD/JPY at 158.34 is the level that drew an official rate check on 21 September, and the yen is weaker than it was before the BOJ hiked. The ICE dollar index at 101.07 is a different index from FRED's broad trade-weighted measure, which sits near 119.5, so the two are not comparable.
Commodities (all from front-month futures via yfinance):
| Commodity | Price | Day Chg % | Ticker | Source |
|---|---|---|---|---|
| Brent Crude | 98.12 | +2.84% | BZ=F | yfinance |
| WTI Crude | 92.16 | +1.81% | CL=F | yfinance |
| Gold ($/oz) | 4,318.40 | -1.33% | GC=F | yfinance |
| Silver ($/oz) | 64.964 | -2.35% | SI=F | yfinance |
| Copper ($/lb) | 6.7535 | -1.21% | HG=F | yfinance |
| Nat Gas ($/MMBtu) | 3.153 | +1.16% | NG=F | yfinance |
Day changes are settlement (23 September) vs the prior session's settlement (22 September), the market convention for a completed session. WTI is the row that moved most between the two bases: it last traded at 92.63 but settled at 92.16, so a last trade measured against a settlement would show +2.33% where the settled day change is +1.81%.
A note on which contracts these are. The Brent row is the December contract (BZZ26), expiring 2 November, while press reports of Brent "above $101" today refer to the more prompt contract. The gap is the curve, and a backwardation of that size is consistent with a market pricing near-term supply disruption, which is precisely what the Saudi pipeline restart and the contested Strait of Hormuz are about. Yesterday's briefing quoted the November Brent contract (BZX26) at 99.25, so the two levels are not comparable. WTI is the November contract (CLX26), expiring 20 October, and is the prompt WTI; natural gas is also the November contract (NGX26). Each day change compares the same contract with its own previous settlement, so none is distorted by a switch to a later contract month.
Energy was the day's only rising asset class, Brent and WTI both up on the Saudi East-West pipeline restart, productive US-Iran talks and an API report showing gasoline and distillate drawdowns against a crude build. Both remain well within their 52-week ranges, Brent between 58.72 and 126.10 and WTI between 54.98 and 119.48, Brent 22.2% below its 52-week high and WTI 22.9% below its own. Their all-time highs date from July 2008 and describe a different market, so no drawdown framing applies.
The metals went the other way, and the reason is the same real yield that moved bonds. Gold settled at $4,318.40, 22.7% below its all-time high of $5,586.20, set on 29 January 2026, a record that is also its 52-week high. Silver settled at $64.96, 46.4% below its all-time high of $121.30, also set on 29 January 2026, within a 52-week range of 43.70 to 121.30. Both are a long way from their records and neither is near a high; the January peak and the subsequent decline track the rise in real yields through this year. Copper is the exception and the one metal worth watching: it settled at $6.7535, 1.1% below its record settlement of $6.83, set the day before on 22 September, after a 1.21% fall. That is still at the top of its range while gold sits 23% below its own record, which is an industrial-demand signal rather than a monetary one, and it fits the PMI data rather than contradicting it.
Crypto: no moves above the 3% reporting threshold today; omitted.
Sector & Theme Highlights
Energy was the only US sector to rise, tracking Brent's near 3% rise, and it was enough to make the FTSE 100 the best of the European indices, though the closing auction left even the FTSE marginally lower and the region without a gain. The losses were concentrated where duration is longest: the Nasdaq 100's 0.85% fall against the Dow's 0.68% is the ordering a rates shock produces, and press reporting put utilities and consumer discretionary each down more than 1%, with communication services down 0.85%, the classic rate-sensitive and bond-proxy complex. South Africa was the worst single market, down 3.92% in dollars, though there the central bank's hawkish surprise and the rand did more of the work than the 1.33% fall in gold.
Four themes are worth carrying forward. The rates-and-multiples question is now acute: a 30x Nasdaq multiple and a 2.76% real yield are in direct tension, and today was the market testing it rather than resolving it. Energy as an inflation input has returned to the centre, with a Middle East supply disruption feeding a headline CPI already at 3.35% while core sits at 2.45%, which is the split that determines whether central banks look through it. Synchronised tightening is the new regime: the Fed, the ECB and the BOJ have all raised rates within a fortnight, South Africa joined them today, and the Bank of England is priced to follow in November, which removes the divergence trades that worked earlier this year and extends the pressure to emerging markets that import their fuel. Industrial versus monetary metals have separated decisively, copper at the top of its range and gold 23% below its record, which argues the real economy is stronger than the financial economy's discount rate is comfortable with.
Top Stories (Global)
- The US 10-year yield settled above 5%, at 5.11% on the Treasury par curve, up 15.0 bp and reported as the highest since July 2007. The 30-year settled at 5.40% and the 5-year at 4.99%, the latter up 16 bp, so the move was concentrated in the belly and long end rather than in policy expectations alone: the 3-month bill rose just 3 bp.
- Flash PMIs beat sharply on both sides of the Atlantic. US services printed 58.7 against a 56.0 consensus, its best in nearly five years, with manufacturing at 57.0 against 53.6 expected and the composite at 58.4; S&P Global reads the survey as consistent with annualised growth of around 5%. The demand is domestic: goods exports fell and services exports rose only modestly, while hiring was the strongest since June 2022 and backlogs grew at the fastest pace since May 2022, so orders are arriving faster than firms can fill them. Supplier delays were the most widespread since July 2022, but delivery times make up only 15% of the manufacturing index and play no part in the services or composite readings, so the bottlenecks show up in the price gauges more than in the growth figures. Faster inventory building in US factories fits restocking after customers' stocks ran low as much as buying ahead of price rises. The euro area composite reached 53.1 from 52.0, the fastest expansion in almost three and a half years and a third straight month of growth, with new orders the strongest since May 2022 and export orders rising for a second month after 53 months of decline. European firms bought only modestly more inputs, enough to end a run of inventory declines dating from February 2023, so the improvement there reflects activity rather than stock building.
- Brent rebounded after five consecutive declines, as Saudi Arabia prepared to restart exports through its East-West pipeline, a route that bypasses the contested Strait of Hormuz, and as US-Iran talks were described as productive following Trump's UN address. API data showed a 1.8 mn barrel crude build with gasoline and distillate drawdowns.
- Fed Governor Michael Barr said further tightening is likely needed to return inflation to target, reinforcing a 16 September dot plot in which 16 of 18 participants expected at least one more hike this year.
- France's 10-year OAT rose above Italy's BTP, at 4.644% against 4.524%, taking the OAT-Bund spread to roughly 108 bp from 104 bp yesterday. France reported better activity data than Italy on the same day, so the premium is fiscal and political rather than cyclical.
- The euro-area data carried an inflation warning inside the good news: input costs and output prices rose at their fastest pace in four months, and new orders at their fastest since May 2022, while business confidence stayed subdued.
- Tokyo was closed for the whole of 21 to 23 September for Japan's autumn holidays, leaving the Nikkei and JGB quotes at their 18 September levels. The BOJ's 18 September hike to 1.25%, a 31-year high passed on a 7-2 vote, takes effect tomorrow, with the yen at 158.34 back in the zone that drew an official rate check.
- The South African Reserve Bank raised the repo rate 25 bp to 7.25%, a unanimous decision against a market looking for 7.00% and a reversal of the hold that surprised in July, taking the prime rate to 10.75% from 25 September. It cited fuel prices and geopolitical risk pushing inflation, at 4.4%, further above the 3% target. The rand still weakened past 16.40 per dollar, the 2035 bond yield rose 13.5 bp to 8.72%, the JSE Top-40 fell 1.7% and the dollar-denominated ETF fell 3.92%.
- Copper settled at a record $6.83/lb on 22 September and holds within 1.1% of it after settling at $6.7535 today, an industrial-demand signal that stands in sharp contrast to gold, 22.7% below its own January record.
Looking Ahead
Central banks - The BOJ's new 1.25% policy rate takes effect tomorrow, Thursday 24 September, and Tokyo reopens to three sessions of accumulated global news. - Bank of England pricing now carries a 25 bp hike for November, so every UK inflation and activity print between now and then is a repricing risk for a gilt market already at 5.35% on the 10-year. - Further Fed commentary is the near-term catalyst after Governor Barr's remarks today, with the dot plot pointing to at least one more hike this year.
Economic releases - US final Q2 GDP, durable goods orders and the PCE price index are the week's remaining US data, and PCE matters most given headline CPI at 3.35% against core at 2.45%. - Euro-area national inflation prints and the flash HICP estimate follow the PMI data, and today's four-month high in input and output prices raises the stakes on them. - Weekly EIA inventory data will test the API figures that helped lift crude today.
Markets and geopolitics - Middle East supply developments are the dominant variable for energy and therefore for the inflation path: the Saudi East-West pipeline restart and the status of the Strait of Hormuz both feed directly into Brent. - The US-Iran talks flagged as productive today are the other side of the same question. - French fiscal and budget news is the specific European risk, with the OAT now yielding more than the BTP.
Market closures - Thursday 24 September: Korea closed (Chuseok). - Friday 25 September: Korea closed (Chuseok). - Saturday 26 September: Korea closed (Chuseok), a weekend date. - No Indian holiday data is available here, so Indian closures are not checked.
Beyond the next five days, Canada is closed on 30 September (National Day for Truth and Reconciliation), Germany on 3 October (German Unity Day) and Korea again on 5 October (National Foundation Day) and 9 October (Hangul Day). Japan's next holiday falls after that window; Tokyo reopens tomorrow.
Special Analysis: Which Stocks Are Rate-Sensitive When Yields Rise
Added 24 September 2026. Textbook finance says expensive growth stocks should suffer most when bond yields rise, and on the days of this summer's climb in the US 10-year yield, from 4.38% on 26 June to 5.11% on 23 September, they did: speculative growth, homebuilders and technology fell furthest per basis point. Over the whole period, though, technology and speculative growth rose while utilities and homebuilders fell by double digits, because a stock's sensitivity to rates is one force among several, and company-specific profit growth has been the larger one.
Three ways a higher yield reaches a share price
The first channel is competition for income. Utilities, telecoms, real estate investment trusts and consumer staples are held partly for their steady dividends, which makes them substitutes for bonds, hence the label "bond proxies". When a risk-free Treasury pays more, the same dividend is worth less. Verizon now yields 6.08% in dividends against a 10-year Treasury at 5.11%; the utilities sector fund yields 2.83%, less than the three-month bill at 4.19%. An investor who bought utilities for income can now get more from a government bill with no equity risk at all.
The second channel is borrowing cost. Housebuilders sell to buyers who need a mortgage priced off the 10-year; home improvement retailers depend on the same housing turnover; consumer lenders and car sellers depend on credit their customers can afford; and small companies borrow more of their funding at floating rates than large ones do. A higher yield therefore hits their revenues or their interest bills directly, whatever their valuation.
The third channel is duration, the same concept that governs bond prices. A company whose profits lie mostly in the distant future is like a long-dated bond: each extra point of discount rate is applied to many years of waiting, so its present value falls further. High price-to-earnings multiples are the market's way of saying that most of a company's value lies in profits not yet earned.
Why a 30x stock should suffer more than a 15x stock
The simplest valuation formula makes the third channel concrete. If a company pays out all its earnings, grows them at a constant rate g for ever, and investors require a return r, its price-to-earnings ratio is approximately (1÷(r − g)). A stock on 30 times earnings therefore implies r − g of 3.3%; a stock on 15 times implies 6.7%. Add one percentage point to r, holding growth fixed, and the first becomes (1÷4.3%), about 23.1 times, a fall of 23%. The second becomes (1÷7.7%), about 13.0 times, a fall of 13%. The same rate move costs the expensive stock nearly twice as much, because the gap between required return and growth is thinner and one point is a larger share of it.
The assumptions matter, and all of them are generous to the theory: full payout of earnings, a single growth rate that never changes, and a rate rise that passes one-for-one into the required return while leaving growth untouched. The last is the one that fails most often in practice. The 23 September rise came from flash purchasing managers' surveys showing US services activity at its strongest in nearly five years, and news that raises the discount rate by signalling a stronger economy also raises expected profits. On the formula, to a first approximation, the S&P 500 at 24.8 times earnings should lose about 2.5% for every 10 bp on its discount rate; the measurement below finds it lost 0.78%.
What the market actually did
To measure sensitivity, each fund's daily return was regressed on the daily change in the 10-year yield over the 61 trading days from 26 June, the low of the current rise, to 23 September. Over that period the 10-year rose 73 bp, and 58 bp of it came through the real yield (the inflation-protected yield, from 2.18% to 2.76%), with only 15 bp from the breakeven, the market's implied inflation rate. From 25 August, when the final leg began at 4.64%, the rise was 47 bp, of which 44 bp was real.
| Sector or segment (fund) | Per +10 bp on the 10-year | Real-yield leg, per +10 bp | Breakeven leg, per +10 bp | Total return 26 Jun–23 Sep | Of which rate-implied | 23 Sep |
|---|---|---|---|---|---|---|
| Speculative growth (ARKK) | −2.69% | −2.94% | −1.96% | +14.9% | −19.6% | −2.10% |
| Homebuilders (ITB) | −2.31% | −1.42% | −4.96% | −14.6% | −16.9% | −2.41% |
| Technology (XLK) | −1.27% | −1.27% | −1.26% | +8.0% | −9.2% | −0.47% |
| Nasdaq 100 (QQQ) | −1.16% | −1.14% | −1.22% | +5.0% | −8.5% | −0.84% |
| Small caps (IWM) | −1.11% | −0.93% | −1.63% | −5.7% | −8.1% | −1.84% |
| Consumer discretionary (XLY) | −0.99% | −0.78% | −1.59% | −3.0% | −7.2% | −1.50% |
| Materials (XLB) | −0.85% | −0.59% | −1.61% | −2.1% | −6.2% | −0.49% |
| Communication services (XLC) | −0.81% | −0.73% | −1.04% | +6.4% | −5.9% | −0.85% |
| S&P 500 (SPY) | −0.78% | −0.71% | −0.99% | +5.6% | −5.7% | −0.72% |
| Real estate (XLRE) | −0.74% | −0.67% | −0.94% | −6.7% | −5.4% | −1.55% |
| Utilities (XLU) | −0.61% | −0.76% | −0.17% | −13.3% | −4.5% | −1.91% |
| Industrials (XLI) | −0.55% | −0.15% | −1.73% | −5.9% | −4.0% | −0.11% |
| Financials (XLF) | −0.52% | −0.25% | −1.31% | +2.2% | −3.8% | −0.47% |
| Health care (XLV) | −0.50% | −0.41% | −0.78% | +5.7% | −3.7% | −0.65% |
| Consumer staples (XLP) | −0.38% | −0.13% | −1.13% | −2.1% | −2.8% | −0.34% |
| Energy (XLE) | +1.38% | +0.75% | +3.26% | +16.6% | +10.1% | +0.96% |
Daily closes with dividends added back on their ex-dates; 10-year nominal and real yields from the Treasury curves via FRED, 23 September from the settled Treasury curve. "Per +10 bp" is the regression slope scaled to a 10 bp move; the two legs come from one regression on both components together. "Rate-implied" is that slope times the 73 bp rise, an approximation. Typical standard errors are 0.2 to 0.6 points on the first column and 0.4 to 1.2 points on the breakeven leg, which moved too little over the period to be measured precisely.
On the days yields rose, the ordering is close to what the theory predicts. Speculative growth, whose holdings lean toward companies with little current profit and therefore most of their value in the future, fell 2.7% per 10 bp, more than three times the S&P 500. Homebuilders, which combine the borrowing-cost channel with cyclical exposure, were second. Technology and the Nasdaq 100 fell about half as much again as the broad index, and consumer staples, health care and financials fell least. Rates explain a limited share of any fund's daily moves: about a third for small caps and homebuilders, a quarter for the S&P 500, a tenth for technology and utilities.
Why the most rate-sensitive stocks rose anyway
The fifth and sixth columns hold the answer to the obvious puzzle. The regression says a 73 bp rise should have cost technology about 9% and speculative growth about 20%; instead technology gained 8.0% and speculative growth 14.9%. The gap, some 17 and 35 points, is everything else that happened to those companies, and it was positive. The same shows up in individual stocks since 15 September, the day before the Fed raised rates 25 bp, its first increase since 2023: with the 10-year up 11 bp to 5.11% and the real yield up 14 bp to 2.76%, Nvidia rose 6.3%, Apple 1.7% and Microsoft 0.7%, while Verizon fell 9.6%. Sensitivity is a "holding everything else equal" quantity, and for these companies everything else was not equal: Nvidia's latest quarterly earnings were 128% higher than a year earlier on Yahoo's figures, growth large enough to swamp a discount-rate effect of a few percent.
The formula also overstates how long-dated the largest technology companies are. Its logic applies most cleanly to a company whose profits are all in the future. Nvidia earns a 64% net margin, holds $62.5bn of cash against $38.9bn of debt, and trades on 28.9 times its earnings of the past twelve months but 14.4 times analysts' forecast for the coming year, because so much of its profit is arriving now rather than in the distant future. A company that funds itself from its own cash flow does not need the bond market, and a higher rate raises the interest it earns on its cash. Verizon is the opposite case despite a low 12.1 times trailing earnings: $194bn of debt against $1.8bn of cash, a dividend competing directly with Treasuries, and latest quarterly earnings 22% lower than a year earlier. Rates alone cannot account for a fall that size, but a low multiple did not protect it, because two of the three channels, income competition and borrowing cost, run through its balance sheet rather than its valuation.
The bond proxies show the reverse gap. Utilities' measured sensitivity implies a loss of 4.5% over the period, yet they fell 13.3%, the second-worst in the table after homebuilders. Nearly two thirds of that decline is not explained by the daily yield changes at all. One reading is that investors re-rated income sectors on the level of rates, a bill at 4.19% against a 2.83% dividend yield, rather than day by day on each move.
Real yields, breakevens and oil
Theory adds a refinement: a rise in real yields should hurt long-duration stocks more than a rise in inflation expectations, because inflation also lifts the nominal revenues a company collects. The measurement supports this for speculative growth, which fell 2.9% per 10 bp of real yield against 2.0% per 10 bp of breakeven, but not clearly for technology, where the two legs are equal. The breakeven leg is dominated by something else: daily breakeven changes correlated 0.66 with the daily move in crude oil over the period, against 0.21 for the real yield. That is why energy shows a sensitivity of +3.3% per 10 bp of breakeven, and why homebuilders, industrials and consumer discretionary show large negative ones: for them, a rising breakeven is mostly a rising fuel and input bill. Since 94% of the rise from 25 August came through the real yield, the leg that matters for the current episode is the real one.
Banks, energy and the Dow
Banks are supposed to benefit from higher rates because they can charge more on loans than they pay on deposits, widening their net interest margin, the difference between the two. The table shows financials with one of the smallest sensitivities, 0.25% per 10 bp of real yield. But a margin benefit arrives over quarters, while two costs can arrive at once: bonds the banks hold lose market value, and borrowers at higher rates default more. From 25 August financials fell 6.1%, while their measured sensitivity accounts for about 1 point of that. Goldman Sachs fell 4.1%, American Express 6.9%, Travelers 4.7% and JPMorgan 4.2% from 15 to 23 September.
Those four mattered more to the Dow Jones Industrial Average than their weights in any other index would suggest, because the Dow is price-weighted: a $1 move in any member moves the index by the same number of points, so Goldman at $936 counts about twenty times as much as Verizon at $47. Their share prices fell by a combined $95, which accounts for roughly 580 of the Dow's 582-point decline over those six sessions, with Goldman alone worth about 245 points; the other 26 members netted to almost nothing. The S&P 500, weighted by company size, rose 1.6% over the same period.
Energy is the one sector with a positive sensitivity, +1.4% per 10 bp, and it earned 16.6% over the period. The link most likely runs from oil to yields rather than from yields to energy: oil price rises lift inflation expectations and producers' revenues together, which is why the correlation shows up so strongly in the breakeven leg.
What it means for this briefing's readers
A 10-year yield at 5.11% is a headwind for every sector but energy, and the measured ordering is the one to keep in mind for the next move: speculative growth, homebuilders and small caps first, technology next, staples and health care least. On 23 September itself, technology fell 0.47% against the 1.9% its measured sensitivity would suggest for a 15 bp rise, while utilities fell 1.91%, about twice the 0.9% theirs would suggest. The day repeated the summer's pattern: on the days yields rise, a company's multiple predicts roughly how far it falls, but over weeks its profit growth and its balance sheet decide whether it ends lower.