2026 08 03
Global Financial Briefing — Monday, August 3, 2026
Americas index levels, commodities and day changes reflect the 3 August closing print. Fixed income, FX and macro figures are dated inline.
Market Overview
Global markets split sharply along geographic lines today. The Americas and Europe were broadly risk-on, and the US session strengthened into the close: Big Tech earnings carried the Nasdaq 100 to a 1.78% gain, the S&P 500 closed up 1.48% at 7,600.50 — within 0.27% of its all-time high — and the Dow Jones finished at a record close, while the DAX touched a fresh record in Europe. Sentiment was helped by falling oil prices after President Trump said he had called off a strike on Iran in favour of negotiating a deal to reopen the Strait of Hormuz — WTI settled down 5.11% and Brent down 4.73%, easing an energy-cost overhang for equities.
Asia-Pacific told a very different story. South Korea's KOSPI closed down 5.13% — a real, corroborated move, not a data artifact — as the unwind of an AI/semiconductor-driven rally that peaked in June continues; the index is now roughly a third below that peak, with Samsung Electronics and SK Hynix both down close to 9% on the session. The sell-off has spread caution across the region, weighing on Hang Seng and Shanghai even as the correction is concentrated in Korean chipmakers. Japan's Nikkei 225 slipped nearly 1% following the Bank of Japan's decision to hold its policy rate at 1.0% while flagging that core inflation may run "clearly above" its 2% target in the back half of the fiscal year.
Fixed income sent a mixed signal: US Treasury yields ticked higher across the curve (10Y at 4.68%, FRED DGS10) even as the curve steepened modestly (10Y-2Y spread +47bps) and credit spreads stayed historically tight. The VIX sits at 15.99 (FRED VIXCLS, 2026-07-31) — moderate, just above the low/complacent (<15) threshold — consistent with still-confident risk appetite in the US even as a genuine correction plays out in Korean equities. Equity valuations remain a real point of tension: the S&P 500's earnings yield sits below the 10-year Treasury yield (a negative equity risk premium), yet the index closed within 0.27% of its record — a divergence worth watching heading into a heavy week of earnings and Friday's jobs report.
Global Indices Snapshot
Americas
Americas data reflects the 3 Aug close.
| Index | Level | Day Chg | Day Chg % | Source |
|---|---|---|---|---|
| S&P 500 | 7,600.50 | +110.78 | +1.48% | yfinance ^GSPC |
| Nasdaq 100 | 28,776.80 | +502.61 | +1.78% | yfinance ^NDX |
| Dow Jones | 53,178.41 | +693.38 | +1.32% | yfinance ^DJI |
| Brazil IBOV | 178,000.23 | +1.23 | +0.00% | yfinance ^BVSP |
Cross-checked: FRED SP500 reports 7,600.50 for 2026-08-03, matching the yfinance ^GSPC close exactly.
All three US benchmarks strengthened into the close, each finishing above its midday level. The S&P 500 ended within 0.27% of its all-time high of 7,620.90 — at/near record highs. The Dow Jones closed at a record high per market reporting; its 53,178.41 close sits 0.21% below the 53,289.30 intraday all-time high, which is the level this briefing's ATH figures are measured against. The Nasdaq 100, despite the day's largest gain, remains 6.45% below its 30,762.20 record. Brazil's IBOV reversed a midday loss to finish essentially unchanged (+1.23 points), and is 10.7% below its all-time high of 199,355.00.
Europe
European data reflects today's close (3 Aug).
| Index | Level | Day Chg | Day Chg % | Source |
|---|---|---|---|---|
| Euro STOXX 600 | 652.09 | +2.90 | +0.45% | yfinance ^STOXX |
| CAC 40 | 8,613.82 | +104.18 | +1.22% | yfinance ^FCHI |
| DAX | 26,001.31 | +372.07 | +1.45% | yfinance ^GDAXI |
| FTSE 100 | 10,857.70 | -10.35 | -0.10% | yfinance ^FTSE |
| SMI (Swiss) | 14,371.77 | +25.63 | +0.18% | yfinance ^SSMI |
DAX closed at a fresh all-time high (26,001.31, edging past its prior record of 25,900.10). CAC 40 (-0.33% from ATH) and Euro STOXX 50 (-0.08% from ATH) are also within a whisker of records. FTSE 100 was the region's laggard, essentially flat on the day.
Asia-Pacific
Asia-Pacific data reflects today's close (3 Aug) in each local timezone.
| Index | Level | Day Chg | Day Chg % | Source |
|---|---|---|---|---|
| Nikkei 225 | 63,754.90 | -607.12 | -0.94% | yfinance ^N225 |
| Hang Seng | 26,009.40 | +124.97 | +0.48% | yfinance ^HSI |
| Shanghai Comp | 3,809.66 | -22.60 | -0.59% | yfinance 000001.SS |
| ASX 200 | 9,019.30 | +42.50 | +0.47% | yfinance ^AXJO |
| Kospi (Korea) | 6,257.45 | -338.00 | -5.12% | yfinance ^KS11 |
Kospi's decline is confirmed by independent news reporting (Samsung -8.76%, SK Hynix -8.79%) — it is now ~33% below its June peak, consistent with roughly $2 trillion in market value erased and reported ~$13bn in foreign outflows during July.
Emerging Markets
EEM and EZA are NYSE-listed and reflect the 3 Aug US close; ^NSEI reflects the 3 Aug Mumbai close.
| Index | Level | Day Chg % | Source |
|---|---|---|---|
| MSCI EM (EEM) | 64.32 | +0.36% | yfinance EEM |
| India Nifty 50 | 24,774.30 | +1.60% | yfinance ^NSEI |
| South Africa | 64.33 | +1.12% | yfinance EZA |
EEM reversed its midday loss to close higher: down 0.20% at midday, it finished up 0.36% on the day, in line with the broader US risk-on close.
Index Valuations & Investment Risk
Valuation Table
| Index | Trailing P/E (live) | Hist avg trailing P/E (†) | Premium/discount |
|---|---|---|---|
| S&P 500 | 27.20x | ~16-18x | +60.0% |
| Nasdaq 100 | 30.98x | ~25-30x | +12.6% |
| Euro STOXX 600 | 18.86x | ~15-17x | +17.9% |
| CAC 40 | 18.11x | ~14-16x | +20.7% |
| DAX | 19.01x | ~15-17x | +18.8% |
| FTSE 100 | 18.13x | ~13-15x | +29.5% |
| Nikkei 225 | 20.66x | ~20-22x | -1.6% |
| MSCI EM | 16.48x | ~13-15x | +17.7% |
(†) Hist avg trailing P/E: static long-run reference constants. Live trailing P/E sourced from yfinance trailingPE on ETF proxies (SPY, QQQ, EXSA.DE, CAC.PA, EXS1.DE, ISF.L, 1321.T, EEM). Bold = more than 20% above historical average.
Investment Risk Assessment for ETF Investors
United States (S&P 500 / Nasdaq ETFs) SPY's trailing P/E of 27.20x is 60% above its 16-18x historical average — historically stretched by this measure, and the highest premium of any region covered here. Earnings yield is 1÷27.20 = 3.68%, versus the 10-year Treasury yield of 4.68% (FRED DGS10) — a negative equity risk premium of about -1.0%, meaning bonds now yield more than the S&P 500's trailing earnings. QQQ's premium is smaller (+12.6%) but its ERP is more negative still (-1.45%) given its higher P/E. The S&P 500 closed within 0.27% of its all-time high of 7,620.90 and well above its 50-day (7,471.51) and 200-day (7,024.11) moving averages; the Nasdaq 100 closed above its 200-day average (26,508.73) but still below its 50-day (29,389.66), and remains 6.45% under its 30,762.20 record — so the "at record highs" framing applies to the S&P 500, not to both. Either way the valuation gap persists at or near index highs — a genuine tension: momentum and Big Tech earnings are currently overriding valuation concerns, but it leaves less margin of safety if growth or rate expectations disappoint. The 10Y TIPS real yield (FRED DFII10) at 2.41% is itself elevated by historical standards, adding to the discount-rate headwind for richly-valued growth stocks. Concentration in mega-cap tech (reflected in Nasdaq 100's premium) remains the key single-name risk.
Europe (STOXX 600 / CAC 40 / DAX ETFs) European valuations are elevated but less stretched than the US: STOXX 600 at 18.86x (+17.9% vs. historical average), DAX at 19.01x (+18.8%), CAC 40 at 18.11x (+20.7%, crossing the "historically stretched" threshold), all still trading at meaningful discounts to the S&P 500's 27.20x. Using the ECB AAA euro-area 10Y yield (3.23%, ECB YC API) as a Bund proxy, EUR earnings yields comfortably clear the risk-free rate: STOXX 600 ERP ≈ +2.07%, CAC 40 ≈ +2.30%, DAX ≈ +2.03% — all solidly positive, a more favorable equity-vs-bond trade-off than in the US. DAX's fresh all-time high and CAC 40's proximity to its own record underline that European momentum is real, not just relative-value optics. Euro High Yield OAS (FRED BAMLHE00EHYIOAS) at 265bps is historically tight, signalling credit markets are not pricing meaningful European stress. Currency risk for non-EUR investors and French political/fiscal uncertainty (OAT-Bund spread data is not available here: the ECB AAA curve does not carry country-level French/Italian yields) remain the main watch items.
United Kingdom FTSE 100 carries the widest valuation premium in this briefing at +29.5% (18.13x vs. ~13-15x historical average), yet its earnings yield (5.52%) still clears the UK 10Y Gilt yield (4.98%, web search) for an ERP of about +0.54% — thin, but positive. The FTSE's heavy weighting toward financials, energy and miners, rather than richly-priced growth names, explains the gap between its elevated P/E-versus-history and its still-reasonable ERP.
Japan (Nikkei / TOPIX ETFs) Nikkei 225's 20.66x trailing P/E is essentially in line with its 20-22x historical range (-1.6%), the most fairly-valued major index in this briefing. Against Japan's 10Y JGB yield (~2.8%, web search, easing today after the BOJ held its policy rate at 1.0%), the earnings yield of 4.84% implies an ERP of roughly +2.04%. The BOJ's warning that core inflation could run "clearly above" its 2% target into H2 FY2026 is the key policy risk — a faster tightening path would pressure both JGB yields and equity valuations, and JPY moves remain a material consideration for unhedged holders (USD/JPY 156.51, web search).
Emerging Markets (MSCI EM ETFs) EEM's 16.48x trailing P/E is a modest 17.7% premium to its 13-15x historical range, and its 6.07% earnings yield clears the US 10Y by roughly 1.39 percentage points. That said, this briefing's EM read is dominated by South Korea's ongoing correction — KOSPI is down ~33% from its June peak on an unwind of AI/semiconductor-driven gains, with regulators now considering curbs on leveraged ETF exposure. That is a country-specific, sector-concentrated shock (Samsung, SK Hynix) rather than a broad EM re-rating, but it is a reminder that EM index-level valuation comfort can mask sharp single-country drawdowns.
Overall Risk Score (qualitative, not financial advice): - US large-cap / Nasdaq: High valuation risk / low margin of safety — negative ERP at record-adjacent levels. - Europe (STOXX 600 / DAX / CAC 40): Moderate-to-elevated valuation, but positive ERP — better relative value than the US. - UK / Japan: Moderate — fair value (Japan) to elevated-but-supported (UK). - EM / Korea specifically: Attractive index-level relative valuation, but elevated single-country/sector risk currently playing out.
Disclaimer: This is financial information, not personalised investment advice. Past valuations do not guarantee future returns. Consult a financial advisor before investing.
US Economic Indicators (FRED - authoritative)
| Indicator | Current | Prior | Delta | Reference Date | FRED Series |
|---|---|---|---|---|---|
| CPI YoY % | 3.46% | 4.17% | -0.71pp | 2026-06 | CPIAUCSL |
| Core CPI YoY % | 2.57% | 2.82% | -0.26pp | 2026-06 | CPILFESL |
| Unemployment Rate | 4.2% | 4.3% | -0.1pp | 2026-06 | UNRATE |
| Nonfarm Payrolls | 158,984k | 158,927k | +57k | 2026-06 | PAYEMS |
| 10Y TIPS Real Yield | 2.41% | — | — | 2026-07-30 | DFII10 |
Headline and core CPI both cooled from May to June (headline 4.17% → 3.46%; core 2.82% → 2.57%), a disinflationary signal, though June is not yet the most current possible data point — July's reading (due mid-August per this week's calendar checks) will be the next test. Payrolls growth remains modest (+57k) with unemployment ticking down to 4.2%. The July ISM Manufacturing PMI, released on 3 Aug, printed 55.6% — up 2.3pp from June's 53.3% and the highest since May 2022, a seventh straight month of expansion with New Orders at 56.7% (source: ISM, web search). No same-day non-US PMI/GDP/PPI releases were confirmed; this week's calendar is otherwise dominated by Friday's US jobs report.
Fixed Income & Bond Analysis
Policy Rates
| Central Bank | Rate | Source |
|---|---|---|
| Fed Funds (upper) | 3.75% | FRED DFEDTARU |
| Fed Funds (lower) | 3.50% | FRED DFEDTARL |
| Effective FFR | 3.63% | FRED DFF |
| ECB Deposit Rate | 2.25% | FRED ECBDFR |
| BOJ Policy Rate | 1.00% | web search (held 31 Jul 2026; hiked 25bps in June) |
| BOE Bank Rate | 3.73% | FRED IUDSOIA (SONIA proxy) |
Government Bond Yields
| Country | 2Y Yield | 10Y Yield | 30Y Yield | Source |
|---|---|---|---|---|
| USA | 4.23% | 4.68% | 5.21% | FRED |
| Eurozone (AAA) | 2.76% | 3.23% | 3.65% | ECB YC API |
| UK | (not retrieved) | 4.98% | (not retrieved) | web |
| Japan | (not retrieved) | ~2.8% | (not retrieved) | web |
Germany/France/Italy country-level 10Y yields and the OAT-Bund spread are not available here: the ECB AAA euro-area curve does not carry individual sovereign yields.
Yield Curve Spreads (FRED pre-computed): - 10Y-2Y spread: +47 bps (2026-07-31) — positively sloped, not flat and not inverted; still well short of a historically "steep" curve (>~75bps). - 10Y-3M spread: +92 bps (2026-07-31) — positive, no recession signal from this measure currently.
The curve's move from flat/near-inverted earlier in the year toward a modest positive slope reflects a market pricing in less imminent Fed easing risk relative to growth, without yet signalling overheating.
Yield Curve Charts
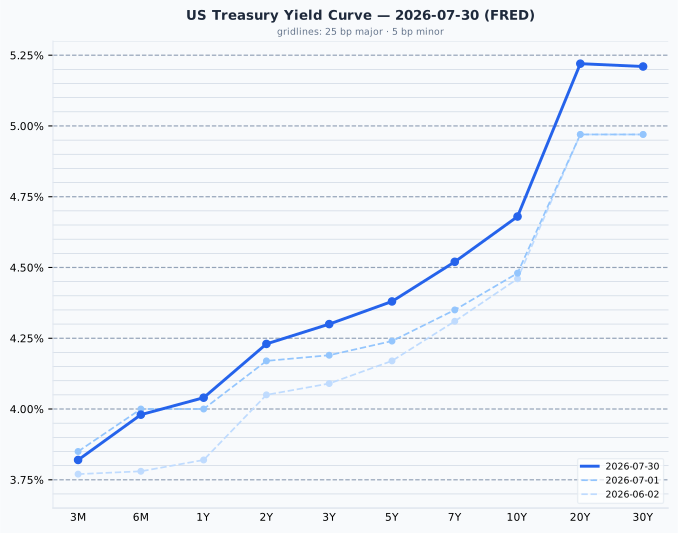
The US curve is upward-sloping across its full length, with the steepest segment beyond 10Y (20Y at 5.22%, 30Y at 5.21% — essentially flat to each other, the classic long-end "flattening at the top" pattern). Versus one month ago (3 Jul) and two months ago (3 Jun), the entire curve has shifted higher by roughly 20-25bps at most maturities, with the long end (20Y/30Y) up about 24bps since early June — a genuine bear-steepening over the period rather than a one-day move.
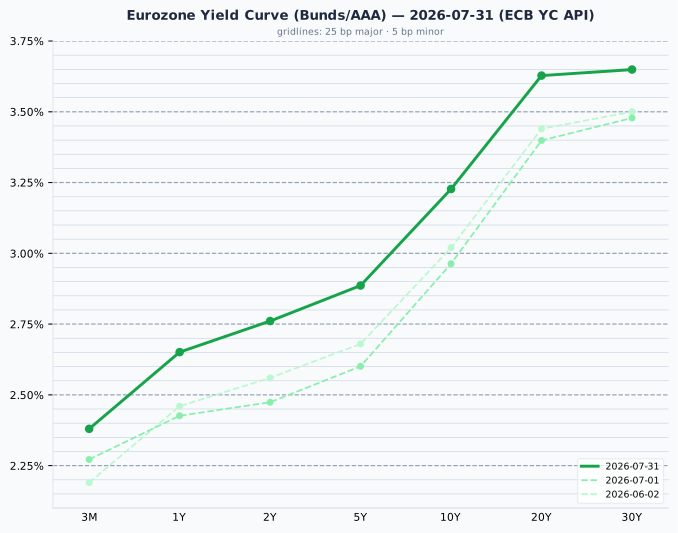
The Eurozone AAA curve is also upward-sloping and has risen across the board versus a month and two months ago — the 10Y is up roughly 21bps since early July and 21bps since early June (2.96%/3.02% → 3.23%), tracking the broader global rise in long-term yields alongside the US move.
Credit Markets (from FRED — authoritative)
| Market | OAS Spread | Series ID |
|---|---|---|
| US Investment Grade | 80 bps | BAMLC0A0CM |
| US High Yield | 284 bps | BAMLH0A0HYM2 |
| Euro High Yield | 265 bps | BAMLHE00EHYIOAS |
US IG spreads (80bps) sit right at the tight end of the typical 80-150bps range, and US High Yield at 284bps is below the 300-500bps considered "normal" — both point to historically tight, complacent credit pricing rather than any stress signal, even with equity volatility concentrated in Korea today.
Bond Portfolio Implications
The S&P 500's negative equity risk premium (-1.0%) is the headline signal here: with the 10Y Treasury at 4.68% and SPY's earnings yield at only 3.68% (1÷27.20), bonds are — on this simple measure — offering a better nominal return than US large-cap equities' current earnings, a historically unusual and cautionary configuration for pure asset allocators, even as equities keep making fresh highs. European and Japanese ERPs remain solidly positive by contrast (all in the +2% range), a more traditional risk-reward setup. Duration risk is a live consideration regardless of region: a 100bps rise in yields implies roughly an 8-9% price loss on a 10-year bond, and the last two months have already seen a ~20bps rise across both the US and Eurozone curves.
Currencies & Commodities
Currencies:
| Pair | Rate | Source |
|---|---|---|
| EUR/USD | 1.1385 | FRED DEXUSEU |
| USD Index | 120.71 | FRED DTWEXBGS |
| USD/JPY | 156.51 | web search |
| GBP/USD | 1.3484 | web search |
| USD/CHF | 0.8073 | web search |
Commodities (yfinance front-month futures):
Prices reflect the 3 Aug settlement (front-month futures settle 20:30 CEST).
| Commodity | Price | Day Chg % | Ticker | Source |
|---|---|---|---|---|
| Brent Crude | $83.77 | -4.73% | BZ=F | yfinance |
| WTI Crude | $80.34 | -5.11% | CL=F | yfinance |
| Gold ($/oz) | $4,090.50 | -0.40% | GC=F | yfinance |
| Silver ($/oz) | $57.86 | +0.12% | SI=F | yfinance |
| Copper ($/lb) | $6.541 | +1.17% | HG=F | yfinance |
| Nat Gas ($/MMBtu) | $2.781 | +1.24% | NG=F | yfinance |
Both WTI and Brent fell sharply, though each pared its midday loss into the settlement: WTI settled at $80.34, down 5.11% (against 5.82% at midday), and Brent at $83.77, down 4.73%. The move is corroborated by web-search reporting that oil slid after President Trump called off a strike on Iran to pursue talks on reopening the Strait of Hormuz, easing the supply-risk premium. WTI is now 45.5% below its all-time high of $147.27 and 32.8% below its 52-week high of $119.48; Brent is 43.2% below its all-time high of $147.43.
Gold settled at $4,090.50, 26.8% below its all-time high of $5,586.20 (also its 52-week high, so that record was set within the past year) — a meaningful pullback, not "near highs" language. Silver settled at $57.86, 52.3% below its all-time high of $121.30 — likewise well off its record. Copper, by contrast, settled at $6.541/lb, just 1.7% off its all-time high of $6.6525/lb — effectively at/near record levels. Natural gas settled at $2.781, up 1.24% on the day and 82.4% below its all-time high of $15.78.
Silver and copper settled within 0.01% of their midday levels.
Sector & Theme Highlights
Big Tech earnings are the dominant theme driving US and European gains today, alongside the Iran-talks-driven relief in energy markets. The sharpest divergent theme is the unwind of the 2026 AI/semiconductor rally in South Korea — KOSPI's ~33% drawdown from its June peak stands in stark contrast to record or near-record closes in the Dow Jones, S&P 500, DAX, and CAC 40, illustrating how concentrated the "AI trade" correction has been to specific chip-exposed names (Samsung, SK Hynix) rather than a broad global de-rating. Pharma M&A speculation (AstraZeneca/Bristol Myers Squibb) is also in focus. Regulatory risk is rising in Korea as authorities weigh curbs on leveraged-ETF exposure to dampen volatility.
Top Stories (Global)
- US stocks rally as August opens and strengthen into the close: Nasdaq 100 +1.78%, S&P 500 +1.48% (7,600.50), Dow Jones +1.32% to a record close of 53,178.41, led by Big Tech ahead of a heavy earnings and jobs-data week.
- Oil settles down ~5% (WTI -5.11%, Brent -4.73%) after President Trump said he had called off a strike on Iran to negotiate on reopening the Strait of Hormuz.
- ISM Manufacturing PMI for July came in at 55.6%, up 2.3pp from June's 53.3% and the strongest reading since May 2022, with New Orders at 56.7% — a seventh consecutive month of expansion.
- KOSPI closes down 5.13% (Samsung -8.76%, SK Hynix -8.79%) — index now ~33% below its June peak amid an AI/semiconductor correction; ~$2tn in market value erased, ~$13bn foreign outflows in July.
- South Korean regulators reportedly considering emergency measures, including reducing leveraged-ETF exposure ratios, to curb speculative volatility.
- DAX closes at a fresh all-time high (26,001.31); CAC 40 and Euro STOXX 50 both within 0.4% of their own records.
- AstraZeneca falls ~7.3% in premarket on FT report of potential Bristol Myers Squibb merger talks valuing a combined entity at roughly $400bn; BMY +3%.
- BOJ holds policy rate at 1.0% (31 Jul meeting) after June's 25bp hike, warning core inflation may run "clearly above" its 2% target in H2 FY2026; JGB 10Y eased to ~2.8%.
- Ferguson shares +9.2% on confirmation of S&P 500 inclusion, replacing Electronic Arts following its acquisition.
Looking Ahead
Key events in the next several trading days: - Friday, August 7: US July jobs report (Employment Situation) — the week's key US macro release. - ISM Services PMI due this week (exact date not confirmed by today's search); Eurozone flash CPI also expected this week. ISM Manufacturing has since been released — see US Economic Indicators above. - Heavy corporate earnings calendar continues through the week following today's Big Tech-led rally. - BOJ's next policy signals will be watched closely given its warning on core inflation exceeding 2% in H2 FY2026. - Watch for further South Korean regulatory action on leveraged-ETF exposure limits following the KOSPI correction.
Market closures in the next 5 calendar days (Nager.Date holiday calendar): - No closures among tracked markets (US, GB, DE, FR, JP, AU, CH, CA, KR, BR, IN) are scheduled between August 4 and August 8, 2026, per the holiday calendar. The next upcoming closures are: Assumption Day (France, August 15), Mountain Day (Japan, August 11), and Liberation Day (South Korea, August 17).