2026 07 15
Global Financial Briefing — Wednesday, 15 July 2026
Market Overview
Global markets are in a mildly risk-on, low-volatility posture heading into Wednesday's US session. The VIX sits at 16.50 (FRED VIXCLS, 2026-07-14) — a moderate reading, comfortably below the 20 level that would signal elevated hedging demand. US inflation data continues to cooperate: June PPI fell -0.3% month-on-month versus a flat consensus, reinforcing market pricing of an ~84.5% probability that the Fed holds its 3.50–3.75% target range at the July FOMC meeting. Fed Chair Kevin Warsh is testifying before the Senate Banking Committee today, a session investors will parse for forward guidance.
US equities are diverging beneath the surface. The S&P 500 (7,563.46, +0.26%) and Dow (52,639.34, +0.25%) are both firm, lifted by mega-cap strength — Amazon, Microsoft and Alphabet are each up roughly 3% and Apple around 4% on the session. The Nasdaq 100 is the outlier, down -0.48% to 29,445.24, dragged by a sharp semiconductor selloff (Micron -7%, Lam Research -4%, Intel -5%, AMD -3%); note this diverges from headline "Nasdaq Composite" wire reports showing a gain, since the Composite's broader constituent base and the ^NDX 100 mega-cap/semi-heavy basket are not tracking identically today. Europe is directionless — CAC 40, STOXX 600 and the SMI are modestly higher while the DAX, STOXX 50 and FTSE 100 are modestly lower — with peripheral bond spreads remaining historically tight (Italy-Bund ~76 bps). Asia-Pacific is the strongest region: the Nikkei 225 jumped +1.49% and the Hang Seng +1.40%, while the Shanghai Composite slipped -0.29%.
The more important story is under the hood in fixed income. US Treasury yields have risen steadily across the curve over the past month — the 10Y is up from 4.48% a month ago to 4.62% today — and the curve has un-inverted (10Y-2Y spread now +40 bps), though it remains far short of historically "steep." Real yields are elevated (10Y TIPS at 2.36%, FRED DFII10), and combined with stretched US equity multiples this produces a negative US equity risk premium — a historically cautionary valuation signal discussed in detail below. Oil is firmer (WTI +0.44%, Brent +0.41%) on renewed US strikes against Iran-linked targets, keeping a geopolitical risk premium embedded in energy prices.
Global Indices Snapshot
Americas
| Index | Level | Day Chg | Day Chg % | Source |
|---|---|---|---|---|
| S&P 500 | 7,563.46 | +19.87 | +0.26% | yfinance ^GSPC |
| Nasdaq 100 | 29,445.24 | -141.05 | -0.48% | yfinance ^NDX |
| Dow Jones | 52,639.34 | +131.07 | +0.25% | yfinance ^DJI |
| Brazil IBOV | 176,021.27 | -619.83 | -0.35% | yfinance ^BVSP |
Americas data reflects today's intraday session (15 Jul) — US markets were still open (REGULAR) as of the data snapshot (15:15 EDT).
Europe
| Index | Level | Day Chg | Day Chg % | Source |
|---|---|---|---|---|
| Euro STOXX 600 | 642.71 | +0.61 | +0.10% | yfinance ^STOXX |
| CAC 40 | 8,382.43 | +15.58 | +0.19% | yfinance ^FCHI |
| DAX | 24,999.53 | -147.50 | -0.59% | yfinance ^GDAXI |
| FTSE 100 | 10,515.92 | -13.47 | -0.13% | yfinance ^FTSE |
| SMI (Swiss) | 14,307.31 | +65.54 | +0.46% | yfinance ^SSMI |
European data reflects today's close (15 Jul).
Asia-Pacific
| Index | Level | Day Chg | Day Chg % | Source |
|---|---|---|---|---|
| Nikkei 225 | 68,751.51 | +1,008.01 | +1.49% | yfinance ^N225 |
| Hang Seng | 24,681.10 | +340.37 | +1.40% | yfinance ^HSI |
| Shanghai Comp | 3,955.58 | -11.55 | -0.29% | yfinance 000001.SS |
| ASX 200 | 8,841.10 | +32.60 | +0.37% | yfinance ^AXJO |
| Kospi (Korea) | 7,284.41 | +427.58 | +6.24% ⚠️ | yfinance ^KS11 |
Asia-Pacific data reflects today's close (15 Jul, local time). ⚠️ Kospi: yfinance returned a 52-week low of 0.0, which is implausible; the +6.24% day-change figure is not corroborated by other Asia-Pacific indices and should be treated with caution — likely a data quality issue rather than a genuine move.
Emerging Markets
| Index | Level | Day Chg % | Source |
|---|---|---|---|
| MSCI EM (EEM) | 65.49 | -0.27% | yfinance EEM |
| India Nifty 50 | 24,078.50 | +0.11% | yfinance ^NSEI |
| South Africa | 63.84 | +0.61% | yfinance EZA |
Index Valuations & Investment Risk
Valuation Table
| Index | Trailing P/E (live) | Hist avg trailing P/E (†) | Premium/discount |
|---|---|---|---|
| S&P 500 | 27.12x | ~16-18x | +59.5% |
| Nasdaq 100 | 31.79x | ~25-30x | +15.6% |
| Euro STOXX 600 | 18.59x | ~15-17x | +16.2% |
| CAC 40 | 17.66x | ~14-16x | +17.7% |
| DAX | 18.28x | ~15-17x | +14.3% |
| FTSE 100 | 17.59x | ~13-15x | +25.6% |
| Nikkei 225 | 22.32x | ~20-22x | +6.3% |
| MSCI EM | 16.88x | ~13-15x | +20.6% |
(†) Hist avg trailing P/E: static long-run reference constants.
Trailing P/E (live): sourced from yfinance trailingPE field on ETF proxies (SPY, QQQ, EXSA.DE,
CAC.PA, EXS1.DE, ISF.L, 1321.T, EEM), fetched 2026-07-15.
Bold entries are more than 20% above their historical average — S&P 500 is the most stretched by a wide margin, at nearly 60% above its long-run norm.
Investment Risk Assessment for ETF Investors
United States (S&P 500 / Nasdaq ETFs) SPY's live trailing P/E of 27.12x is roughly 60% above the ~16-18x historical average — one of the most stretched readings of the current cycle. Earnings yield works out to (1÷27.12) = 3.69%. Against the 10Y Treasury yield of 4.62% (FRED DGS10, 2026-07-13), that produces an Equity Risk Premium of -0.93% — negative, meaning Treasuries currently yield more than S&P 500 earnings. Historically, a negative or sub-1% ERP has been a warning sign for forward equity returns, though it is not a reliable short-term timing tool. QQQ's 31.79x is also rich (+15.6% vs history) but less extreme than SPY on a relative basis. Concentration risk in mega-cap tech remains a key structural risk (illustrated today by the AMZN/MSFT/GOOGL/AAPL rally masking a sharp semiconductor drawdown). Elevated real yields (DFII10 at 2.36%) add further pressure on long-duration growth valuations.
Europe (STOXX 600 / CAC 40 / DAX ETFs) EXSA.DE trailing P/E of 18.59x is +16.2% above its ~15-17x historical average — rich, but far less stretched than the US. Earnings yield = (1÷18.59) = 5.38%. Against the German Bund 10Y yield of 3.15% (ECB YC API, 2026-07-14), the Euro Area ERP is +2.23% — comfortably positive, a much more supportive valuation backdrop than the US. CAC 40 and DAX show similar modest premiums (+17.7% and +14.3% respectively). For non-EUR investors, EUR/USD at 1.1438 (FRED DEXUSEU, 2026-07-10) is a relevant currency-hedge consideration. French political/fiscal risk remains a watch item, though the OAT-Bund spread (computed: France 3.92% - Bund 3.15% ≈ 77 bps) is not signalling acute stress.
Japan (Nikkei / TOPIX ETFs) 1321.T trailing P/E of 22.32x is only +6.3% above its ~20-22x historical range — the least stretched of the major DM markets on this measure. The BOJ hiked its policy rate 25 bps to 1.00% on 2026-06-16 (effective 06-17), the highest since 1995, with further hikes flagged as conditions allow — a regime shift after years near zero that JPY-hedge investors should monitor closely, alongside corporate governance reform tailwinds that have supported multiple expansion.
Emerging Markets (MSCI EM ETFs) EEM trailing P/E of 16.88x is +20.6% above its ~13-15x historical average — modestly into "elevated" territory, though EM still trades at a meaningful discount to DM multiples in absolute terms. Currency and political risk remain the dominant EM considerations; China's weight in the index is a key single-country concentration risk.
Overall Risk Score (qualitative, not financial advice): - US large-cap / Nasdaq: High valuation risk / low margin of safety — negative ERP, ~60% premium to historical average P/E on the S&P 500. - Europe: Moderate — fair-to-full value, but a meaningfully more supportive ERP than the US. - Japan: Moderate — least stretched valuation among DM, offset by BOJ policy-normalization risk. - Emerging Markets: Moderate — approaching elevated valuation territory, with currency/political risk as the dominant overlay.
Disclaimer: This is financial information, not personalised investment advice. Past valuations do not guarantee future returns. Consult a financial advisor before investing.
US Economic Indicators (FRED - authoritative)
| Indicator | Current | Prior | Delta | Reference Date | FRED Series |
|---|---|---|---|---|---|
| CPI YoY % | 3.46% | 4.17% | -0.71pp | 2026-06 | CPIAUCSL |
| Core CPI YoY % | 2.57% | 2.82% | -0.25pp | 2026-06 | CPILFESL |
| Unemployment Rate | 4.2% | 4.3% | -0.1pp | 2026-06 | UNRATE |
| Nonfarm Payrolls | 158,984k | 158,927k | +57k | 2026-06 | PAYEMS |
| 10Y TIPS Real Yield | 2.36% | — | — | 2026-07-13 | DFII10 |
Note: FRED macro data is monthly and typically lags 4-6 weeks; the June 2026 reference month is the most recent available. Headline and core CPI YoY both decelerated meaningfully from May to June.
Other economic releases today (from web search): US Producer Price Index (June) fell -0.3% month-on-month versus a flat consensus — a cooler-than-expected print that reinforces expectations the Fed holds rates steady at the July FOMC meeting. Fed Chair Kevin Warsh testifies before the Senate Banking Committee today (10:00 ET) — a session markets will watch for policy signal.
Fixed Income & Bond Analysis
All US Treasury yields from FRED. European yields from the ECB Yield Curve API and web search.
Policy Rates
| Central Bank | Rate | Source |
|---|---|---|
| Fed Funds (upper) | 3.75% | FRED DFEDTARU |
| Fed Funds (lower) | 3.50% | FRED DFEDTARL |
| Effective FFR | 3.62% | FRED DFF |
| ECB Deposit Rate | 2.25% | FRED ECBDFR |
| BOJ Policy Rate | 1.00% | web search (hiked 25bps 2026-06-16, effective 06-17) |
| BOE Bank Rate | ~3.73% (SONIA/FRED) | FRED IUDSOIA (SONIA proxy), 2026-07-13 |
Government Bond Yields
| Country | 2Y Yield | 10Y Yield | 30Y Yield | Source |
|---|---|---|---|---|
| USA | 4.26% | 4.62% | 5.10% | FRED (2026-07-13) |
| Germany | 2.69% | 3.15% | 3.61% | ECB YC API (2026-07-14, AAA curve) |
| France | — | 3.92% | — | web (2026-07-15) |
| UK | 4.37% | 4.96% | — | web (2026-07-15 / 07-14) |
| Japan | — | 2.68% | — | web (2026-07-15) |
| Italy | — | 3.91% | — | web (2026-07-15) |
Yield Curve Spreads (FRED pre-computed): - 10Y-2Y spread: +40 bps (FRED T10Y2Y, 2026-07-14) — no longer inverted, but well short of a historically "steep" curve (~75bps+); best described as modestly, normally sloped. - 10Y-3M spread: +74 bps (FRED T10Y3M, 2026-07-14) — positive and not signalling near-term recession risk by this classic predictor.
Both spreads have moved from inverted-to-flat territory over the past year toward a more normal positive slope, consistent with markets pricing a soft landing rather than an imminent Fed cutting cycle driven by recession.
OAT-Bund Spread (computed from live data: France 10Y 3.92% − Bund/AAA 10Y 3.15%) ≈ 77 bps — elevated relative to the pre-2022 era but not signalling acute French fiscal stress. BTP-Bund spread (Italy 3.91% − 3.15%) ≈ 76 bps, near multi-year tights and a sign of continued investor confidence in Italian debt sustainability relative to history.
Yield Curve Charts
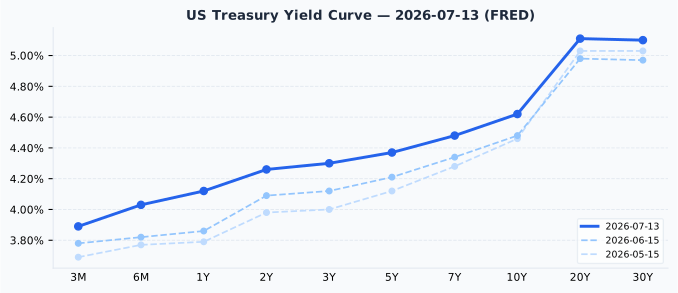
The US curve is positively but only modestly sloped across the front end, steepening further out to the 20-30Y sector. Versus one month ago (2026-06-15), the entire curve has shifted up by roughly 11-14 bps at most maturities, and versus two months ago (2026-05-15) the shift is larger still (+16-20 bps at the front end, smaller further out) — a broad-based rise in yields over the period consistent with firmer growth data and reduced near-term rate-cut expectations.
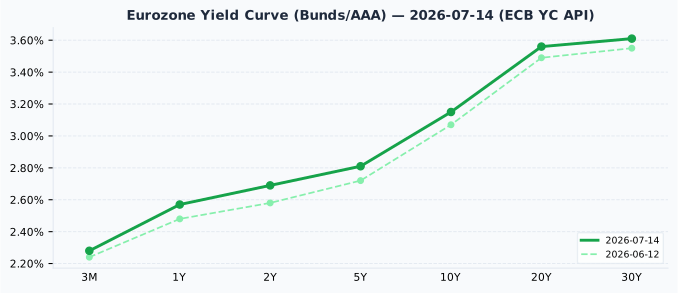
The Eurozone AAA curve is more steeply upward-sloping than its US counterpart at the long end (30Y at 3.61% vs a 10Y of 3.15%). Versus one month ago (2026-06-12), yields are up 4-9 bps across maturities, a smaller move than in the US — European rates have been comparatively more stable.
Sanity check: the FRED 3M yield (3.89%) sits ~27 bps above the Fed Funds target midpoint ((3.50+3.75)÷2 = 3.625%) — a modest deviation, not flagged as anomalous.
Credit Markets (from FRED — authoritative)
| Market | OAS Spread | Series ID |
|---|---|---|
| US Investment Grade | 79 bps | BAMLC0A0CM |
| US High Yield | 272 bps | BAMLH0A0HYM2 |
| Euro High Yield | 251 bps | BAMLHE00EHYIOAS |
All three spreads are at or below the low end of their typical historical ranges (IG: 80-150 bps normal; HY: 300-500 bps normal) — credit markets are pricing historically tight conditions, consistent with the low VIX reading and signalling investor complacency about default/credit risk rather than any stress. This is a environment where credit offers little compensation for risk relative to history.
Bond Portfolio Implications
The negative US Equity Risk Premium (-0.93%, calculated above) is the standout signal this week: 10Y Treasuries at 4.62% now yield more than the S&P 500's trailing earnings yield of 3.69% — a historically rare inversion that has, in the past, preceded periods of below-average forward equity returns relative to bonds. By contrast, European equities retain a healthy positive ERP (+2.23%), making the relative case for European over US equity exposure somewhat stronger from a pure valuation standpoint, all else equal (currency and growth-differential risk aside).
Duration risk: with the 10Y at 4.62%, a 100bp rise in yields would imply roughly an 8-9% price loss on a 10-year Treasury — a meaningful risk for long-duration bond holders if inflation data surprises higher or fiscal issuance pressures intensify. Given historically tight credit spreads offering little extra compensation, higher-quality, shorter-duration fixed income continues to look more attractive on a risk-adjusted basis than reaching for high yield at current spreads.
Currencies & Commodities
Currencies:
| Pair | Rate | Source |
|---|---|---|
| EUR/USD | 1.1438 | FRED DEXUSEU (2026-07-10) |
| USD Index | 120.50 | FRED DTWEXBGS (2026-07-10) |
| USD/JPY | 162.29 | web search |
| GBP/USD | 1.3396 | web search |
| USD/CHF | 0.8088 | web search |
Commodities (all from yfinance MCP front-month futures):
| Commodity | Price | Day Chg % | Ticker | Source |
|---|---|---|---|---|
| Brent Crude | $85.08 | +0.41% | BZ=F | yfinance |
| WTI Crude | $79.69 | +0.44% | CL=F | yfinance |
| Gold ($/oz) | $4,068.60 | -0.03% | GC=F | yfinance |
| Silver ($/oz) | $58.29 | -1.39% | SI=F | yfinance |
| Copper ($/lb) | $6.39 | +0.15% | HG=F | yfinance |
| Nat Gas ($/MMBtu) | $2.93 | +0.86% | NG=F | yfinance |
WTI and Brent are both firmer today on renewed US strikes against Iran-linked targets, but both remain well off their historical highs — WTI is 45.9% below its all-time high of $147.27, and Brent is 42.3% below its all-time high of $147.43. Gold, at $4,068.60/oz, is 27.2% below its all-time high of $5,586.20 (which also stands as its 52-week high, reached earlier this year) — still a historically elevated nominal price despite the pullback. Silver, at $58.29/oz, is 51.9% below its all-time high of $121.30. Copper, at $6.39/lb, is only slightly below (-4.0%) its all-time high of $6.6525 — the tightest of the group to its record. Natural gas at $2.93/MMBtu remains 81% below its 2005/2008-era all-time high of $15.78, a reflection of how structurally different (shale-driven) supply conditions are today versus that historical spike.
Crypto: No moves exceeding the 3% notability threshold were surfaced in today's web search; omitted.
Sector & Theme Highlights
Today's dominant cross-market theme is the bifurcation within US tech: mega-cap platform names (Amazon, Microsoft, Alphabet, Apple) are rallying 3-4% while semiconductor names (Micron, Lam Research, Intel, AMD) are down 3-7%, pulling the Nasdaq 100 into negative territory even as the S&P 500 and Dow advance. This is a notable rotation signal worth monitoring for whether it persists into the heart of Q2 earnings season. Financials had a strong showing via BlackRock's Q2 beat (EPS $13.91 vs $12.67 estimate; revenue +31% YoY to $7.08B). In Asia, the yen-sensitive Nikkei 225 continued its strong run (+1.49%) even as the BOJ pursues policy normalization — exporters appear to be benefiting from a still-favorable JPY level (USD/JPY 162.29) despite the rate hike. Energy markets remain geopolitically sensitive, with Iran-related tensions the key swing factor for oil in the near term.
Top Stories (Global)
- US PPI cools 0.3% in June vs a flat consensus, reinforcing ~84.5% market-implied odds the Fed holds rates at 3.50-3.75% at the July FOMC meeting.
- Fed Chair Kevin Warsh testifies before the Senate Banking Committee today (10:00 ET) — a key policy-signal event for markets.
- Big Tech rallies: Amazon, Microsoft and Alphabet each up roughly 3%; Apple +4%.
- Semiconductor selloff: Micron -7%, Lam Research -4%, Intel -5%, AMD -3%, dragging the Nasdaq 100 into the red even as broader US indices advance.
- BlackRock beats on Q2 earnings: EPS $13.91 vs $12.67 estimate; revenue +31% YoY to $7.08B.
- Pentair falls 20.7% after cutting Q2/FY2026 guidance; CFO Nicholas Brazis resigns.
- WTI crude up ~1% (~$80/bbl intraday) after further US strikes against Iran-linked targets, keeping a geopolitical risk premium in energy markets.
- BOJ's June 25bp hike to 1.00% (effective 06-17) — the highest Japanese policy rate since 1995 — continues to be digested by JPY and Japanese equity markets; further hikes are flagged as conditions allow.
Looking Ahead
Key events in the next 1-5 trading days: - Fed Chair Kevin Warsh testifies before the Senate Banking Committee today (15 Jul, 10:00 ET) — watch for forward guidance ahead of the July FOMC meeting. - Q2 earnings season continues to build momentum following BlackRock's strong Q2 beat; more large-cap financials and tech reports are expected in the coming days. - Geopolitical risk (Iran): continued monitoring warranted given the direct impact on oil prices seen this week. - BOJ policy path: markets will watch for signals on the pace of further rate hikes toward Governor-flagged neutral levels (~2%) following the June hike to 1.00%.
Market closures (next 5 calendar dates, from holiday calendar): - 20 Jul 2026 — Japan: Marine Day (market closed) - 1 Aug 2026 — Switzerland: Swiss National Day (market closed) - 15 Aug 2026 — France: Assumption Day (market closed) - 17 Aug 2026 — South Korea: Liberation Day (market closed) - 31 Aug 2026 — United Kingdom: Summer Bank Holiday (market closed)