Global Financial Briefing — Thursday, 13 August 2026
Americas and European index levels, commodities and day changes reflect the 13 August closing print; the Asia-Pacific rows are closing prints too. Fixed income, FX and macro figures are dated inline.
Market Overview
Risk-on, and led squarely by the United States, though the session gave back some of its gains into the close. A second consecutive benign US inflation print — July PPI unchanged month-on-month against a +0.2% consensus, with the annual rate cooling to 4.7% from 5.5% — landed on top of Wednesday's in-line CPI and gave an already-strong AI earnings tape room to run. The S&P 500 closed at 7,798.99, +0.65% on the session and fractionally above its previous closing record, with the Nasdaq 100 up 1.15% on the back of a ~18% jump in CoreWeave after a large Q2 beat. Crude sold off hard at the same time — WTI −2.4% to $81.25, Brent −2.1% to $87.07 — which reinforces the disinflation narrative and removes a cost headwind from the equity story.
Europe faded into its close. The STOXX 600 had been up 0.08% mid-afternoon and finished the day fractionally lower at −0.04%, and the CAC 40, DAX and FTSE 100 all closed in the red — the FTSE down 0.56% and the DAX reversing an early advance to close down 0.12%, having traded within roughly fifteen points of its 52-week high earlier in the session. Only the Euro STOXX 50 and the SMI held onto gains, both +0.18%. The divergence is not a European problem so much as a composition one: the day's move was driven by AI infrastructure earnings, and Europe's indices carry far less of that exposure. Asia closed firmer — the Nikkei added 1.16% and the Kospi surged 3.56%, its second violent up-day in three sessions, though the Korean index remains 27.4% below the record it set within the past year and the swing says more about how far it fell than about fresh strength.
The macro cross-currents are worth holding onto. US July payrolls actually fell 23,000 while the unemployment rate declined to 4.1% from 4.2% — the two surveys are pointing in opposite directions, which is exactly the ambiguity that keeps a September Fed cut live without making it certain. Meanwhile the US long end has drifted up over the past month: the 10Y sits at 4.70% and the 30Y at 5.24%, both roughly 15–20 bps higher than a month ago while the 2Y is unchanged. That is a bear steepening — the market repricing term premium and long-run supply, not policy. For a euro-based investor the relevant number is that the same equity rally has left the S&P 500 at 26.2x trailing earnings against a 4.70% ten-year, while the STOXX 600 sits at 18.2x against a 3.17% AAA yield.
Global Indices Snapshot
Americas
| Index | Level | Day Chg | Day Chg % | Source |
|---|---|---|---|---|
| S&P 500 | 7,798.99 | +50.49 | +0.65% | yfinance ^GSPC |
| Nasdaq 100 | 30,084.50 | +341.90 | +1.15% | yfinance ^NDX |
| Dow Jones | 53,839.99 | +69.69 | +0.13% | yfinance ^DJI |
| Brazil IBOV | 167,100.95 | −390.11 | −0.23% | yfinance ^BVSP |
Americas data reflects the 13 Aug close.
Cross-check: FRED SP500 reports a 13 Aug close of 7,798.99 and a 12 Aug close of 7,748.50, matching the yfinance close and prior close to the cent.
Europe
| Index | Level | Day Chg | Day Chg % | Source |
|---|---|---|---|---|
| Euro STOXX 600 | 659.24 | −0.24 | −0.04% | yfinance ^STOXX |
| Euro STOXX 50 | 6,545.47 | +11.48 | +0.18% | yfinance ^STOXX50E |
| CAC 40 | 8,650.56 | −24.38 | −0.28% | yfinance ^FCHI |
| DAX | 26,299.74 | −31.33 | −0.12% | yfinance ^GDAXI |
| FTSE 100 | 10,772.67 | −60.48 | −0.56% | yfinance ^FTSE |
| SMI (Swiss) | 14,475.13 | +25.66 | +0.18% | yfinance ^SSMI |
European data reflects the 13 Aug close. Every European index drifted lower into the finish, and the STOXX 600 and DAX both crossed from positive to negative.
Asia-Pacific
| Index | Level | Day Chg | Day Chg % | Source |
|---|---|---|---|---|
| Nikkei 225 | 68,308.59 | +784.53 | +1.16% | yfinance ^N225 |
| Hang Seng | 25,396.51 | −43.66 | −0.17% | yfinance ^HSI |
| Shanghai Comp | 3,926.96 | −19.71 | −0.50% | yfinance 000001.SS |
| ASX 200 | 9,188.50 | −20.90 | −0.23% | yfinance ^AXJO |
| Kospi (Korea) | 6,813.34 | +234.30 | +3.56% | yfinance ^KS11 |
Asia-Pacific data reflects the 13 Aug close. The levels above were taken after each market had closed and are the correct closing prints.
The Kospi's +3.56% was cross-checked against the price history (12 Aug close 6,579.04) and is genuine, not a data artefact. It follows a +3.68% session on 12 Aug. The index remains 27.4% below its 52-week high of 9,385.59.
Emerging Markets
| Index | Level | Day Chg % | Source |
|---|---|---|---|
| MSCI EM (EEM) | 66.68 | +0.33% | yfinance EEM |
| India Nifty 50 | 24,395.85 | −0.16% | yfinance ^NSEI |
| South Africa | 67.33 | −1.46% | yfinance EZA |
EEM and EZA are US-listed ETFs and now reflect the 13 Aug NYSE close; both gave ground into the finish, EZA materially so. The Nifty reflects the 13 Aug close.
Index Valuations & Investment Risk
Valuation Table
| Index | Trailing P/E (live) | Hist avg trailing P/E (†) | Premium to hist midpoint |
|---|---|---|---|
| S&P 500 | 26.21x | ~16-18x | +54.2% |
| Nasdaq 100 | 31.34x | ~25-30x | +13.9% |
| Euro STOXX 600 | 18.21x | ~15-17x | +13.8% |
| CAC 40 | 17.76x | ~14-16x | +18.4% |
| DAX | 19.10x | ~15-17x | +19.3% |
| FTSE 100 | 18.09x | ~13-15x | +29.2% |
| Nikkei 225 | 23.01x | ~20-22x | +9.6% |
| MSCI EM | 17.35x | ~13-15x | +23.9% |
(†) Hist avg trailing P/E: static long-run reference constants. Live trailing P/E from yfinance trailingPE on ETF proxies (SPY, QQQ, EXSA.DE, CAC.PA, EXS1.DE, ISF.L, 1321.T, EEM). Bold = more than 20% above the historical midpoint.
The standout is the S&P 500 at 54% above its long-run trailing average — past the ">40% = historically stretched" threshold, and by a wide margin. Note the shape of the premium: the Nasdaq 100, the index actually driving the day's rally, is only 14% above its own historical average, because its historical average is already high. The stretch is in the broad US market, where mega-cap tech now dominates the index-level multiple.
Investment Risk Assessment for ETF Investors
United States (S&P 500 / Nasdaq ETFs)
At 26.21x trailing, the S&P 500 earnings yield is 3.81% (1÷26.21) against a 10Y Treasury at 4.70% (FRED DGS10, 2026-08-11) — an earnings yield gap of −0.89 pp. Bonds currently offer more income than equities. On a real basis, using the 10Y TIPS yield of 2.43% (FRED DFII10, 2026-08-11), the gap is +1.39 pp. The correction is worth 2.27 pp and flips the sign, which is the point: see the caveats under Bond Portfolio Implications before reading either number as a signal.
The index closed at a record and sits well above both moving averages (50-day 7,503.96; 200-day 7,065.31), 23.5% above its 52-week low of 6,316.91. Concentration is the live risk — the day's 0.65% index move came disproportionately from AI infrastructure names, and the dispersion inside that complex is real (CoreWeave +18%, Cerebras −15% on the same day). The Nasdaq 100 at 31.34x with an earnings yield of 3.19% has an even more negative gap of −1.51 pp against the 10Y.
Europe (STOXX 600 / CAC 40 / DAX ETFs)
The STOXX 600 at 18.21x gives an earnings yield of 5.49% (1÷18.21) against a euro AAA 10Y of 3.17% — a euro earnings yield gap of +2.33 pp, versus −0.89 pp in the US. On a real basis the euro gap is +4.36 pp against the US +1.39 pp.
Part of any US–euro comparison is simply the difference in inflation and policy paths rather than a difference in risk compensation — but here that part is small. The 153 bp nominal yield difference between the two 10-year benchmarks decomposes into only 23 bp of expected-inflation difference (US breakeven 2.27% vs euro-area SPF 2.04%) and 130 bp of real rate difference. Correcting for inflation narrows the transatlantic valuation gap from 3.21 pp to 2.98 pp — barely at all. Europe looks genuinely cheaper on this measure, not just differently-inflated.
Every major European index closed at or very near the top of its 52-week range — the STOXX 600 at 659.24 against a 52-week range of 543.17–663.41, the DAX at 26,299.74 against 21,863.81–26,573.50 — so this is relative cheapness inside a market that has itself run hard. Geopolitical and fiscal risk remain the discount's likely explanation. Note that the FTSE 100 at 18.09x is the largest European premium to its own history (+29%), so "Europe is cheap" does not extend cleanly to the UK.
On currency: a euro-based investor holding EUR-quoted European funds has no FX effect on the quoted value of the holding, but real FX exposure remains inside the earnings — CAC 40 and STOXX 600 constituents are multinationals earning abroad. The exposure is smaller and slower, not absent.
Japan (Nikkei / TOPIX ETFs)
The Nikkei at 23.01x is only ~10% above its historical average and rose 1.16% on the day, but sits 6.2% below its 52-week high of 72,831.73. The dominant risk is policy: the BOJ holds at 1.00%, its highest since 1995, and its July summary of opinions flagged upside price risks and a possibly faster hike pace, with roughly 70% market-implied odds of a September move. With USD/JPY at 159.43, an unhedged euro or dollar investor has been earning a currency loss on top of index returns; a BOJ hike would reverse that, which is the case for hedging being a two-sided decision here rather than an obvious one.
Emerging Markets (MSCI EM ETFs)
EEM at 17.35x is 24% above its own historical average — the traditional "EM trades at a discount to DM" framing does not hold against its own history, even if it holds against the S&P 500's 26.21x. EEM is 6.8% below its 52-week high. The internal dispersion is severe: Korea 27.4% below its 52-week high after a violent round trip, Brazil 16.2% below its 52-week high and closing beneath both its 50- and 200-day moving averages, Shanghai below both moving averages, India below its 200-day. China weight and currency/political risk remain the structural considerations.
Overall Risk Score (qualitative, not financial advice): - United States — high valuation risk / low margin of safety. 54% premium to historical average, negative nominal earnings yield gap, high concentration. - Europe — moderate. Meaningful premium to history (+14–19%) but the most favourable income trade-off of any developed market here. - Japan — moderate. Fair-ish valuation, but policy and currency risk are both live and near-term. - Emerging markets — moderate, with high dispersion. The aggregate multiple is not the discount it is often assumed to be.
Disclaimer: This is financial information, not personalised investment advice. Past valuations do not guarantee future returns. Consult a financial advisor before investing.
US Economic Indicators (FRED — authoritative)
| Indicator | Current | Prior | Delta | Reference Date | FRED Series |
|---|---|---|---|---|---|
| CPI YoY % | 3.30% | 3.46% | −0.16 pp | Jul 2026 | CPIAUCSL |
| Core CPI YoY % | 2.47% | 2.57% | −0.10 pp | Jul 2026 | CPILFESL |
| Unemployment Rate | 4.1% | 4.2% | −0.1 pp | Jul 2026 | UNRATE |
| Nonfarm Payrolls | −23K | +57K | −80K | Jul 2026 (m/m) | PAYEMS |
| 10Y TIPS Real Yield | 2.43% | 2.43% | 0 bp | 2026-08-11 | DFII10 |
Note: FRED macro data is monthly and typically lags 4–6 weeks; reference months are shown above.
The labour market line is the one to watch. Payrolls fell 23,000 in July — an 80,000 swing from June's +57,000 — while the unemployment rate simultaneously fell to 4.1%. The establishment and household surveys are telling different stories, which is a classic late-cycle ambiguity and one reason the September Fed decision is genuinely open.
Other economic releases today:
| Indicator | Actual | Consensus | Prior | Reaction |
|---|---|---|---|---|
| US PPI final demand MoM (Jul) | 0.0% | +0.2% | −0.1% | Softer; goods −0.7% offset services +0.2% and construction +2.2% |
| US PPI final demand YoY (Jul) | +4.7% | +4.9% | +5.5% | Cooler, and a large deceleration |
| US Initial Jobless Claims (wk 8 Aug) | 209K | 202K | 200K (rev. from 199K) | Above consensus, but the 4-week average held at 199K |
| US CPI / Core CPI MoM (Jul, rel. 12 Aug) | +0.1% / +0.2% | +0.1% / +0.2% | — | In line; set up today's tape |
Producer inflation cooling from 5.5% to 4.7% is a real improvement, but 4.7% is still high in absolute terms — the direction is friendlier than the level.
Fixed Income & Bond Analysis
Policy Rates
| Central Bank | Rate | Source |
|---|---|---|
| Fed Funds (upper) | 3.75% | FRED DFEDTARU |
| Fed Funds (lower) | 3.50% | FRED DFEDTARL |
| Effective FFR | 3.63% | FRED DFF |
| ECB Deposit Rate | 2.25% | FRED ECBDFR |
| BOJ Policy Rate | 1.00% | web search |
| BOE Bank Rate | ~3.73% | FRED IUDSOIA (SONIA proxy) |
Government Bond Yields
| Country | 2Y Yield | 10Y Yield | 30Y Yield | Day Chg (10Y) | Source |
|---|---|---|---|---|---|
| USA | 4.22% | 4.70% | 5.24% | −2 bp | FRED (2026-08-11) |
| Germany | 2.70% | 3.17% | 3.62% | (n/a) | ECB YC API (2026-08-12), AAA euro area curve |
| France | (not retrieved) | (not retrieved) | (not retrieved) | — | web |
| UK | (not retrieved) | 4.98% | (not retrieved) | — | web |
| Japan | (not retrieved) | 2.86% | (not retrieved) | — | web |
| Italy | (not retrieved) | (not retrieved) | (not retrieved) | — | web |
The German row is the ECB's AAA-rated euro area composite curve rather than the Bund line specifically; a web check put the 10Y Bund at 3.16% on 12 August, within a basis point of the ECB composite's 3.17%, so the two are effectively interchangeable at the 10-year point today.
Yield Curve Spreads (FRED pre-computed): - 10Y-2Y spread: +48 bps (FRED T10Y2Y, 2026-08-12) — positively sloped, but not steep. Comfortably out of inversion, without the steepness that normally accompanies an active easing cycle. - 10Y-3M spread: +81 bps (FRED T10Y3M, 2026-08-12) — positive, no recession signal from this indicator.
Both spreads have normalised out of the inversion that characterised 2023–24. What the shape says now is a market expecting the policy rate to sit roughly where it is, with a modest term premium — not one pricing aggressive cuts.
OAT-Bund Spread: (not retrieved) — today's web searches returned no current French OAT quote. The most recent figure retrievable was 69 bps as of 22 May 2026, which is too stale to characterise French fiscal risk today and is not carried into this briefing's analysis.
Yield Curve Charts
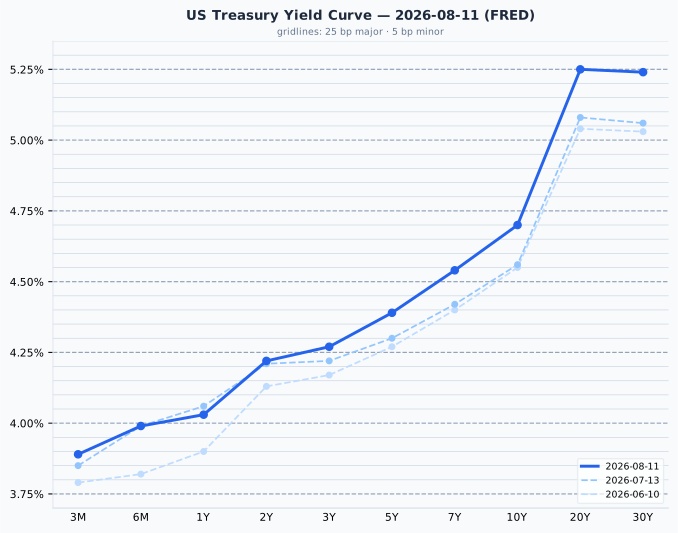
The US curve slopes upward across its full length, from 3.89% at 3 months to 5.24–5.25% at 20–30 years, with the customary slight inversion between the 20Y and 30Y points. Against a month ago the move has been a clear bear steepening: the 2Y is up just 1 bp and the 3M up 4 bps, while the 10Y is up 14 bps and the 30Y up 18 bps — the market has repriced term premium and long-end supply, not the policy path.
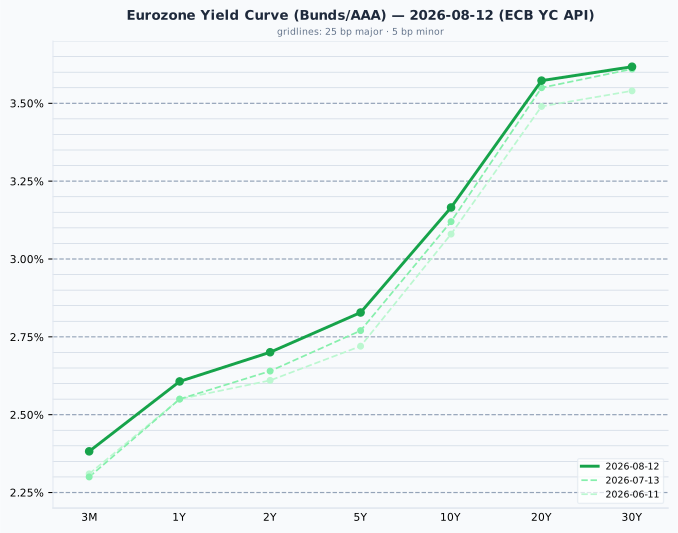
The euro AAA curve is upward sloping throughout, from 2.38% at 3 months to 3.62% at 30 years, with a 10Y-2Y spread of 47 bps that closely mirrors the US 48 bps. The shift since mid-July has been a small, near-parallel rise concentrated at the front: +8 bps at 3 months and +5 to +6 bps out to 10 years, versus +1 to +2 bps at 20–30 years — a mild flattening on top of a modest upward move.
Credit Markets (FRED — authoritative)
| Market | OAS Spread | Series ID |
|---|---|---|
| US Investment Grade | 79 bps | BAMLC0A0CM |
| US High Yield | 271 bps | BAMLH0A0HYM2 |
| Euro High Yield | 257 bps | BAMLHE00EHYIOAS |
All three are historically tight — US HY at 271 bps sits below the 300–500 bps range that is normally called normal, and US IG at 79 bps is just under the 80–150 bps band. Credit markets are pricing essentially no default risk premium above the floor. That is consistent with the equity tape and with a VIX of 14.55, but it also means credit offers very little compensation for anything going wrong, and there is no room for spreads to tighten further as a source of return.
Real Yields (US and Euro Area)
| Region | Nominal 10Y | Expected inflation | Real 10Y | How the real yield is obtained |
|---|---|---|---|---|
| United States | 4.70% | 2.27% (residual) | 2.43% | Measured. TIPS trade, so the market quotes a real yield directly; expected inflation is backed out as the residual (the breakeven) |
| Euro area | 3.17% | 2.04% (measured) | 1.13% | Constructed. No euro inflation-linked benchmark is published, so a survey expectation (ECB SPF, 2026-Q3) is subtracted from the nominal yield |
The two rows are built in opposite directions. Only the US real yield of 2.43% is a price anyone actually trades; the euro 1.13% is a nominal yield minus a survey, and should be treated as the softer of the two numbers. Two mismatches follow from that: the US breakeven embeds an inflation risk premium that a survey of forecasters does not, and the SPF horizon is five years against the bond's ten.
Decomposing the 153 bp nominal gap between the two: 23 bp is expected inflation (2.27% vs 2.04%) and 130 bp is real. This is overwhelmingly a real-rate story, not an inflation story — the two regions expect broadly similar inflation and are pricing very different real returns on capital.
The US–euro real rate gap is not an investment opportunity
The 130 bp real yield advantage in the US is a structural feature — higher US trend growth, euro-area excess savings, Bund scarcity, US fiscal supply — and not something a euro-based investor can capture. Hedging the currency cancels it, because the forward rate is set precisely to remove the interest differential; unhedged, buying Treasuries over Bunds is a bet on the dollar, not a bond decision. A real yield is real in its own currency: 2.43% means 2.43% above US inflation, which is not a real return for someone who spends euros. State the gap as a macro fact about relative policy stance and growth expectations, and draw no portfolio conclusion from it.
Bond Portfolio Implications
Earnings yield gap: what it is good for, and what it is not
- S&P 500 gap = 3.81% (1÷26.21) − 4.70% = −0.89 pp
- Euro STOXX 600 gap = 5.49% (1÷18.21) − 3.17% = +2.33 pp
This is the earnings yield gap, not the equity risk premium — the ERP is expected total return minus the risk-free rate and requires a growth estimate this measure omits entirely.
What the gap does honestly is compare the income the two instruments offer today, using nothing but quoted prices. A US investor can lock a 4.70% Treasury coupon or accept equity risk at a 3.81% earnings yield; a euro investor can take 3.17% on AAA paper or 5.49% on European equity. That is a real, assumption-free statement about the trade-off available right now.
What it cannot do is forecast whether equities will beat bonds. Adding the bond yield to the earnings yield empirically makes the equity forecast worse than the earnings yield alone, so nothing about the US gap being negative should be read as a warning about forward returns.
Two structural biases matter when the number carries weight:
- It ignores growth. The bond coupon is fixed for a decade; the earnings behind the equity yield grow roughly with inflation, so the gap understates equities by approximately expected inflation. Stating it against the real yield corrects this: the US gap on a real basis is 3.81% − 2.43% = +1.39 pp. The correction is worth 2.27 pp and flips the sign from negative to positive — that magnitude is the interesting fact, not the agreement of the two arrangements.
- An equity holder does not receive the full earnings yield. Only the dividend and buyback portion arrives as cash; the remainder is retained by the company. Whenever this section is read as a comparison of income, that asymmetry applies.
For the forward-looking valuation argument, the more reliable measure is earnings yield (or P/E) versus its own history — where the S&P 500's 54% premium is the meaningful datapoint, not the gap.
Duration. With the 10Y at 4.70%, a 100 bp rise in yields implies roughly an 8–9% price loss on a 10-year bond. The bear steepening of the past month is the relevant warning: the long end has moved 14–18 bps while the front has not moved at all, so long-duration exposure has been the losing side of a market where cash yields have been static. With the 3M at 3.89% and the 10Y at 4.70%, an investor is being paid 81 bps to take ten years of duration risk — thin compensation by historical standards, and an argument for keeping duration short-to-intermediate rather than reaching for the long end.
Currencies & Commodities
Currencies:
| Pair | Rate | Source |
|---|---|---|
| EUR/USD | 1.1559 | FRED DEXUSEU (2026-08-07) |
| USD Index | 119.06 | FRED DTWEXBGS (2026-08-07) |
| USD/JPY | 159.43 | web search |
| GBP/USD | 1.3494 | web search |
| USD/CHF | 0.8135 | web search |
Note: the two FRED FX series carry a 2026-08-07 observation date and are therefore roughly a week stale — FRED's FX publication has lagged this week. Treat EUR/USD and the dollar index as indicative rather than current.
Commodities (front-month futures):
| Commodity | Price | Day Chg % | Ticker | Source |
|---|---|---|---|---|
| Brent Crude | $87.07 | −2.15% | BZ=F | yfinance |
| WTI Crude | $81.25 | −2.43% | CL=F | yfinance |
| Gold ($/oz) | $4,420.40 | −1.05% | GC=F | yfinance |
| Silver ($/oz) | $64.99 | −1.08% | SI=F | yfinance |
| Copper ($/lb) | $6.608 | −0.11% | HG=F | yfinance |
| Nat Gas ($/MMBtu) | $2.727 | −2.75% | NG=F | yfinance |
Commodity rows reflect the 13 Aug settlement. Both crude benchmarks pared their losses into the settle while gold, silver and natural gas extended theirs, and copper crossed from a marginal gain to a marginal loss.
Precious metals — where prices actually sit. Gold at $4,420.40 is 20.9% below its all-time high of $5,586.20, and silver at $64.99 is 46.4% below its all-time high of $121.30. Both of those highs were set within the past 52 weeks — the 52-week high and the all-time high are the same number for each metal. This is not a market "near record highs"; it is a market that made a record within the year and has retraced very substantially, silver most of all. Any framing of precious metals as being at or near highs would be badly wrong.
Energy. Both crude benchmarks fell more than 2%, extending a sustained decline: WTI is 44.8% below its all-time high of $147.27 and 32.0% below its 52-week high of $119.48. Natural gas at $2.727 is 82.7% below its all-time high and only 9.8% above its 52-week low of $2.483 — energy is the disinflationary force in this data set.
Copper is the outlier: at $6.608 it is 1.8% below its all-time high of $6.728, effectively at record levels, and essentially unchanged on the day at −0.11%. Copper at records while crude collapses is a striking split — it points to electrification and grid/datacentre demand rather than broad cyclical strength, since a genuine global demand boom would lift both.
Crypto: no data retrieved.
Sector & Theme Highlights
- AI infrastructure remains the market's engine — but with real dispersion. CoreWeave +18% on a Q2 beat and Cerebras −15% on mixed results in the same session. The Nasdaq 100 outperformed the Dow by 1.02 percentage points on the day, and that gap is entirely this theme. Investors treating "AI" as a single trade are being shown otherwise. Applied Materials then reported after the bell with record revenue but fell in the after-hours — the dispersion extends past the closing bell.
- Energy versus metals. Crude down more than 2% while copper holds within 2% of its all-time high is the cleanest theme in the day's data. Oil is behaving like a market with ample supply; copper like one facing structural electrification demand.
- Disinflation, slowly. PPI at 4.7% YoY from 5.5% and CPI at 3.30% from 3.46% both moved the right way. Both remain above target — the trend is friendly, the level is not yet.
- Korea's volatility regime. Two sessions of +3.5%-plus after a 27% drawdown from the 52-week high. The Kospi's 52-week range of 3,079 to 9,386 is extraordinary for a developed-market index and warrants caution in any EM allocation that carries a large Korea weight.
- US consumer, two-tier. Cava +16% on strong results against Tapestry −9% on weak guidance despite beating. Guidance, not the current quarter, is doing the punishing.
Top Stories (Global)
- S&P 500 sets a fresh closing record as a benign July PPI print (0.0% MoM vs +0.2% expected) landed on top of an in-line CPI, with the index closing up 0.65% at 7,798.99 and the Nasdaq 100 up 1.15%.
- July PPI cools sharply on an annual basis — 4.7% YoY versus 5.5% prior. Final demand goods fell 0.7%, offset by services +0.2% and construction +2.2%.
- US July payrolls contracted by 23,000 while the unemployment rate fell to 4.1% from 4.2% — the household and establishment surveys diverging, leaving the September Fed decision genuinely open.
- CoreWeave surges ~18% after a large Q2 beat, extending the AI infrastructure trade; Cerebras drops ~15% on mixed results, underlining dispersion within the theme.
- BOJ's July summary of opinions flags upside price risks and a possibly faster pace of hikes, with the policy rate at 1.00% — the highest since 1995 — and roughly 70% market-implied odds of a September move.
- Crude sells off hard, WTI −2.4% and Brent −2.1% at the settle, reinforcing the disinflation narrative and helping the equity bid.
- Applied Materials posts record Q3 revenue of $9.12bn after the close, with non-GAAP EPS of $3.50 against $3.45 expected and record operating income of $3.08bn, and raised its calendar-2026 Semiconductor Systems revenue expectations — but the shares fell close to 4% in the after-hours session, revenue having come in marginally under consensus.
- US initial jobless claims for the week ended 8 August came in at 209,000, above the 202,000 consensus and up 9,000 from a prior week revised to 200,000. The four-week moving average held at 199,000 and continuing claims fell to 1.777mn, so the level remains historically low.
- Tapestry falls ~9% despite beating Q4 estimates, on disappointing guidance — a signal that the market is pricing the forward path, not the printed quarter, in consumer discretionary.
- The Kospi jumps 3.56%, its second violent advance in three sessions, though it remains 27.4% below its 52-week high.
Looking Ahead
Central banks - BOJ — 18 September 2026: the next scheduled meeting, with markets pricing roughly 70% odds of a hike from the current 1.00%. Yen direction from here is largely a function of this decision. - Federal Reserve: with CPI and PPI both now in and the labour data mixed, the FOMC minutes and Fed speakers are the next inputs on the September path.
Data - Euro-area and UK flash PMIs and any subsequent inflation prints will matter more than usual given the 130 bp real-rate gap discussed above.
Earnings - Applied Materials (AMAT) has now reported — see Top Stories. Still to come or reporting alongside it: NetEase (NTES), JD.com (JD), Brookfield (BN), Nu Holdings (NU).
Market closures (from the Nager.Date holiday calendar) - Saturday 15 August — France, Assumption Day. Falls on a weekend; no trading impact. - Monday 17 August — South Korea, Liberation Day. The KRX will be closed; expect no Kospi print that day. - No US, UK, German, Japanese, Australian, Swiss, Canadian or Brazilian closures in the next five calendar days. - India's entry in the holiday calendar is null, so Indian market closures could not be checked. That is a gap in the calendar, not a confirmation that none exist.