2026 09 29
Global Financial Briefing — Tuesday, 29 September 2026
Figures reflect the 29 Sep close wherever close data exists. FX quotes and the French, UK, Japanese and Italian bond yields are evening quotes; other figures are dated inline. The US Treasury curve is the 29 Sep close; the euro AAA curve is the 28 Sep curve, as the ECB had not yet published 29 Sep.
Market Overview
Oil fell today and bond yields rose anyway. The November WTI contract (CLX26) settled at $89.38, down 3.48% on Monday's settlement, after Saudi Arabia resumed exports through its East-West pipeline, which carries crude to the Red Sea without passing through the Strait of Hormuz, and US and Iranian officials each met mediators to discuss reopening the strait (Yahoo Finance, CNBC). Iran's foreign minister, Abbas Araghchi, met Qatari mediators in New York and said he hoped for Washington's final response by Tuesday; a US official said there would be no agreement unless Iran's nuclear programme is addressed (Al Jazeera). The drop in oil did not bring yields down: the 10-year Treasury closed at 5.26%, up 2 bp on the day, and the 30-year at 5.59%, up 3 bp (US Treasury par curve, 29 Sep). Weak US data did not stop the rise either: the Conference Board's consumer confidence index fell to 81.9 in September from 88.6, far below the 89.0 expected, and August job openings came in at 7.10 million against 7.23 million expected (Yahoo Finance). Futures still put a 70.3% chance on 29 September on a Fed rise at the October meeting (CME FedWatch, via TheStreet).
US shares closed mixed. The S&P 500 fell 0.17% to 7,670.84 and the Dow 0.26%, while the Nasdaq 100 rose 0.21%. Coverage of technology shares centred on two pieces of AI news: Reuters reported details of Anthropic's draft prospectus for a stock market listing, including a $2 trillion valuation target, a 2025 net loss of $42 billion (most of it a non-cash charge) on revenue of about $4.6 billion, and $518 billion of commitments for cloud and computing capacity, and the Wall Street Journal reported that OpenAI had shelved its next frontier model, Astra, after it fell short in internal safety tests (Yahoo Finance, CNN). Utilities (+1.17%) were the strongest sector fund; energy (−0.90%), materials (−0.75%) and consumer staples (−0.52%) the weakest. Gold settled little changed at $4,179.70 (+0.27%) after Monday's 3.54% fall.
Europe was mixed and France was the weak spot. The CAC 40 fell 0.53% to 8,035.87 as the French 10-year yield rose above 4.80% for the first time since 2008, to 4.81%, while the German 10-year slipped to 3.62%; the gap between them, about 119 bp, is the widest since 2012 (Boursorama, Trading Economics). Investors pointed to French public debt of 119% of GDP in the second quarter and uncertainty over budget negotiations ahead of the 2027 presidential election (Boursorama, CNBC). The STOXX 600 closed down 0.09%, the DAX up 0.10% and the FTSE 100 down 0.45%. In Asia the Nikkei fell 0.60% and the Hang Seng 0.48%, Korea's Kospi lost 0.27% after Monday's 2.70% drop, and Shanghai edged up 0.18%.
Global Indices Snapshot
Americas
| Index | Level | Day Chg | Day Chg % | Source |
|---|---|---|---|---|
| S&P 500 | 7,670.84 | −12.85 | −0.17% | yfinance ^GSPC |
| Nasdaq 100 | 30,339.33 | +62.52 | +0.21% | yfinance ^NDX |
| Dow Jones | 51,349.92 | −131.59 | −0.26% | yfinance ^DJI |
| Brazil IBOV | 183,827.60 | +836.47 | +0.46% | yfinance ^BVSP |
Americas data reflects the 29 Sep close. The S&P 500 is 1.87% below its record of 7,816.70 and 0.40% above its 50-day average (7,641). The Nasdaq 100 is 1.37% below its record. The Dow is 2.72% below its 50-day average (52,783).
Europe
| Index | Level | Day Chg | Day Chg % | Source |
|---|---|---|---|---|
| Euro STOXX 600 | 638.08 | −0.60 | −0.09% | yfinance ^STOXX |
| CAC 40 | 8,035.87 | −42.61 | −0.53% | yfinance ^FCHI |
| DAX | 25,399.21 | +24.79 | +0.10% | yfinance ^GDAXI |
| FTSE 100 | 10,636.71 | −48.17 | −0.45% | yfinance ^FTSE |
| SMI (Swiss) | 13,912.19 | −30.72 | −0.22% | yfinance ^SSMI |
European data reflects today's close (29 Sep). All five indices are below their 50-day averages: the FTSE by 1.23%, the STOXX 600 by 1.57%, the DAX by 1.64%, the SMI by 2.42% and the CAC 40 by 4.09%. The CAC is also 2.50% below its 200-day average (8,242); the others are above theirs. The Euro STOXX 50 closed at 6,320.26, up 0.30%. In Paris, Legrand rose 6.08% after raising its 2030 targets on demand from data centres (Boursorama).
Asia-Pacific
| Index | Level | Day Chg | Day Chg % | Source |
|---|---|---|---|---|
| Nikkei 225 | 65,481.27 | −396.35 | −0.60% | yfinance ^N225 |
| Hang Seng | 24,523.57 | −118.94 | −0.48% | yfinance ^HSI |
| Shanghai Comp | 3,830.45 | +6.83 | +0.18% | yfinance 000001.SS |
| ASX 200 | 8,709.30 | +29.60 | +0.34% | yfinance ^AXJO |
| Kospi (Korea) | 6,870.81 | −18.93 | −0.27% | yfinance ^KS11 |
Asia-Pacific data reflects today's close (29 Sep).
Emerging Markets
| Index | Level | Day Chg % | Source |
|---|---|---|---|
| MSCI EM (EEM) | 67.40 | +0.30% | yfinance EEM |
| India Nifty 50 | 22,716.20 | −0.28% | yfinance ^NSEI |
| South Africa | 64.85 | +0.59% | yfinance EZA |
All three reflect the 29 Sep close. EEM rose in New York although its largest local markets had closed lower before New York opened (Hong Kong −0.48%, Korea −0.27%, India −0.28%); a US-listed fund keeps trading after those markets shut, so its price also carries what happens during New York hours.
Index Valuations & Investment Risk
Valuation Table
| Index | Trailing P/E (live) | 50-day avg | 100-day avg | 200-day avg |
|---|---|---|---|---|
| S&P 500 | 24.7x | 25.7x | — | — |
| Nasdaq 100 | 30.1x | 30.3x | — | — |
| Euro STOXX 600 | 17.6x | 18.1x | — | — |
| CAC 40 | 16.4x | 17.3x | — | — |
| DAX | 18.0x | 18.6x | — | — |
| FTSE 100 | 15.1x | 17.4x | — | — |
| Nikkei 225 | 21.8x | 21.7x | — | — |
| MSCI EM | 14.3x | 16.1x | — | — |
Averages of the daily trailing P/E readings recorded since 1 May 2026 (n = 99); shown for reference only.
Investment Risk Assessment for ETF Investors
United States (S&P 500 / Nasdaq ETFs)
The S&P 500's trailing P/E of 24.7x gives an earnings yield of 4.05% (1÷24.69). Against the 10-year Treasury at 5.26% (US Treasury par curve, 29 Sep), the earnings yield gap is −1.21 pp: a 10-year government bond pays more in income today than the index's earnings amount to per dollar invested. Against the real 10-year yield of 2.91% (US Treasury real curve, 29 Sep) the gap is +1.14 pp; the 2.35 pp difference between the two is the correction for company earnings growing with inflation while a bond coupon is fixed. Only the part of earnings paid out as dividends and buybacks reaches a holder as cash. The index is 1.87% below its record and 6.40% above its 200-day average (7,209), so its price has adjusted little to 10-year yields above 5.2%. The Nasdaq 100 at 30.1x has an earnings yield of 3.32%, 1.94 pp below the 10-year Treasury. Today's AI news is a reminder of how much of that valuation rests on the future profits of a few technology companies: the prospectus figures reported for Anthropic, an operating loss of more than $8 billion on revenue of about $4.6 billion, show how far spending on AI currently runs ahead of the income it brings in. (The reported net loss of $42 billion is larger because about $34 billion of it reflects a rise in the value of financing that can convert into shares, not money spent.)
Europe (STOXX 600 / CAC 40 / DAX ETFs)
The STOXX 600 at 17.6x gives an earnings yield of 5.69% (1÷17.56); against the 10-year Bund at 3.62% (Trading Economics, 29 Sep) the euro earnings yield gap is +2.07 pp, and against the euro-area real 10-year yield of 1.59% (see Real Yields below) it is +4.10 pp. The S&P 500 trades at a 41% P/E premium to the STOXX 600 (24.7x against 17.6x). Part of the difference between the US and euro gaps reflects different inflation and policy paths rather than different compensation for risk, which is why the real-yield versions are shown alongside. The CAC 40 at 16.4x is the cheapest of the three major euro indices and the weakest: 4.09% below its 50-day and 2.50% below its 200-day average. The reason is visible in the bond market: France now pays about 119 bp more than Germany to borrow for ten years, the widest gap since 2012, and more than Italy (4.61%). A euro investor in euro-quoted funds has no exchange-rate effect on the quoted value, but the constituents earn much of their profit abroad, so today's 0.48% fall in the euro against the dollar reaches their earnings, in this case favourably.
Japan (Nikkei / TOPIX ETFs)
The Nikkei ETF proxy trades at 21.8x, close to its average reading since May (21.7x). The Bank of Japan raised its policy rate to 1.25% on 18 September, its second rise this year after the 16 June move to 1.00%, and the 10-year JGB yield is 3.09% (Trading Economics, 29 Sep). The yen was unchanged near 157.4 per dollar. For a euro investor an unhedged Japan fund carries the yen's moves in full, so the choice between hedged and unhedged matters as much as the view on Japanese shares.
Emerging Markets (MSCI EM ETFs)
EEM trades at 14.3x, the cheapest of the eight indices in the table and below its own average reading since May (16.1x). It rose 0.30% in New York today even though its largest local markets had closed lower. Higher US yields hurt emerging markets mainly through their economies: companies and governments with dollar debt pay more, foreign money tends to leave, and local central banks come under pressure to raise their own rates, whatever currency the investor spends. For a euro holder the currency conversion partly offsets this, since the euro fell against the dollar today (−0.48%), which raises the euro value of dollar-priced holdings.
Overall Risk Score: - United States: High valuation risk / low margin of safety. A negative nominal earnings yield gap, an index 2% from its record, and 10-year yields still rising. - Europe: Moderate. Positive earnings yield gaps on both measures, but French borrowing costs at their highest since 2008 and a CAC below both its moving averages. - Japan: Moderate. Valuation at its recent average; the BOJ and the yen are the main risks. - Emerging Markets: Attractive relative valuation, with higher US yields and the unresolved Hormuz talks as the near-term headwinds.
US Economic Indicators (FRED - authoritative)
| Indicator | Current | Prior | Delta | Reference Date | FRED Series |
|---|---|---|---|---|---|
| CPI YoY % | 3.35% | 3.30% | +0.05 pp | Aug 2026 (prior Jul) | CPIAUCSL |
| Core CPI YoY % | 2.45% | 2.47% | −0.02 pp | Aug 2026 (prior Jul) | CPILFESL |
| Unemployment Rate | 4.1% | 4.1% | 0.0 pp | Aug 2026 (prior Jul) | UNRATE |
| Nonfarm Payrolls | +162k | +21k | +141k | Aug 2026 (prior Jul), monthly chg | PAYEMS |
| 10Y TIPS Real Yield | 2.91% | 2.90% | +1 bp | 29 Sep 2026 (prior 28 Sep) | DFII10 (US Treasury real curve) |
Headline inflation at 3.35% runs almost a point above core at 2.45%, the gap opened by energy prices. September's employment report is due on Friday 2 October.
Other economic releases today (Yahoo Finance):
| Release | Actual | Consensus | Prior |
|---|---|---|---|
| US Conference Board consumer confidence (Sep) | 81.9 | 89.0 | 88.6 |
| US JOLTS job openings (Aug) | 7.097m | 7.228m | 7.335m |
Both missed. The Conference Board said consumers' assessment of current business conditions turned negative for the first time since September 2024 (Yahoo Finance). Weak data would normally pull yields down; today they rose regardless.
Fixed Income & Bond Analysis
US Treasury yields in the tables come from the US Treasury's own daily feed and are the 29 September close. European, UK and Japanese yields are from Trading Economics, 29 September.
Policy Rates
| Central Bank | Rate | Source |
|---|---|---|
| Fed Funds (upper) | 4.00% | FRED DFEDTARU (29 Sep) |
| Fed Funds (lower) | 3.75% | FRED DFEDTARL (29 Sep) |
| Effective FFR | 3.88% | FRED DFF (28 Sep) |
| ECB Deposit Rate | 2.50% | FRED ECBDFR (29 Sep) |
| BOJ Policy Rate | 1.25% | Bank of Japan (raised 18 Sep 2026) |
| BOE Bank Rate | ~3.73% | SONIA/FRED IUDSOIA (25 Sep) |
The Fed raised its target range to 3.75–4.00% on 16 September, its first hike since 2023. The ECB deposit rate has been 2.50% since 10 September, its second hike this year after 17 June's move to 2.25%; on 29 September money markets priced about 100 bp more by late 2027, while Lagarde said the inflation rise has not yet produced significant knock-on effects in wages and other prices (Trading Economics). UK markets put about an 80% chance on 29 September on a Bank of England rise in November (Trading Economics).
Government Bond Yields
| Country | 2Y Yield | 10Y Yield | 30Y Yield | Day Chg (10Y) | Source |
|---|---|---|---|---|---|
| USA | 4.89% | 5.26% | 5.59% | +2 bp | US Treasury par curve (29 Sep) |
| Germany | 3.27% | 3.62% | 3.95% | −1 bp | web (Trading Economics, 29 Sep) |
| France | — | 4.81% | — | +3 bp | web (Trading Economics, 29 Sep) |
| UK | 4.77% | 5.41% | 5.93% | +1 bp | web (Trading Economics, 29 Sep) |
| Japan | — | 3.09% | — | −1 bp | web (Trading Economics, 29 Sep) |
| Italy | — | 4.61% | — | 0 bp | web (Trading Economics, 29 Sep) |
US day change is 29 Sep vs 28 Sep.
Yield Curve Spreads (US Treasury par curve, 29 Sep): - 10Y-2Y spread: +37 bp. Positive and moderately sloped, neither inverted nor steep: investors ask a modest extra yield to lend for ten years rather than two. - 10Y-3M spread: +101 bp. Firmly positive, not a recession signal. The 3-month bill at 4.25% is about 38 bp above the Fed funds midpoint of 3.875%, consistent with the 70% chance futures gave an October Fed rise on 29 September.
OAT-Bund Spread: the French 10-year at 4.81% against the Bund at 3.62% puts the spread at about 119 bp, some 4 bp wider than Monday's 115 bp and the widest since 2012 (Boursorama). Unlike Monday, when Italian yields rose by the same amount, today French yields rose while Italian ones held at 4.61% and German ones fell, so this move was specific to France. One other source quoted the French 10-year at 4.74% and the spread at 111 bp (ideal-investisseur), likely on a different benchmark bond; the Trading Economics and Boursorama figures agree with each other and are the ones used here.
Yield Curve Charts
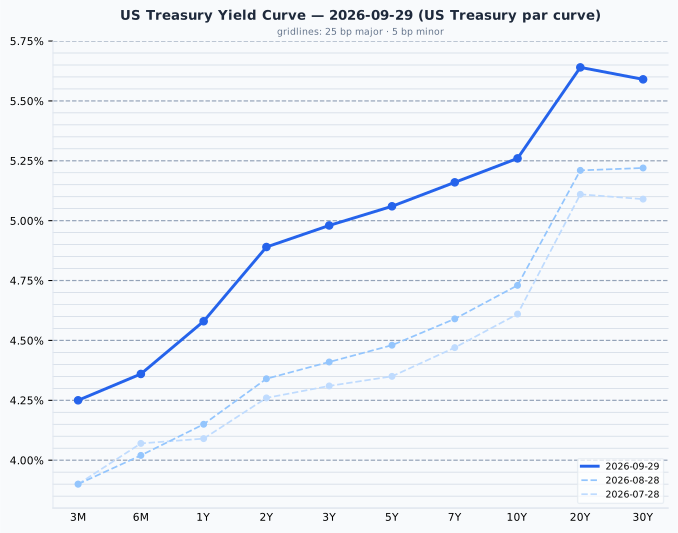
The US curve on 29 September rises from 4.25% at 3 months to 5.64% at 20 years, dipping slightly to 5.59% at 30 years. Since 31 August it has risen most at short and middle maturities (2-year from 4.34% to 4.89%, 10-year from 4.75% to 5.26%) and less at the long end (30-year from 5.25% to 5.59%), the pattern of a market pricing further Fed rises.
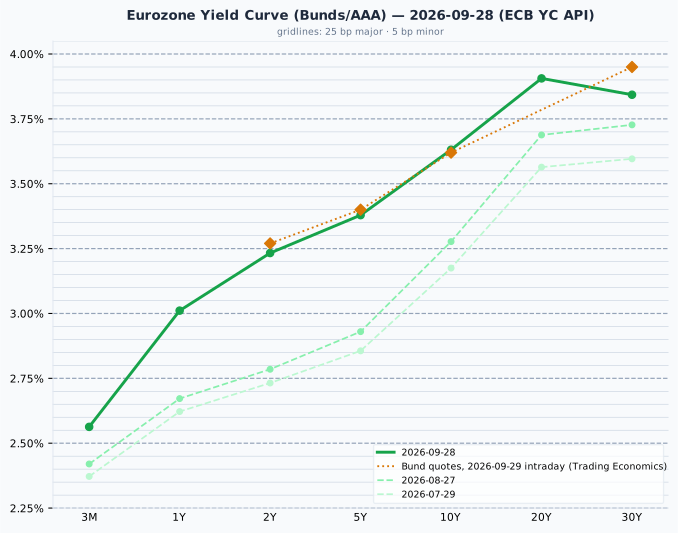
The euro AAA curve on 28 September slopes upward from 2.56% at 3 months to 3.91% at 20 years, dipping to 3.84% at 30 years. Since 28 August it has risen 43 bp at the 2-year (2.80% to 3.23%) and 35 bp at the 10-year (3.28% to 3.63%), led by the short end after the ECB's 10 September hike. Today's Bund quotes (amber) are within 4 bp of the plotted curve out to 10 years; the largest gap is 11 bp at 30 years (3.95% against 3.84%). The curve is the ECB's fitted AAA euro-area curve and the quotes are individual German bonds, which normally sit a few bp apart at the long end (the same 30-year gap was 17 bp on Monday), so this is a difference in construction rather than a rise today.
Credit Markets (from FRED, authoritative)
| Market | OAS | Obs. date | vs prior obs | Series ID |
|---|---|---|---|---|
| US Investment Grade | 83 bp | 28 Sep | +2 bp | BAMLC0A0CM |
| US High Yield | 302 bp | 28 Sep | +9 bp | BAMLH0A0HYM2 |
| Euro High Yield | 289 bp | 28 Sep | +10 bp | BAMLHE00EHYIOAS |
Change is 28 Sep vs 25 Sep.
Credit spreads are the 28 September close; today's session is not in them yet. On Monday's selloff in bonds and shares, the extra yield lenders demand from riskier US companies widened 9 bp to 302 bp, back inside the 300–500 bp range that is normal for it, though at its bottom edge. Euro high yield widened by a similar 10 bp to 289 bp. Investment grade at 83 bp is at the low end of its 80–150 bp normal range. The VIX was 16.07 on 28 September (FRED VIXCLS), a moderate reading, up from 14.21 on 22 September.
Real Yields (US and Euro Area)
| Region | Nominal 10Y | Expected inflation | Real 10Y | How the real yield is obtained |
|---|---|---|---|---|
| United States | 5.26% (29 Sep) | 2.35% (nominal − real, residual) | 2.91% (29 Sep) | Measured. Inflation-protected Treasuries (TIPS) trade, so the market quotes a real yield directly; expected inflation is the residual |
| Euro area | 3.63% (ECB AAA, 28 Sep) | 2.04% (ECB SPF, 2026 Q3, measured) | 1.59% (nominal − expected, residual) | Constructed. No euro inflation-linked benchmark is published, so a survey expectation is subtracted from the nominal yield |
Only the US real yield is a market price; the euro figure is derived from a survey and is the softer of the two. The US figure also contains a premium investors demand for bearing inflation risk, which a survey does not, and the survey looks five years ahead against the bond's ten. With the US leg dated 29 September and the euro leg 28 September, the 163 bp gap between US and euro nominal 10-year yields splits into about 31 bp of expected-inflation difference (2.35% against 2.04%) and about 132 bp of real-rate difference (2.91% against 1.59%): nearly all of it is a difference in real rates. The US real yield rose 1 bp on 29 September, from 2.90% on 28 September, against a 2 bp rise in the nominal yield, so expected inflation edged up 1 bp.
Why the US real-yield advantage is not a return a euro investor can capture
A real yield is real in its own currency: 2.91% is 2.91% above US inflation, not euro-area inflation. Hedging a Treasury back into euros removes the interest-rate difference through the forward exchange rate, so the hedged return ends up close to the euro bond's; left unhedged, the extra yield becomes a bet on the dollar rather than a bond decision. The gap reflects the two economies' different growth and policy settings, which is why it has persisted in every quarter since 2014.
Bond Portfolio Implications
- S&P 500 earnings yield gap: 4.05% (1÷24.69) − 5.26% = −1.21 pp nominal; +1.14 pp against the 2.91% real yield.
- Euro earnings yield gap: 5.69% (1÷17.56) − 3.62% (Bund) = +2.07 pp nominal; +4.10 pp against the 1.59% euro real yield.
These compare the income on offer today: a US investor can lock in 5.26% for ten years in Treasuries, against an earnings yield of about 4% on the S&P 500 that grows with profits but is only partly paid out. They say nothing about which asset will return more over the coming years.
A 10 bp rise in yields is an ordinary day's move. At the 29 September settled par yields it costs:
| Maturity | Yield | Modified duration | Loss for a 10 bp rise | Months of coupon lost |
|---|---|---|---|---|
| 2-year | 4.89% | 1.88 | 0.19% | 0.5 |
| 10-year | 5.26% | 7.70 | 0.77% | 1.7 |
| 30-year | 5.59% | 14.47 | 1.43% | 3.1 |
Par-bond figures at the 29 Sep settled yields.
Today's 2 bp rise at the 10-year cost a holder about 0.15%, about a third of a month's coupon. With the 2-year paying 4.89% for less than a quarter of the 10-year's price sensitivity, short maturities still offer most of the income for far less exposure while yields keep climbing on days when oil falls and the data disappoint.
Currencies & Commodities
Currencies
| Pair | Rate | Day chg % | Source |
|---|---|---|---|
| EUR/USD | 1.1319 | −0.48% | yfinance (19:37 CEST) |
| USD Index (DXY, ICE) | 101.59 | +0.39% | yfinance (19:28 CEST) |
| USD/JPY | 157.44 | +0.04% | yfinance (19:38 CEST) |
| GBP/USD | 1.3207 | −0.38% | yfinance (19:37 CEST) |
| USD/CHF | 0.8358 | +0.54% | yfinance (19:38 CEST) |
FX quotes as of 19:28–19:38 CEST; day change vs the previous 17:00 ET close.
The dollar rose against every currency in the table as the 10-year Treasury yield rose about 5 bp during the New York session. The euro fell 0.48% to 1.1319. The Swiss franc weakened most (−0.54% against the dollar). The yen was unchanged near 157.4.
Commodities
| Commodity | Price | Day Chg % | Ticker | Source |
|---|---|---|---|---|
| Brent Crude | 96.16 | −1.71% | BZ=F | yfinance |
| WTI Crude | 89.38 | −3.48% | CL=F | yfinance |
| Gold ($/oz) | 4,179.70 | +0.27% | GC=F | yfinance |
| Silver ($/oz) | 61.15 | −0.92% | SI=F | yfinance |
| Copper ($/lb) | 6.6035 | −0.45% | HG=F | yfinance |
| Nat Gas ($/MMBtu) | 3.011 | −3.06% | NG=F | yfinance |
Day changes are settlement-to-settlement: 29 Sep settlement vs 28 Sep settlement.
The table shows the December Brent contract (BZZ26), November WTI (CLX26), December gold, silver and copper, and November natural gas, the same contracts as Monday's briefing; none expires in the next three days. WTI fell more than Brent, widening the gap between them to $6.78 from $5.23 at Monday's settlements. Both crude contracts remain far below their 52-week highs (Brent $126.10, WTI $119.48) and well above their 52-week lows ($58.72 and $54.98).
Gold at $4,179.70 is 25.2% below its all-time high of $5,586.20 (29 January 2026) and 8.8% above its 52-week low of $3,842.80. Silver at $61.15 is 49.6% below its all-time high of $121.30, set the same day. Copper at $6.60 is slightly below its all-time high of $6.83, set on 22 September, 3.3% away. Natural gas at $3.01 sits in the lower part of its 52-week range ($2.48 to $7.83).
Crypto: not covered today.
Sector & Theme Highlights
US sector funds (Select Sector SPDRs, 29 Sep close): utilities (XLU) +1.17% led, followed by communication services (XLC) +0.26%, industrials (XLI) +0.21% and consumer discretionary (XLY) +0.14%. Technology (XLK) and real estate (XLRE), both −0.02%, were flat; health care (XLV) −0.31%, financials (XLF) −0.33%, consumer staples (XLP) −0.52%, materials (XLB) −0.75% and energy (XLE) −0.90% fell.
- Oil down, energy shares down: the fall in crude on the Saudi pipeline restart and renewed US-Iran contacts took energy shares with it, the reverse of how the Hormuz dispute has worked on the sector.
- AI spending under scrutiny: the reported Anthropic prospectus puts figures on what building frontier AI costs ($518 billion of computing commitments and an operating loss of more than $8 billion in 2025), and OpenAI's decision to hold back a model on safety grounds adds a question about how quickly new products reach customers. AMD agreed to buy World Labs for $8.2 billion (Yahoo Finance).
- French fiscal risk: a 10-year OAT above 4.80% for the first time since 2008 weighed on the CAC 40, which trailed the DAX by more than half a point.
- Data-centre demand in Europe: Legrand's 6.08% rise on higher 2030 targets shows the AI build-out still lifting European suppliers of electrical equipment.
Top Stories (Global)
- Oil falls as US-Iran contacts resume. Saudi Arabia restarted exports through its East-West pipeline, and Iran's foreign minister met Qatari mediators in New York, hoping for a final US response by Tuesday; the US says any deal must cover Iran's nuclear programme (Yahoo Finance, Al Jazeera). November WTI settled 3.5% lower at $89.38.
- Treasury yields keep rising despite weak data. The 10-year closed at 5.26%, up 2 bp, and the 30-year at 5.59%, even as consumer confidence dropped to 81.9 against 89.0 expected and job openings missed forecasts; 30-year mortgage rates neared 7.58%, the highest since November 2023 (Yahoo Finance).
- French 10-year above 4.80%, the first time since 2008; the spread over Germany reached about 119 bp, the widest since 2012, on budget worries ahead of the 2027 presidential election (Boursorama, CNBC).
- Anthropic's draft listing prospectus reported by Reuters: a $2 trillion valuation target, 2025 revenue of about $4.6 billion and a $42 billion net loss, of which about $34 billion was a non-cash charge on financing that can convert into shares, with warnings about risks from advanced AI; OpenAI shelved its Astra model after internal safety tests (Yahoo Finance, CNN).
- UK gilts near 19-year highs: the government sold bonds at a 5.383% yield, the highest at a sale since 1999, with markets pricing an 80% chance on 29 September of a Bank of England rise in November (Trading Economics).
- AMD buys World Labs for $8.2 billion (Yahoo Finance); Legrand rises 6.1% on higher 2030 targets (Boursorama).
Looking Ahead
- Wednesday 30 September: third estimate of US second-quarter GDP and August personal income and outlays, including the PCE price index the Fed targets (The Right Trader). The Bundesbank's calendar lists Germany's flash estimate of September inflation for the same day.
- Thursday 1 October: ISM manufacturing index and weekly jobless claims.
- Friday 2 October: US September employment report, the last major labour data before the October Fed meeting, where futures priced a 70% chance of a rise on 29 September.
- Middle East: whether Washington answers Iran's amended Hormuz proposal, and on what terms; oil and, through it, inflation expectations depend on it.
- France: budget negotiations and the OAT-Bund spread, now at its widest since 2012.
- Japan: the next BOJ meeting is on 28 October; the yen near 157 per dollar keeps the question of intervention open.
Market closures - Wednesday 30 September: Canada, National Day for Truth and Reconciliation (public holiday). - Saturday 3 October: Germany, German Unity Day (falls on a weekend; no trading-day closure). - Just beyond the window, Monday 5 October: South Korea, National Foundation Day (moved from Saturday 3 October).