2026 06 26
Global Financial Briefing — Friday, 26 June 2026
Market Overview
Today is a sharply risk-off session dominated by a violent Asian equity selloff. Japan's Nikkei 225 fell 4.2% and South Korea's Kospi plunged 5.8% (intraday lows reportedly reached 9% before emergency circuit breakers were triggered for the second time this week), dragged by a collapse in AI-linked technology shares. The catalysts were multiple: Apple announced price increases on Macs, iPads, and connected home devices, sending its shares down roughly 6% and raising fresh concerns about consumer demand and trade-cost pass-through; separately, AI bubble fears intensified following reports of further delays to high-profile IPO plans in the AI space. Samsung fell over 8% and SK Hynix dropped 9%, dealing a severe blow to Korea's semiconductor-heavy index. SoftBank Group plunged 12% in Tokyo, reflecting the broader anxiety about AI investment portfolio valuations.
European markets absorbed the Asia contagion with more composure, closing 0.2–1.3% lower. The DAX bore the sharpest losses among the major continental benchmarks, while the FTSE 100's defensive and commodity-heavy composition provided some cushion. Wall Street is trading sideways in early afternoon, with the S&P 500 essentially flat near 7,352 and the Nasdaq 100 shedding 0.9% — underperforming, as the tech-heavy index is more exposed to the AI repricing underway in Asia. Brazil's IBOV is a notable bright spot, up 0.8%, while oil tumbles 3.7–3.8%, underscoring the risk-off character of the day.
The macro backdrop is increasingly complex. US CPI reaccelerated to 4.17% YoY in May (from 3.28% in March), far above the Fed's 2% target, and markets are now pricing an 85% probability of at least one additional Fed rate hike before year-end. The Fed Funds target sits at 3.50–3.75%, but with the 10-year Treasury yield at 4.41% and May PCE data due today (consensus ~4.1% YoY), pressure on the Fed to re-tighten is building. Meanwhile, the Bank of Japan raised rates to 1% on June 16 — the highest since 1995 — amplifying concerns about yen carry-trade unwinding. Today's simultaneous selloff in Japanese equities and a move toward yen strength is consistent with that dynamic. Notably, the VIX closed at 18.89 on June 25 (FRED VIXCLS) — in the moderate 15–20 range — indicating that options markets are not yet pricing extreme fear despite the severity of the Asian moves. This credit and volatility market calm relative to equity market distress is a key divergence to watch.
Global Indices Snapshot
Americas
Americas data reflects intraday pricing as of approximately 15:41 ET — US markets open.
| Index | Level | Day Chg | Day Chg % | Source |
|---|---|---|---|---|
| S&P 500 | 7,357 | −5 | −0.07% | FRED SP500 + yfinance ^GSPC |
| Nasdaq 100 | 29,180 | −260 | −0.88% | yfinance ^NDX |
| Dow Jones | 51,792 | −129 | −0.25% | yfinance ^DJI |
| Brazil IBOV | 173,388 | +1,398 | +0.81% | yfinance ^BVSP |
S&P 500 level from FRED (Jun 25 close: 7,357.49); day change from yfinance intraday vs prior close.
Europe
European data reflects today's close (26 Jun).
| Index | Level | Day Chg | Day Chg % | Source |
|---|---|---|---|---|
| Euro STOXX 600 | 635.88 | −4.33 | −0.68% | yfinance ^STOXX |
| Euro STOXX 50 | 6,221.55 | −45.98 | −0.73% | yfinance ^STOXX50E |
| CAC 40 | 8,384.87 | −46.74 | −0.55% | yfinance ^FCHI |
| DAX | 24,671.22 | −323.61 | −1.30% | yfinance ^GDAXI |
| FTSE 100 | 10,508.02 | −21.87 | −0.21% | yfinance ^FTSE |
| SMI (Swiss) | 14,172.71 | −59.25 | −0.42% | yfinance ^SSMI |
Asia-Pacific
Asia-Pacific data reflects today's close (26 Jun), except where noted.
| Index | Level | Day Chg | Day Chg % | Source |
|---|---|---|---|---|
| Nikkei 225 | 69,360.88 | −3,005 | −4.15% | yfinance ^N225 |
| Hang Seng | 22,671.86 | −405.05 | −1.76% | yfinance ^HSI |
| Shanghai Comp | 4,027.27 | −93.02 | −2.26% | yfinance 000001.SS |
| ASX 200 | 8,764.2 | +15.5 | +0.18% | yfinance ^AXJO |
| Kospi (Korea) | 8,411.21 | −519.09 | −5.81% | yfinance ^KS11 |
| India Nifty 50 ‡ | 24,056.0 | — | — | yfinance ^NSEI |
‡ India Nifty 50: data reflects 25 Jun close — yfinance not yet updated to today's session.
Emerging Markets
| Index | Level | Day Chg % | Source |
|---|---|---|---|
| MSCI EM (EEM) | 67.18 | −1.15% | yfinance EEM |
| India Nifty 50 ‡ | 24,056 | — | yfinance ^NSEI |
| South Africa | (not retrieved) | — | yfinance ^J203 |
‡ India: reflects Jun 25 close.
Index Valuations & Investment Risk
Valuation Table
| Index | Trailing P/E (live) | Hist avg trailing P/E (†) | Premium to hist avg |
|---|---|---|---|
| S&P 500 | 26.23x (SPY) | ~16–18x | +54% |
| Nasdaq 100 | 32.59x (QQQ) | ~25–30x | +18% |
| Euro STOXX 600 | 18.12x (EXSA.DE) | ~15–17x | +13% |
| CAC 40 | 17.53x (CAC.PA) | ~14–16x | +17% |
| DAX | 18.02x (EXS1.DE) | ~15–17x | +13% |
| FTSE 100 | 17.72x (ISF.L) | ~13–15x | +27% |
| Nikkei 225 | 23.56x (1321.T) | ~20–22x | +12% |
| MSCI EM | 17.79x (EEM) | ~13–15x | +27% |
(†) Hist avg trailing P/E: static long-run reference constants. Bold = >20% above historical average.
Trailing P/E sourced from yfinance trailingPE on ETF proxies (SPY, QQQ, EXSA.DE, CAC.PA, EXS1.DE, ISF.L, 1321.T, EEM).
Premium computed as: (live P/E ÷ hist avg midpoint − 1) × 100%. Historical midpoints: S&P 17x, Nasdaq 27.5x, STOXX 16x, CAC 15x, DAX 16x, FTSE 14x, Nikkei 21x, EM 14x.
Investment Risk Assessment for ETF Investors
United States (S&P 500 / Nasdaq ETFs)
The S&P 500 is trading at 26.23x trailing earnings — 54% above its long-run historical average — placing it in historically stretched territory. The earnings yield is (1÷26.23) = 3.81%. With the 10-year Treasury yielding 4.41% (FRED DGS10, 2026-06-24), the Equity Risk Premium (ERP = 3.81% − 4.41%) is −0.60%, meaning bonds currently yield more than equities on an earnings basis. This is a structurally warning signal for forward equity returns. The 10-year TIPS real yield stands at 2.23% (FRED DFII10), confirming that the real risk-free rate is elevated, which compresses fair-value multiples.
The S&P 500 sits at 7,357, between its 50-day MA (7,357 — essentially flat) and 52-week high of 7,621. The index is tracking its 50-day MA almost exactly, suggesting near-term support is thin. The Nasdaq 100 at 32.59x earnings (18% above historical average) shows less extreme absolute stretch than the S&P but faces greater AI sentiment risk given today's events. Concentration risk in mega-cap tech remains high, and today's session illustrates how quickly those positions can devalue.
Risk score: High valuation risk / low margin of safety.
Europe (STOXX 600 / CAC 40 / DAX ETFs)
European valuations are elevated but less stretched than the US. STOXX 600 at 18.12x is 13% above its long-run average. The earnings yield is (1÷18.12) = 5.52%, and against a German Bund 10Y yield of 2.85%, the European ERP = +2.67% — positive and meaningful. European equities continue to offer a premium over bonds, unlike the US. The CAC 40 at 17.53x (17% above average) and DAX at 18.02x (13% above average) reflect a similar picture.
For French investors, the OAT-Bund spread data was not retrieved today (ECB API unavailable, no specific web search result). The CAC 40 closed at 8,384.87, below its 52-week high of 8,642.23 and above both the 50-day MA (8,201) and 200-day MA (8,128) — technically healthy. Currency hedging considerations apply for non-EUR investors, as EUR/USD at 1.147 (FRED, Jun 18) remains near multi-year highs.
Risk score: Moderate — elevated valuations, positive ERP cushion, geopolitical risks remain.
Japan (Nikkei / TOPIX ETFs)
The Nikkei's 4.15% single-day decline today brought it to 69,361 — still well above its 50-day MA (63,828) and 200-day MA (54,140), reflecting the extraordinary year-to-date run. However, the BOJ's June 16 rate hike to 1% — the highest since 1995 — is beginning to create turbulence. A stronger yen reduces the competitiveness of Japanese exporters and triggers carry-trade unwinding. At 23.56x trailing earnings (12% above its historical average of ~21x), the Nikkei is not obviously cheap. Investors in unhedged Nikkei ETFs face additional currency risk if the yen continues to strengthen. Corporate governance reforms remain a structural positive, but today's selloff is a sharp reminder of tail risk.
Risk score: Moderate to high — monetary policy pivot risk compounding elevated valuation.
Emerging Markets (MSCI EM ETFs)
MSCI EM (EEM) at 17.79x trailing P/E is 27% above its historical average of ~14x — elevated for a category that historically offered a valuation discount to developed markets. Today's 1.15% intraday decline in EEM reflects the broader risk-off session. China's Shanghai Composite fell 2.26%, Hang Seng fell 1.76%, and Korea's Kospi collapsed 5.81%, all weighing on the EM aggregate. With the Fed potentially hiking again, a stronger dollar would create additional headwinds for EM assets through capital outflows and dollar-denominated debt costs.
Risk score: High — elevated valuations, China risk, potential Fed headwinds.
Disclaimer: This is financial information, not personalised investment advice. Past valuations do not guarantee future returns. Consult a financial advisor before investing.
US Economic Indicators (FRED — authoritative)
| Indicator | Current | Prior | Delta | Reference Date | FRED Series |
|---|---|---|---|---|---|
| CPI YoY % | 4.17% | 3.78% | +0.39pp | May 2026 | CPIAUCSL |
| Core CPI YoY % | 2.82% | 2.74% | +0.08pp | May 2026 | CPILFESL |
| Unemployment Rate | 4.3% | 4.3% | 0.0pp | May 2026 | UNRATE |
| Nonfarm Payrolls | 159,001K | 158,829K | +172K | May 2026 | PAYEMS |
| 10Y TIPS Real Yield | 2.23% | — | — | 2026-06-24 | DFII10 |
FRED macro data is monthly; latest available is May 2026 (published mid-June). NFP delta = month-over-month change in thousands.
The CPI acceleration to 4.17% YoY in May — up sharply from 2.43% in February — is the most consequential domestic macro development of recent weeks. Headline inflation has more than doubled over four months, driven partly by energy tariff pass-through. Core inflation at 2.82% is rising more gradually but is also trending up. With NFP at +172K in May, the labour market remains resilient, giving the Fed room to act. Today's PCE data release (consensus ~4.1% headline YoY, ~3.4% core per Wells Fargo) will be closely watched as the Fed's preferred inflation gauge. A hot print would reinforce the market's pricing of another hike.
Other economic releases today (June 26):
Also scheduled today: US Q1 GDP (third revision), University of Michigan Consumer Sentiment (final), Durable Goods Orders (May preliminary), and Kansas City Fed readings. Actual figures were not yet available. These releases collectively present the risk of significant intraday volatility in US markets.
Fixed Income & Bond Analysis
Policy Rates
| Central Bank | Rate | Source |
|---|---|---|
| Fed Funds (upper) | 3.75% | FRED DFEDTARU (2026-06-26) |
| Fed Funds (lower) | 3.50% | FRED DFEDTARL (2026-06-26) |
| Effective FFR | 3.63% | FRED DFF (2026-06-24) |
| ECB Deposit Rate | 2.25% | FRED ECBDFR (2026-06-26) |
| BOJ Policy Rate | 1.00% | web search (hiked June 16, 2026) |
| BOE Bank Rate | ~3.73% (SONIA) | FRED IUDSOIA (2026-06-24) |
The BOJ's move to 1% on June 16 — a 25bp hike, the first since December — represents the most significant central bank action in recent weeks. Board member Tamura has signalled a path toward a neutral rate of ~2%. The Fed Funds rate at 3.50–3.75% is now below current inflation (4.17%), implying a negative real Fed Funds rate at the short end — a notable policy inconsistency.
Government Bond Yields
| Country | 2Y Yield | 10Y Yield | 30Y Yield | Source |
|---|---|---|---|---|
| USA | 4.11% | 4.41% | 4.86% | FRED (2026-06-24) |
| Germany | (n/r) | 2.85% | (n/r) | web search (2026-06-26) |
| France | (n/r) | (n/r) | (n/r) | not retrieved |
| UK | 4.18%* | 4.76%* | (n/r) | web search (*as of Jun 18) |
| Japan | (n/r) | 2.61% | (n/r) | web search (2026-06-26) |
| Italy | (n/r) | (n/r) | (n/r) | not retrieved |
Note: UK gilt yields are from June 18 and should be treated as indicative only.
Yield Curve Spreads (FRED pre-computed):
- 10Y–2Y spread: +31 bps (FRED T10Y2Y, 2026-06-25) — curve is gently positively sloped. No longer inverted. The return to positive slope suggests markets have repriced away from near-term recession fears, consistent with a re-accelerating inflation narrative rather than a hard landing.
- 10Y–3M spread: +56 bps (FRED T10Y3M, 2026-06-25) — also positive, supporting the view that markets no longer see imminent recession. This is a meaningful shift from the sustained inversion seen through much of 2023–2024.
The Japan 10Y JGB at 2.61% is notable — after decades near zero, Japanese bond yields have risen sharply since the BOJ exited yield curve control. The JGB 10Y is now not far below the US 10Y (4.41%), which compresses the traditional interest rate differential that underpinned yen carry trades.
OAT-Bund Spread: (Not retrieved — ECB API unavailable, no specific search result obtained.)
Yield Curve Charts
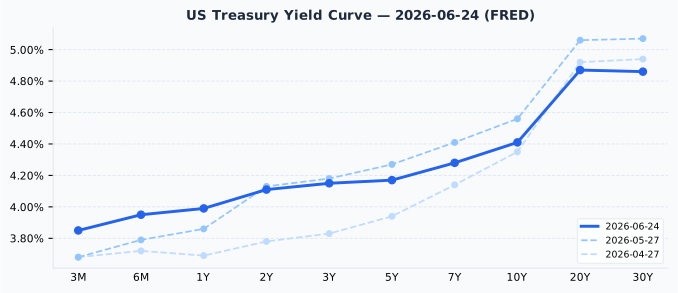
The US Treasury curve shows a gentle positive slope from 3.85% at 3 months to a peak of 4.87% at 20 years, with a slight inversion between 20Y and 30Y (4.86%). Compared to one month ago (May 27), the 10-year has rallied from 4.56% to 4.41% — a 15bp bull flattening at the long end — suggesting safe-haven demand has crept into Treasuries even as the short end remains anchored near the Fed Funds rate.
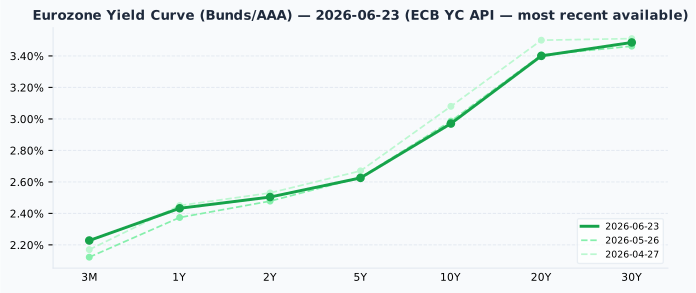
Note: ECB API returned 503 today. Eurozone chart uses the most recent available ECB curve (June 23). The ECB curve shows a steeply upward-sloping structure from 2.23% at 3 months to 3.49% at 30 years, significantly flatter at the long end than the US curve. Compared to one month ago (late May), long-end ECB yields (10Y–30Y) are broadly unchanged but the short end has drifted slightly higher as ECB rate cut expectations have been pushed out.
Credit Markets (from FRED — authoritative)
FRED OAS spreads are in percentage points; converted to basis points below.
| Market | OAS Spread | Characterisation | FRED Series | Date |
|---|---|---|---|---|
| US Investment Grade | 76 bps | Historically tight | BAMLC0A0CM | 2026-06-25 |
| US High Yield | 278 bps | Historically very tight | BAMLH0A0HYM2 | 2026-06-25 |
| Euro High Yield | 264 bps | Historically tight | BAMLHE00EHYIOAS | 2026-06-25 |
All three credit spread series are at historically compressed levels. US HY at 278 bps is well below the 300–500 bps "normal" range, and US IG at 76 bps sits just below the 80–150 bps normal range. This signals deep complacency in credit markets — a sharp contrast with today's Asian equity distress. Credit spreads typically lead or coincide with equity stress during systemic risk events; their current tightness suggests the market does not yet view today's selloff as systemic.
Bond Portfolio Implications
The US earnings yield–bond yield gap remains negative: S&P 500 ERP = (1÷26.23) − 4.41% = −0.60%. For the first time in over a decade, investment-grade Treasuries yield more than the implied earnings of the S&P 500. This is the clearest quantitative case for bonds over equities on a pure yield comparison, though equity upside through earnings growth, buybacks, and AI productivity gains must also be considered.
In Europe, the picture is more favourable for equities: Euro STOXX ERP = (1÷18.12) − 2.85% = +2.67%. European ETF investors receive a meaningful equity risk premium over German Bunds, making European equities relatively more attractive than US equities on this metric.
Duration risk remains elevated. A hypothetical 100bp rise in yields would generate approximately 8–9% price losses on a 10-year bond. With CPI at 4.17% and the Fed possibly hiking, short-duration strategies or inflation-linked bonds (TIPS) are better positioned than long-duration nominal fixed income in this environment. The 10Y TIPS real yield of 2.23% (FRED DFII10) is the highest in many years, making TIPS attractive on a real return basis.
Currencies & Commodities
Currencies:
| Pair | Rate | Source |
|---|---|---|
| EUR/USD | 1.1470 | FRED DEXUSEU (2026-06-18) |
| USD Index | 120.40 | FRED DTWEXBGS (2026-06-18) |
| USD/JPY | 161.60 | web search (2026-06-26) |
| GBP/USD | 1.3229 | web search (2026-06-26) |
| USD/CHF | 0.8076 | web search (2026-06-26) |
EUR/USD and USD Index are lagged by one week (FRED H.10 release lag). USD/JPY, GBP/USD, USD/CHF from web search as of today.
The yen at 161.60 per dollar remains at historically weak levels despite today's risk-off pressures and the BOJ rate hike to 1%. This may reflect that the dollar is also strengthening broadly (USD Index 120.40) on sticky US inflation and rate hike expectations. Sterling at 1.3229 and the Swiss franc at CHF 0.8076 per dollar (CHF relatively strong) reflect the broader flight from risk assets. EUR/USD at 1.147 reflects a stronger euro versus the dollar over the past year — consistent with narrowing interest rate differentials as the ECB cuts while the Fed holds or re-hikes.
Commodities (all from yfinance front-month futures):
| Commodity | Price | Day Chg % | Ticker | ATH | % from ATH | Source |
|---|---|---|---|---|---|---|
| Brent Crude | $72.61 | −3.83% | BZ=F | $147.43 | −51% | yfinance |
| WTI Crude | $69.28 | −3.67% | CL=F | $147.27 | −53% | yfinance |
| Gold ($/oz) | $4,080.5 | +0.81% | GC=F | $5,586.2 | −27% | yfinance |
| Silver ($/oz) | $59.31 | +0.87% | SI=F | $121.30 | −51% | yfinance |
| Copper ($/lb) | $6.18 | +0.68% | HG=F | $6.65 | −7.1% | yfinance |
| Nat Gas ($/MMBtu) | $3.302 | +0.21% | NG=F | $15.78 | −79% | yfinance |
Oil is falling sharply today on risk-off demand concerns, with Brent crude at $72.61 (down 3.83%) and WTI at $69.28 (down 3.67%). Both remain 50%+ below their all-time highs of $147.
Gold is trading at $4,080.50 per troy ounce — 27% below its all-time high of $5,586.20 (which was also the 52-week high, meaning gold peaked in the past year and has since corrected substantially). The modest +0.81% gain today reflects safe-haven demand in the Asian selloff, but the overall context is a significant pullback from recent peaks.
Silver at $59.31 is 51% below its all-time high of $121.30 (which matches the 52-week high). The precious metal has retrenched sharply from its peak.
Copper at $6.18 per pound is 7.1% below its all-time high of $6.65 — a meaningful but not alarming gap. Given that copper is closely correlated with global industrial activity, its relative resilience today (+0.68%) against the broad market selloff suggests markets are not yet pricing a deep global recession.
Natural gas at $3.302 per MMBtu is 58% below its 52-week high of $7.83 and 79% below its all-time high of $15.78 — reflecting the normalisation of the European energy crisis premium.
Crypto: No significant moves (>3%) flagged in today's web searches.
Sector & Theme Highlights
AI bubble concerns / semiconductor selloff: The dominant theme today. Samsung, SK Hynix, SoftBank, and by extension the broader Korean and Japanese markets all fell sharply on fears that AI investment was outpacing monetisation. Markets are asking whether the extraordinary rally in AI infrastructure spending translates into near-term earnings. OpenAI IPO delay reports fuelled additional sentiment damage.
Apple and consumer electronics tariff pass-through: Apple's decision to raise prices on Macs, iPads, and connected home devices signals that tariff costs are being passed to consumers rather than absorbed. This has dual implications: margin protection for Apple itself (potentially positive for earnings) but demand risk and broader inflation concern.
BOJ and yen carry-trade unwind: The BOJ's rate hike to 1% on June 16 is now producing observable market effects. Japan's elevated interest rates relative to prior years are reducing the attractiveness of yen-funded carry trades. SoftBank's exposure — as a leveraged investor in global tech — makes it particularly vulnerable to both the direct valuation compression from higher rates and any yen appreciation.
US inflation re-acceleration: With CPI at 4.17% YoY (May) and Core PCE expected around 3.4% YoY, the Fed is increasingly likely to re-tighten. This is a significant macro shift: after cutting rates from 5.25% to 3.50–3.75%, the Fed may now need to reverse course. Equity markets in the US are so far taking this relatively calmly (S&P flat today), but bond markets are already pricing in the adjustment.
European resilience: Europe's defensive tilt (FTSE 100 −0.21%, CAC 40 −0.55%) relative to Asia is noteworthy. With ECB rates at 2.25% and European valuations more reasonable than the US, European equities offer a better starting point for risk-adjusted returns. The Euro STOXX 600 remains below its 52-week high of 642.09 but above both its 50-day MA (621.02) and 200-day MA (597.09) — a technically constructive setup.
Top Stories (Global)
- Asia tech selloff — Kospi −5.8%, Nikkei −4.2%: Korean markets hit a circuit breaker (second time this week) as Samsung (−8%) and SK Hynix (−9%) led losses on AI bubble fears and Apple price hike announcements. South Korean financial regulator imposed emergency trading halts.
- BOJ at 1% — highest since 1995: The June 16 rate decision continues to reverberate. SoftBank −12% today as its highly leveraged AI investment portfolio faces a dual headwind from higher borrowing costs and AI sentiment deterioration.
- Apple raises hardware prices: Mac, iPad, and connected home device prices raised — shares fell ~6% as markets weigh demand elasticity vs tariff cost pass-through.
- US CPI at 4.17% (May) — Fed re-hike now priced: Market pricing reflects 85% probability of at least one additional Fed rate hike before end-2026. Today's PCE release is the key data point.
- Oil plunges −3.7%: WTI at $69.28 and Brent at $72.61 as risk-off sentiment weighs on demand expectations. Both crude benchmarks have now given back months of gains.
- Gold holds safe-haven bid (+0.81%): At $4,080/oz, gold is providing modest portfolio diversification benefits, though it remains 27% below its all-time high.
- World Bank flags global growth risks: The World Bank's June 2026 Global Economic Prospects report (published this month) flags elevated inflation and debt concerns in emerging markets.
Looking Ahead
Next 1–5 trading days (Jun 29 – Jul 3):
| Date | Event |
|---|---|
| Mon 29 Jun | US PCE reaction / Monday open — risk of gap move if today's PCE surprises |
| Mon 29 Jun | Euro Area flash CPI (Jun) — key ahead of ECB July meeting |
| Tue 30 Jun | Quarter-end rebalancing / window dressing (last day of Q2) |
| Tue 30 Jun | Japan Industrial Production (May) |
| Wed 1 Jul | US ISM Manufacturing PMI (Jun) |
| Wed 1 Jul | OPEC+ production meeting watch |
| Thu 2 Jul | US ADP Employment (Jun) |
| Fri 3 Jul | US Nonfarm Payrolls (Jun) — key rate hike signal |
| Fri 3 Jul | US Independence Day observed — markets close (per holiday calendar) |
Upcoming market closures (from holiday calendar — next 5 days): - 3 Jul 2026 (Fri): US Independence Day — NYSE/Nasdaq closed. - Canada Day (1 Jul) — TSX closed. - No closures in GB, DE, FR, JP, AU, CH, KR, BR for this period.
Key watch: - Today's US PCE and Michigan Consumer Sentiment prints (intraday) - Fed communications following PCE release - BOJ Governor speeches — any signalling on pace of further hikes - Samsung/SK Hynix earnings pre-announcements expected next week - Q2 earnings season commences in mid-July (S&P 500 banks lead)
Sources: FRED (Federal Reserve Economic Data); yfinance MCP (equity index and commodity data); ECB Yield Curve API (unavailable today); web search (bond yields, FX, BOJ rate, market news). FRED series cited inline. Web-sourced data labelled with date of retrieval. All figures reflect data available as of 26 Jun 2026.