2026 07 10
Global Financial Briefing — Friday, 10 July 2026
Market Overview
Global equities are pressing higher into the weekend, led by an AI-and-semiconductor bid that is overpowering a simultaneous, and increasingly hard-to-ignore, bond-market warning. US tech is the epicentre: Meta Platforms and Micron both jumped after Meta detailed plans to begin manufacturing a custom AI chip in September and unveiled an update to its Muse Spark AI platform, while SK Hynix's Nasdaq ADS debut — a $26.5bn raise, one of the largest listings of the year — opened roughly 14% above its offer price and helped drive Kospi to a ~2.5% gain and Hang Seng to its best week in over a year. The S&P 500 (7,575.77, +0.43%) is trading less than 1% below its all-time high, and the Nasdaq 100 (29,835.72, +0.37%) is within 3% of its own record — both firmly in the upper part of their 52-week ranges. Volatility remains contained despite the crosscurrents below: the VIX sits at 15.84 (FRED VIXCLS, 2026-07-09), in the low-to-moderate band, suggesting options markets are not yet pricing meaningful near-term equity risk from the bond-market and geopolitical tension described next.
The counter-current is fixed income. Renewed US strikes in Iran have reignited Strait of Hormuz risk, pushing oil higher and driving long-dated sovereign yields to multi-decade extremes outside the US: UK 10-year gilts have touched their highest level since June on Bank of England rate-hike bets, and Japan's 10-year JGB yield is sitting near its highest since 1997. US headline CPI has also been accelerating sharply — from 2.39% y/y in January to 4.17% y/y in May — even as the Fed holds its target range at 3.50–3.75%, a combination that is starting to look more like a stagflation risk than a soft landing. US labour data is still resilient on the surface (initial claims fell to 215,000, below consensus) but the pace of payroll growth has clearly decelerated (+57k in June vs +129k in May).
Valuations are a genuine tension point for equity investors here: US trailing P/E multiples (SPY ~27.2x, QQQ ~32.2x) are running 17–60% above long-run historical averages, and the US equity risk premium versus the 10-year Treasury has turned modestly negative — a combination that has historically preceded softer forward returns, even if it says little about near-term direction. Meanwhile gold and silver, despite enormous investor attention this cycle, are trading 26% and 50% below their respective all-time highs — a reminder that "elevated" and "at records" are not the same thing across asset classes right now.
Global Indices Snapshot
Americas
US and Brazil markets are still in session (intraday, not yet closed) — S&P 500/Nasdaq/Dow data as of ~15:36 ET; Ibovespa as of ~16:21 local.
| Index | Level | Day Chg | Day Chg % | Source |
|---|---|---|---|---|
| S&P 500 | 7,575.77 | +32.13 | +0.43% | yfinance ^GSPC |
| Nasdaq 100 | 29,835.72 | +108.62 | +0.37% | yfinance ^NDX |
| Dow Jones | 52,671.48 | +184.07 | +0.35% | yfinance ^DJI |
| Brazil IBOV | 177,577.67 | +4,835.55 | +2.80% | yfinance ^BVSP |
Europe
| Index | Level | Day Chg | Day Chg % | Source |
|---|---|---|---|---|
| Euro STOXX 600 | 641.10 | +0.23 | +0.04% | yfinance ^STOXX |
| Euro STOXX 50 | 6,269.97 | -14.30 | -0.23% | yfinance ^STOXX50E |
| CAC 40 | 8,338.97 | +12.35 | +0.15% | yfinance ^FCHI |
| DAX | 25,067.09 | -51.18 | -0.20% | yfinance ^GDAXI |
| FTSE 100 | 10,497.29 | +24.84 | +0.24% | yfinance ^FTSE |
| SMI (Swiss) | 14,235.09 | +19.79 | +0.14% | yfinance ^SSMI |
European data reflects today's close (10 Jul).
Asia-Pacific
| Index | Level | Day Chg | Day Chg % | Source |
|---|---|---|---|---|
| Nikkei 225 | 68,557.73 | +813.88 | +1.20% | yfinance ^N225 |
| Hang Seng | 24,175.12 | +144.94 | +0.60% | yfinance ^HSI |
| Shanghai Comp | 3,996.16 | -40.43 | -1.00% | yfinance 000001.SS |
| ASX 200 | 8,806.00 | +43.50 | +0.50% | yfinance ^AXJO |
| Kospi (Korea) | 7,475.94 | +184.03 | +2.52% | yfinance ^KS11 |
Asia-Pacific data reflects today's close (10 Jul).
Emerging Markets
| Index | Level | Day Chg % | Source |
|---|---|---|---|
| MSCI EM (EEM) | 66.84 | +0.08% | yfinance EEM |
| India Nifty 50 | 24,206.90 | +1.02% | yfinance ^NSEI |
| South Africa (EZA) | 63.92 | +1.01% | yfinance EZA |
India Nifty 50 and South Africa data reflect today's close (10 Jul); MSCI EM (EEM ETF) trades on US markets and is intraday.
Index Valuations & Investment Risk
Valuation Table
| Index | Trailing P/E (live) | Hist avg trailing P/E (†) | Premium/discount |
|---|---|---|---|
| S&P 500 | 27.15x | ~16-18x | +59.7% |
| Nasdaq 100 | 32.21x | ~25-30x | +17.1% |
| Euro STOXX 600 | 18.56x | ~15-17x | +16.0% |
| CAC 40 | 17.52x | ~14-16x | +16.8% |
| DAX | 18.32x | ~15-17x | +14.5% |
| FTSE 100 | 17.56x | ~13-15x | +25.4% |
| Nikkei 225 | 22.31x | ~20-22x | +6.2% |
| MSCI EM | 17.22x | ~13-15x | +23.0% |
(†) Hist avg trailing P/E: static long-run reference constants.
Trailing P/E (live): yfinance trailingPE on ETF proxies (SPY, QQQ, EXSA.DE, CAC.PA, EXS1.DE, ISF.L, 1321.T, EEM).
Premium/discount computed vs the historical-average midpoint; bold = >20% above historical average (elevated).
Investment Risk Assessment for ETF Investors
United States (S&P 500 / Nasdaq ETFs) SPY's trailing P/E of 27.15x sits ~60% above the S&P 500's long-run average of 16-18x — historically stretched territory. Earnings yield is (1÷27.15388) = 3.68%, versus the 10-year Treasury at 4.56% (FRED DGS10, 2026-07-08): the equity risk premium is -0.88%, i.e. negative — Treasuries currently out-yield the earnings yield on the index, a configuration that has historically warned of subdued forward equity returns (though it says nothing about near-term direction). QQQ's premium (+17.1%) is smaller but still above its own long-run band. The index is trading less than 1% below its all-time high and above both its 50- and 200-day moving averages, so momentum remains intact even as valuation cushion has eroded. Real yields (FRED DFII10, 2.31%, 2026-07-08) remain historically elevated, which is a headwind for further multiple expansion, and heavy concentration in a small number of AI-linked mega-caps (Meta, Micron, and peers driving today's gains) adds idiosyncratic risk on top of the macro picture.
Europe (STOXX 600 / CAC 40 / DAX ETFs) EXSA.DE trailing P/E of 18.56x is ~16% above its historical band, but that is a materially smaller premium than the US. Earnings yield is (1÷18.557106) = 5.39%; using the ECB AAA euro-area 10Y yield (3.13%, ECB YC API, 2026-07-09) as the closest available risk-free proxy, the euro-area equity risk premium is +2.26% — still comfortably positive, and a meaningfully better valuation cushion than the US on this metric. Non-EUR investors should note EUR/USD (FRED DEXUSEU, 1.1448, 2026-07-02) currency exposure on top of equity risk, and Strait-of-Hormuz-driven oil volatility is a live geopolitical risk for energy-sensitive European sectors.
Japan (Nikkei / TOPIX ETFs) 1321.T trailing P/E of 22.31x is only ~6% above its historical band — the cheapest of the major developed markets on a relative basis. However, the BOJ's rate path is now a genuine risk factor: having hiked to 1.00% on 16 June 2026 (the first move to 1% since 1995), further hikes toward the ~2% "neutral" level flagged by board member Naoki Tamura would pressure both JGB prices (10Y JGB yield is already near a 1997 high) and unhedged yen returns for foreign holders. JPY currency-hedging decisions matter more than usual in this environment.
Emerging Markets (MSCI EM ETFs) EEM's trailing P/E of 17.22x is ~23% above its historical band — a smaller absolute multiple than developed markets but a larger premium to its own history, so the traditional "EM valuation discount to DM" argument is less clean-cut than usual right now. China (Shanghai Composite -1.0% today, still ~35% below its all-time high) remains a drag on the aggregate, while Korea (+2.5% today on the SK Hynix listing) and India (+1.0%) are pulling the other way.
Overall Risk Score (qualitative, not financial advice): - US large-cap: High valuation risk / low margin of safety — negative ERP, ~60% P/E premium to history. - Europe / Japan: Moderate — smaller valuation premiums, positive ERP in Europe, but currency and rate risk live. - Emerging Markets: Moderate — mixed regional picture, smaller absolute P/E but elevated premium to own history.
Disclaimer: This is financial information, not personalised investment advice. Past valuations do not guarantee future returns. Consult a financial advisor before investing.
US Economic Indicators (FRED - authoritative)
| Indicator | Current | Prior | Delta | Reference Date | FRED Series |
|---|---|---|---|---|---|
| CPI YoY % | 4.17% | 3.78% | +0.39pp | 2026-05-01 | CPIAUCSL |
| Core CPI YoY % | 2.82% | 2.74% | +0.08pp | 2026-05-01 | CPILFESL |
| Unemployment Rate | 4.2% | 4.3% | -0.1pp | 2026-06-01 | UNRATE |
| Nonfarm Payrolls chg | +57k | +129k | -72k | 2026-06-01 | PAYEMS |
| 10Y TIPS Real Yield | 2.31% | 2.30% | +0.01pp | 2026-07-08 | DFII10 |
Headline CPI has accelerated sharply over the past five months — from 2.39% y/y in January to 4.17% y/y in May — while the Fed has held its target range steady at 3.50-3.75% (FRED DFEDTARL/DFEDTARU). That combination, alongside a clear deceleration in payroll growth (+57k in June vs +129k in May) and a still-low unemployment rate (4.2%), is a genuinely mixed macro signal rather than a clean "goldilocks" picture. Note FRED macro data lags 4-6 weeks; the CPI print above is for May.
Other economic releases today (web search): US initial jobless claims for the week ended 4 July fell to 215,000, below the 223,000 consensus and down from 217,000 prior — a subdued, resilient reading. No other major scheduled US PMI/GDP/PPI releases were confirmed for today via web search.
Fixed Income & Bond Analysis
Policy Rates
| Central Bank | Rate | Source |
|---|---|---|
| Fed Funds (upper) | 3.75% | FRED DFEDTARU |
| Fed Funds (lower) | 3.50% | FRED DFEDTARL |
| Effective FFR | 3.62% | FRED DFF (2026-07-08) |
| ECB Deposit Rate | 2.25% | FRED ECBDFR (2026-07-10) |
| BOJ Policy Rate | 1.00% | web search (hiked 25bps 2026-06-16, effective 2026-06-17) |
| BOE Bank Rate | ~3.73% | FRED IUDSOIA (SONIA proxy, 2026-07-08) |
Government Bond Yields
| Country | 2Y Yield | 10Y Yield | 30Y Yield | Source |
|---|---|---|---|---|
| USA | 4.21% | 4.56% | 5.06% | FRED (2026-07-08) |
| Germany (AAA euro-area proxy) | 2.61% | 3.13% | 3.63% | ECB YC API (2026-07-09) |
| France | (not retrieved) | (not retrieved) | — | web — search skipped (ECB curve satisfied European coverage) |
| UK | (not retrieved) | 4.95% | — | web search |
| Japan | — | 2.82% | — | web search |
| Italy | (not retrieved) | (not retrieved) | — | web — search skipped |
Note: the ECB YC API curve is a AAA-rated euro-area composite (a close Bund proxy), not the French OAT or Italian BTP curve specifically — France/Italy sovereign spreads are not covered separately today, so the OAT-Bund spread is (not retrieved).
Yield Curve Spreads (FRED pre-computed): - 10Y-2Y spread: +0.38% / 38bps (FRED T10Y2Y, 2026-07-09) — not inverted; modestly positive, though still well below the ~75bps+ levels historically associated with a "steep" curve. - 10Y-3M spread: +0.71% / 71bps (FRED T10Y3M, 2026-07-09) — also positive, consistent with a market no longer pricing near-term recession risk via the front end.
Both spreads have normalised well clear of inversion, but the shape is closer to "flat-to-modestly-positive" than genuinely steep — consistent with a market that expects the Fed to hold rather than cut aggressively while long yields drift higher on inflation and oil-driven term-premium concerns.
OAT-Bund Spread: not available today (see note above).
Yield Curve Charts
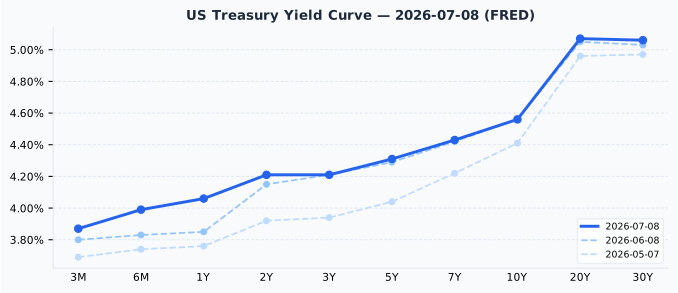
The US curve is upward-sloping across its full length with no inversion segment, gently steepening from the 3M to the 10Y point before flattening slightly into the 20Y/30Y long end. Versus a month ago (2026-06-08), the front end (3M-1Y) has risen 15-20bps while the belly and long end are roughly flat to modestly higher — a bear-flattening-then-re-steepening pattern consistent with the market pricing a "higher for longer" Fed alongside rising inflation expectations, rather than imminent cuts.
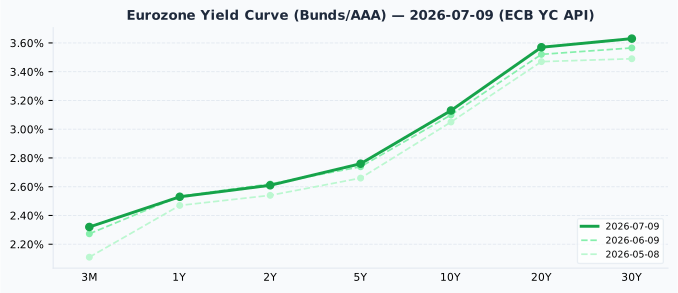
The eurozone AAA curve is also upward-sloping throughout, with a steeper long end (10Y-30Y) than the US curve relative to its front end. Versus a month ago (2026-06-09), yields are up modestly across the curve (roughly 3-5bps at most points), a smaller move than the US front-end shift — European rate expectations have been comparatively more stable even as UK gilts and JGBs have moved sharply on oil-driven inflation concerns.
Credit Markets (from FRED — authoritative)
| Market | OAS Spread | Series ID |
|---|---|---|
| US Investment Grade | 76bps | BAMLC0A0CM (2026-07-08) |
| US High Yield | 270bps | BAMLH0A0HYM2 (2026-07-08) |
| Euro High Yield | 256bps | BAMLHE00EHYIOAS (2026-07-08) |
Both US IG (76bps, vs a ~80-150bps normal band) and US HY (270bps, vs a ~300-500bps normal band) are trading historically tight — below their typical ranges — signalling continued credit-market complacency and strong risk appetite rather than any sign of stress. Euro HY (256bps) is similarly tight. This is consistent with the equity market's risk-on tone today, but tight spreads also mean credit offers little cushion if the oil/inflation shock now hitting rates markets broadens into a genuine growth scare.
Bond Portfolio Implications
With the US equity risk premium negative (-0.88%, see valuation section) and real yields elevated (DFII10 at 2.31%), high-quality bonds are arguably offering more attractive risk-adjusted income than they have in some time relative to US equities — a genuine change from the post-2010 regime. The euro-area picture is less stretched (ERP +2.26%), so the "bonds vs equities" trade-off is more equity-favourable in Europe than in the US right now.
Duration risk remains material: a 100bp rise in yields implies roughly an 8-9% price loss on a 10-year bond, and today's action in UK gilts and JGBs — both pushing to multi-decade yield highs on oil-driven inflation fears — is a live example of that risk crystallising outside the US. Investors leaning into duration to capture current yield levels should weigh that against the risk of further term-premium widening if the Strait of Hormuz situation escalates further.
Currencies & Commodities
Currencies:
| Pair | Rate | Source |
|---|---|---|
| EUR/USD | 1.1448 | FRED DEXUSEU (2026-07-02) |
| USD Index | 120.69 | FRED DTWEXBGS (2026-07-02) |
| USD/JPY | 161.70 | web search (2026-07-10) |
| GBP/USD | 1.3448 | web search (2026-07-10) |
| USD/CHF | 0.8034 | web search (2026-07-10) |
Note: FRED's EUR/USD and USD Index series lag to 2 July; more recent web-sourced pairs (JPY, GBP, CHF) reflect today's session.
Commodities (all from yfinance MCP front-month futures):
| Commodity | Price | Day Chg % | Ticker | Source |
|---|---|---|---|---|
| Brent Crude | $76.15/bbl | -0.20% | BZ=F | yfinance |
| WTI Crude | $71.65/bbl | -0.60% | CL=F | yfinance |
| Gold ($/oz) | $4,110.50 | -0.73% | GC=F | yfinance |
| Silver ($/oz) | $60.06 | -1.13% | SI=F | yfinance |
| Copper ($/lb) | $6.28 | +0.29% | HG=F | yfinance |
| Nat Gas ($/MMBtu) | $2.94 | -2.39% | NG=F | yfinance |
Gold, despite being one of the most-watched assets this cycle, is trading 26% below its all-time high of $5,586.20 (both the all-time and 52-week high, set within the past year) — a meaningful pullback that "elevated" or "near-record" language would misrepresent. Silver tells a similar story: at $60.06 it is 50% below its all-time high of $121.30. WTI and Brent crude remain far off their historical peaks (-51% and -48% from ATH respectively) even after today's Iran-related geopolitical bid — today's modest daily declines (-0.6%, -0.2%) suggest the oil market is not yet pricing a severe supply disruption. Copper, at just 5.5% below its all-time high, is the commodity trading closest to its record among this group.
Crypto: no moves exceeding the 3% notability threshold were surfaced in today's search results; omitted.
Sector & Theme Highlights
AI/semiconductor capex and infrastructure remains the dominant global theme: Meta's custom AI chip plans and Muse Spark platform update, Micron's rally, and SK Hynix's blockbuster $26.5bn Nasdaq ADS listing (up ~14% on debut) are driving outsized gains in US and Korean tech specifically, and lifting Kospi (+2.5%) and Hang Seng (best week in over a year) as regional beneficiaries. On the other side of the ledger, the Strait of Hormuz/Iran risk theme is repricing global rates and energy markets simultaneously — UK gilts and Japanese JGBs are both at multi-decade yield highs on oil-driven inflation concern, even as spot oil prices themselves remain far below their historical peaks. European telecom saw a notable single-stock event: Vodafone Group surged after French telecom billionaire Xavier Niel built a ~16% stake (~$5.9bn), a sign of ongoing consolidation appetite in the sector.
Top Stories (Global)
- Meta Platforms detailed plans to begin manufacturing a custom AI chip from September and unveiled a major update to its Muse Spark AI platform; shares +4.7%, with Micron +4.5% on related AI-capex optimism.
- SK Hynix priced its Nasdaq ADS offering at $149, raising $26.5bn — one of the largest listings of the year — and opened roughly 14% above that price on debut.
- Vodafone Group surged 12.8% after French telecom billionaire Xavier Niel disclosed a ~16% stake (~$5.9bn), becoming the company's largest shareholder.
- Renewed US strikes in Iran have reignited Strait of Hormuz supply-risk premium in oil markets and cast doubt on the durability of a prior peace-deal framework; global 2026 oil demand is now projected to decline year-over-year for the first time since 2020.
- UK 10-year gilt yields rose to their highest level since June 2026 (~4.95%) on Bank of England rate-hike bets amid the oil-driven inflation scare.
- Japan's 10-year JGB yield is trading near its highest level since 1997 (~2.82%) on the same oil/inflation dynamic, adding pressure on the BOJ's rate path.
- US initial jobless claims fell to 215,000 for the week ended 4 July, below the 223,000 consensus — continued labour-market resilience even as monthly payroll growth has slowed.
Looking Ahead
Key events/closures in the next 1-5 trading days: - 14 July 2026: France — Bastille Day (market closure). - Ongoing watch: BOJ policy path — board commentary (Naoki Tamura) has flagged further gradual hikes toward the ~2% "neutral" level; watch for any acceleration given the current inflation/yield backdrop. - 17 July 2026: South Korea — Constitution Day (market closure). - 20 July 2026: Japan — Marine Day (market closure). - Geopolitical: Strait of Hormuz/Iran developments remain the key swing factor for oil, global rates, and risk sentiment into next week. - Earnings: US Q2 earnings season is underway; watch for continued AI-capex commentary from mega-cap tech following today's Meta/Micron/SK Hynix-driven moves.
No US, UK, German, Swiss, Canadian, Brazilian, Australian, or Indian market closures were found in the holiday calendar within the next 30 days (data for India's 2026 holiday calendar was unavailable).