2026 10 15
Global Financial Briefing — Thursday, 15 October 2026
Figures reflect the 15 Oct close wherever close data exists. FX quotes and the French, UK, Japanese and Italian bond yields are evening quotes; other figures are dated inline. The US Treasury curve is the 15 Oct close; the euro AAA curve is the ECB's 14 Oct curve, the latest it had published.
Market Overview
Asia's chip stocks collapsed. South Korea's Kospi fell 7.57% to 5,554.22, its lowest close since 7 April, after trading on the main board was halted for 20 minutes at 12:38 when the fall passed 8%; Samsung Electronics lost 9.48% and SK hynix 11.06%, and foreign investors sold a net 3.62 trillion won (about $2.7 billion) of Korean shares (Korea JoongAng Daily). It was the Kospi's seventh fall in a row since its 2 October close of 7,003.74, and it now stands 20.70% below that level. Japan's Nikkei 225 fell 4.90% to 64,425.95, with chip-testing equipment maker Advantest down about 14% and SoftBank Group down about 9% (Japan Times, TradingView, The Standard). Three worries came together: that Chinese memory maker CXMT's expanding output will push chip prices down, that the heavy spending on artificial intelligence will not pay off (US cloud-computing company CoreWeave fell 15.5% on Wednesday over its debts, with its bonds yielding about 15%), and that Wednesday's US inflation figures make a further Fed rate rise more likely (Korea JoongAng Daily). The selling came on the same day Taiwan's TSMC, which manufactures chips for most of the AI chip designers, reported third-quarter profit of NT$763.1 billion, up 68.7% on a year earlier and above the NT$740.8 billion analysts expected (TSMC filing; LSEG estimate).
US producer prices then rose far faster than expected: prices charged by US businesses rose 1.3% in September, against about 0.5% forecast, the largest monthly rise since March 2022, and 6.3% on a year earlier, with energy up 10.8% in the month (BLS). Retail sales rose 0.8% against 0.3% forecast, but petrol stations accounted for much of it: the "control group" of sales that excludes cars, petrol, building materials and restaurants, and feeds into GDP, rose only 0.1% against 0.3% expected. Treasuries rallied anyway, as investors sold technology shares and bought government bonds (CNBC). The 10-year yield settled at 5.10%, 9 bp lower on the day, the 30-year at 5.43% (−9 bp) and the 5-year at 4.91% (−9 bp), while the 3-month bill was unchanged at 4.28% (US Treasury par curve, 15 Oct). US shares split: the Dow rose 1.08% and the S&P 500 0.33%, while the Nasdaq 100 closed almost flat (−0.05%) as money moved out of chip and AI stocks into consumer, value and smaller-company shares (ts2.tech, Pomegra). Health care (+1.86%) led the sector funds; energy (−1.58%) and technology (−0.65%) fell most. The dollar gave back most of Wednesday's gain: the ICE index fell 0.43% and the euro rose 0.47% to $1.1210.
As on Wednesday, Europe closed higher overall, with investors moving from technology into steadier sectors. ASML was down almost 5% at midday while telecoms and other defensive shares rose (dpa-AFX via ARIVA), so the technology-heavy Euro STOXX 50 fell 0.36% while the broader STOXX 600 rose 0.38%. The Swiss SMI, dominated by drug makers and food companies, rose 1.55%, the FTSE 100 1.08% and the CAC 40 0.78%. Euro-area bond yields followed Treasuries down: the German 10-year fell about 5 bp to 3.41% and the French 10-year about 9 bp to 4.79%, narrowing France's extra borrowing cost over Germany to 138 bp from 142 bp on Wednesday (Trading Economics). UK GDP grew 0.1% in August against a forecast fall of 0.1%, after 0.4% in July, which supports the case for a Bank of England rate rise in November (Trading Economics).
Global Indices Snapshot
Americas
| Index | Level | Day Chg | Day Chg % | Source |
|---|---|---|---|---|
| S&P 500 | 7,744.06 | +25.12 | +0.33% | yfinance ^GSPC |
| Nasdaq 100 | 29,935.59 | −15.22 | −0.05% | yfinance ^NDX |
| Dow Jones | 52,177.69 | +556.19 | +1.08% | yfinance ^DJI |
| Brazil IBOV | 204,324.27 | −2,181.71 | −1.06% | yfinance ^BVSP |
Americas data reflects the 15 Oct close.
The S&P 500 is 0.48% above its 50-day average, 6.56% above its 200-day average and 1.28% below its 52-week high of 7,844.52. The Nasdaq 100 is 0.21% above its 50-day average and 4.55% below its 52-week high. The Dow is 0.61% below its 50-day average and 4.69% below its 52-week high of 54,744.33; Walmart rose about 4% (World Today News) while Nvidia fell 1.84%. CoreWeave recovered from a 9.5% fall in the morning to close 5.94% higher after Nvidia chief executive Jensen Huang said he was optimistic about the company (ts2.tech). Brazil's Ibovespa fell 1.06% and is 2.57% below its 52-week high ahead of the presidential runoff on 25 October.
Europe
| Index | Level | Day Chg | Day Chg % | Source |
|---|---|---|---|---|
| Euro STOXX 600 | 640.16 | +2.41 | +0.38% | yfinance ^STOXX |
| CAC 40 | 7,934.70 | +61.59 | +0.78% | yfinance ^FCHI |
| DAX | 25,382.62 | +84.01 | +0.33% | yfinance ^GDAXI |
| FTSE 100 | 10,840.35 | +115.49 | +1.08% | yfinance ^FTSE |
| SMI (Swiss) | 14,349.51 | +219.58 | +1.55% | yfinance ^SSMI |
European data reflects today's close (15 Oct).
The Euro STOXX 50 of the largest euro-area companies fell 0.36% to 6,168.26, the only major European index in the red, because it holds more of the chip makers that were sold, ASML above all. At midday ASML was down almost 5%; Nordea was down 6% after saying it would pause share buybacks while the ECB reviews its capital, Ericsson jumped after third-quarter results well above forecasts, and Zurich Insurance rose 2.4% after Jefferies raised its price target (dpa-AFX via ARIVA, 12:05 CEST). The SMI and the FTSE 100, both weighted towards drug makers, consumer staples and other businesses whose profits depend little on the economic cycle, rose most; the FTSE is 1.36% below its 52-week high of 10,989.50. The CAC 40 added 0.78% to Wednesday's 0.58% rise but remains the weakest of the major European indices against its trend: 3.59% below its 50-day average, 3.53% below its 200-day average and 5.72% above the bottom of its 52-week range (7,505.27 to 8,755.03). The STOXX 600 is 0.70% below its 50-day average and the DAX 1.43% below.
Asia-Pacific
| Index | Level | Day Chg | Day Chg % | Source |
|---|---|---|---|---|
| Nikkei 225 | 64,425.95 | −3,318.35 | −4.90% | yfinance ^N225 |
| Hang Seng | 24,062.72 | −251.45 | −1.03% | yfinance ^HSI |
| Shanghai Comp | 3,707.48 | −59.75 | −1.59% | yfinance 000001.SS |
| ASX 200 | 8,719.70 | −8.20 | −0.09% | yfinance ^AXJO |
| Kospi (Korea) | 5,554.22 | −454.59 | −7.57% | yfinance ^KS11 |
Asia-Pacific data reflects today's close (15 Oct).
Korea and Japan took the brunt because their indices are heavy in chip makers and chip-equipment suppliers. The Kospi touched 5,450.81 during the session; it is now 17.00% below its 50-day average. Retail investors bought a net 1.69 trillion won and institutions 1.29 trillion won against the foreign selling (Korea JoongAng Daily). The Nikkei's fall is its sixth in a row since its 6 October close of 70,683.98, leaving it 8.85% lower over those sessions and 2.72% below its 50-day average; it is 11.54% below its 52-week high of 72,831.73. In China the Shanghai Composite fell 1.59% after touching a new 52-week low of 3,674.82 during the session, and is 0.89% above it; the Hang Seng fell 1.03%, its technology sub-index more (down 2.94% early in the session, Saxo). Australia's ASX 200 was barely changed.
Emerging Markets
| Index | Level | Day Chg % | Source |
|---|---|---|---|
| MSCI EM (EEM) | 63.96 | −0.67% | yfinance EEM |
| India Nifty 50 | 22,997.35 | +1.66% | yfinance ^NSEI |
| South Africa | 65.01 | +2.73% | yfinance EZA |
All rows reflect the 15 Oct close; MSCI EM (EEM) and South Africa (EZA) are New York-listed funds.
Yesterday EEM fell 2.05% in New York before Asia had reacted to the US inflation figures; today Asia's local markets caught up, Korea by far the most, while EEM fell a further 0.67%. Part of today's Asian fall had therefore already been priced in New York on Wednesday. India went the other way, the Nifty rising 1.66%, though it remains 2.60% below its 50-day average and 3.69% above its 52-week low. The South Africa fund rose 2.73% and is 20.49% below its 52-week high.
Index Valuations & Investment Risk
Valuation Table
| Index | Trailing P/E (live) | 50-day avg | 100-day avg | 200-day avg |
|---|---|---|---|---|
| S&P 500 | 24.5x | 25.2x | 26.1x | — |
| Nasdaq 100 | 27.9x | 30.1x | 31.4x | — |
| Euro STOXX 600 | 17.7x | 17.8x | 18.1x | — |
| CAC 40 | 16.7x | 16.9x | 17.2x | — |
| DAX | 18.0x | 18.4x | 18.4x | — |
| FTSE 100 | 16.8x | 16.8x | 17.3x | — |
| Nikkei 225 | 16.9x | 21.5x | 22.4x | — |
| MSCI EM | 13.7x | 15.5x | 16.5x | — |
Averages of the daily trailing P/E readings recorded since 1 May 2026 (n = 111); shown for reference only.
Nikkei 225 (1321.T): averages exclude the 0.23x readings of 6 to 8 October, which were data errors (n = 107).
Investment Risk Assessment for ETF Investors
United States (S&P 500 / Nasdaq ETFs)
The S&P 500's trailing P/E of 24.5x gives an earnings yield of 4.08% (1÷24.50). Against the settled 10-year Treasury yield of 5.10% (US Treasury par curve, 15 Oct) the earnings yield gap is −1.02 pp: a 10-year government bond pays more income than the index's earnings come to per dollar invested. Against the real 10-year yield of 2.78% (US Treasury real curve, 15 Oct) the gap is +1.30 pp; the 2.32 pp between the two is the correction for company earnings growing with inflation while a bond coupon is fixed. Only the part of earnings paid out as dividends and buybacks reaches a holder as cash. The Nasdaq 100 at 27.9x has an earnings yield of 3.59%, 1.51 pp below the 10-year Treasury. The risk for US funds today is less the yield than the AI spending behind the technology companies' valuations: CoreWeave's debts and Korea's chip sell-off are questioning whether that spending will earn a return, even as TSMC's revenue, above forecasts, and its fourth-quarter guidance show the demand for AI chips is still growing. A producer price rise of 1.3% in a month also keeps a Fed rate rise at the 27–28 October meeting possible: the odds briefly topped 50% after Wednesday's consumer prices before falling back below 30% by early 15 October, before the producer price figures (Saxo), and San Francisco Fed President Mary Daly said more rises are likely needed but there is no urgency to decide this month (Saxo).
Europe (STOXX 600 / CAC 40 / DAX ETFs)
The STOXX 600 at 17.7x gives an earnings yield of 5.65% (1÷17.71); against the euro AAA 10-year yield of 3.51% (ECB YC API, 14 Oct) the euro earnings yield gap is +2.14 pp, and against today's 10-year Bund at 3.41% (Trading Economics) it is +2.24 pp. Against the euro-area real 10-year yield of 1.47% (see Real Yields below) it is +4.17 pp. The S&P 500 trades at a 38.4% P/E premium to the STOXX 600 (24.5x against 17.7x). Part of the difference between the US and euro gaps reflects different inflation and policy paths rather than different compensation for risk, which is why the real-yield versions are shown alongside. The CAC 40 at 16.7x has an earnings yield of 5.99% (1÷16.68), 1.20 pp above the French 10-year yield of 4.79%, wider than Wednesday's 1.15 pp as French yields fell. The DAX at 18.0x yields 5.56%, 2.15 pp above the Bund, and the FTSE 100 at 16.8x yields 5.95%, 0.58 pp above the 10-year gilt at 5.37%. Europe's broad indices weathered the chip sell-off because they hold fewer technology companies than the US or Korea, but ASML lost almost 5% at midday and the Euro STOXX 50, which holds more technology, fell 0.36%: a European fund is less exposed to the AI spending risk, not immune to it. The first full vote on the French budget's revenue measures is on 20 October and Moody's reviews France's rating on 23 October (FXStreet, 13 Oct). A euro investor in euro-quoted funds has no exchange-rate effect on the quoted value, but the constituents earn much of their profit abroad, so today's 0.47% rise in the euro against the dollar slightly reduces the euro value of those foreign earnings if it lasts.
Japan (Nikkei / TOPIX ETFs)
The Nikkei proxy's P/E fell to 16.9x with the index (earnings yield 5.91%), 2.98 pp above the 10-year Japanese government bond, which fell about 7 bp to 2.93%, its lowest in more than a month (Trading Economics, Saxo). Today showed how much the Nikkei depends on chip-equipment and technology companies: Advantest fell about 14% and SoftBank Group about 9%, and the index lost 4.90% while Australia's, with few such companies, was barely changed. The Bank of Japan raised its policy rate to 1.25% on 18 September, from the 1.00% set in June (as cited in the 13 Oct briefing), and meets next on 29–30 October. Finance Minister Katayama signalled readiness to act in the currency market (Saxo); the yen rose only 0.12% against the dollar to 158.10 while the euro rose 0.47%, so a euro investor in an unhedged Japan fund lost about 0.35% more on the currency today, on top of the 4.90% fall in the index.
Emerging Markets (MSCI EM ETFs)
EEM trades at 13.7x, the cheapest index in the table and a 44.0% discount to the S&P 500. Korea shows the limit of that cheapness: the Kospi had already fallen 14.21% from its 2 October close by Wednesday, and lost another 7.57% today because its largest companies are memory-chip makers whose profits depend on chip prices, which expanding Chinese output threatens. A low P/E says little if the profits it is calculated on are about to fall. For a euro investor, EEM's 0.67% fall in dollars is about 1.1% in euros, because the euro rose against the dollar today. The dollar's fall itself helps emerging markets in the usual way: countries and companies with dollar debts pay less to service them.
Overall Risk Score: - United States: High valuation risk / low margin of safety. A negative nominal earnings yield gap, a 10-year yield above 5%, producer prices rising 1.3% in a month and a Fed meeting in under two weeks; the Nasdaq 100 at 27.9x is exposed to any doubt about the return on AI spending. - Europe: Moderate. Positive earnings yield gaps on both measures, a P/E well below the US and less technology in the indices; against that, oil above $100, an ECB that markets expect to raise rates in December after its 10 September rise to 2.50%, and a French budget without a stable majority. - Japan: Moderate. A P/E of 16.9x after today's fall, but an index whose moves depend on a few chip and technology stocks, BOJ rate rises and the yen near 158 per dollar. - Emerging Markets: Attractive relative valuation, with Korea's chip makers, China's weak share market (near its 52-week low), oil and Brazil's 25 October runoff as the near-term risks.
US Economic Indicators (FRED - authoritative)
| Indicator | Current | Prior | Delta | Reference Date | FRED Series |
|---|---|---|---|---|---|
| CPI YoY % | 3.72% | 3.35% | +0.37 pp | Sep 2026 (prior Aug) | CPIAUCSL |
| Core CPI YoY % | 2.57% | 2.45% | +0.12 pp | Sep 2026 (prior Aug) | CPILFESL |
| Unemployment Rate | 4.2% | 4.1% | +0.10 pp | Sep 2026 (prior Aug) | UNRATE |
| Nonfarm Payrolls | +29k | +133k | −104k | Sep 2026 (prior Aug), monthly chg | PAYEMS |
| 10Y TIPS Real Yield | 2.78% | 2.84% | −6 bp | 15 Oct 2026 (prior 14 Oct) | DFII10 (US Treasury real curve) |
Consumer prices rose 3.72% on a year earlier in September (Wednesday's release), with core inflation at 2.57%. Today's producer prices show where consumer prices may go next: the 1.3% monthly rise was mostly energy, but producer prices excluding food, energy and trade margins also rose 0.5% in the month and 5.0% on a year earlier, up from 0.3% and 4.8% in August (BLS). Against that, hiring slowed to 29,000 jobs in September and spending outside petrol was weak, so the Fed faces rising prices and a cooling economy at once.
Other economic releases today (web search)
| Release | Actual | Consensus | Prior | Note |
|---|---|---|---|---|
| US PPI final demand, Sep, MoM | +1.3% | +0.5–0.6% | +0.5% | YoY 6.3% (Aug 5.6%); energy +10.8% MoM, goods +2.6%, services +0.8% (BLS) |
| US PPI ex food, energy, trade services, Sep | +0.5% | — | +0.3% | YoY 5.0% (Aug 4.8%) (BLS) |
| US retail sales, Sep, MoM | +0.8% | +0.3% | +1.3% (revised up) | Petrol stations +6.4%; control group +0.1% against +0.3% expected (CNN, Babypips) |
| UK GDP, Aug, MoM | +0.1% | −0.1% | +0.4% | Beat the forecast contraction (Trading Economics) |
| US crude oil stocks, week to 9 Oct | −8.6m bbl | — | — | EIA, released Thursday; stocks at 415.6m bbl (OilPrice.com) |
A producer price index measures what businesses receive for their goods and services, so it moves before the consumer prices the Fed targets. A 10.8% monthly rise in energy prices is the war-driven oil price feeding through; the 0.5% rise excluding energy is the part that suggests other costs are following. The bond market's reaction, yields falling, says investors put more weight today on the risk to growth (weak underlying spending, the sell-off in technology) than on these prices. In the UK, growth that held up despite high energy and borrowing costs strengthens the case for a Bank of England rate rise in November, ahead of the government's 28 October budget (Trading Economics).
Fixed Income & Bond Analysis
Policy Rates
| Central Bank | Rate | Source |
|---|---|---|
| Fed Funds (upper) | 4.00% | FRED DFEDTARU (15 Oct 2026) |
| Fed Funds (lower) | 3.75% | FRED DFEDTARL (15 Oct 2026) |
| Effective FFR | 3.88% | FRED DFF (14 Oct 2026) |
| ECB Deposit Rate | 2.50% | FRED ECBDFR (15 Oct 2026) |
| BOJ Policy Rate | 1.25% | web search (raised 18 Sep 2026) |
| BOE Bank Rate | ~3.73% (SONIA/FRED) | FRED IUDSOIA (13 Oct 2026) |
The Fed raised its target range to 3.75–4.00% at its 15–16 September meeting and meets next on 27–28 October. The ECB raised its deposit rate to 2.50% on 10 September, its second rise this year after June's move to 2.25%; Lagarde has said the energy-driven rise in inflation has not yet spread across the euro-area economy, while Governing Council member Gediminas Šimkus said a rise this month is still possible, and markets expect one in December (Trading Economics).
Government Bond Yields
| Country | 2Y Yield | 10Y Yield | 30Y Yield | Day Chg (10Y) | Source |
|---|---|---|---|---|---|
| USA | 4.77% | 5.10% | 5.43% | −9 bp | US Treasury par curve (15 Oct 2026) |
| Euro area AAA (ECB) | 3.09% | 3.51% | 3.75% | +2 bp | ECB YC API (14 Oct 2026) |
| Germany | 3.08% | 3.41% | 3.78% | −5 bp | web (Trading Economics, 15 Oct 2026) |
| France | — | 4.79% | — | −9 bp | web (Trading Economics, 15 Oct 2026) |
| UK | 4.76% | 5.37% | 5.84% | −3 bp | web (Trading Economics, 15 Oct 2026) |
| Japan | — | 2.93% | — | −7 bp | web (Trading Economics, 15 Oct 2026) |
| Italy | — | 4.49% | — | −7 bp | web (Trading Economics, 15 Oct 2026) |
The USA row is the settled 15 Oct curve, its day change against 14 Oct. The Euro area AAA row's day change is 14 Oct against 13 Oct. The other rows are 15 Oct evening quotes; the UK day change is Trading Economics's own, against a prior reference of about 5.40% rather than Wednesday's 5.42% quote.
Yield Curve Spreads (US Treasury par curve, 15 Oct 2026): - 10Y-2Y spread: +33 bp, positive, 8 bp outside the ±25 bp flat band and under the 75 bp steep threshold. - 10Y-3M spread: +82 bp, positive, no recession signal.
OAT-Bund Spread: 138 bp (10-year OAT 4.79% against Bund 3.41%, Trading Economics, 15 Oct 2026), against 142 bp on Wednesday's quotes.
Positive US spreads of this size are what investors normally demand for lending for longer and do not signal an expected recession. The curve flattened on the day: the 10-year and 30-year fell 9 bp, the 2-year 5 bp, and the 3-month bill was unchanged, narrowing the 2-to-10 spread from 37 bp to 33 bp and the 3-month-to-10-year spread from 91 bp to 82 bp. In the euro area every government bond quoted today rallied, France's more than Germany's, so its spread over Germany narrowed by 4 bp, undoing most of Wednesday's 5 bp widening; Italy's spread over Germany narrowed to about 108 bp from about 110 bp. The 10-year gilt fell below 5.35% during the session, its lowest in three weeks, and at 5.37% in the evening remains the highest 10-year yield in the table (Trading Economics).
Yield Curve Charts
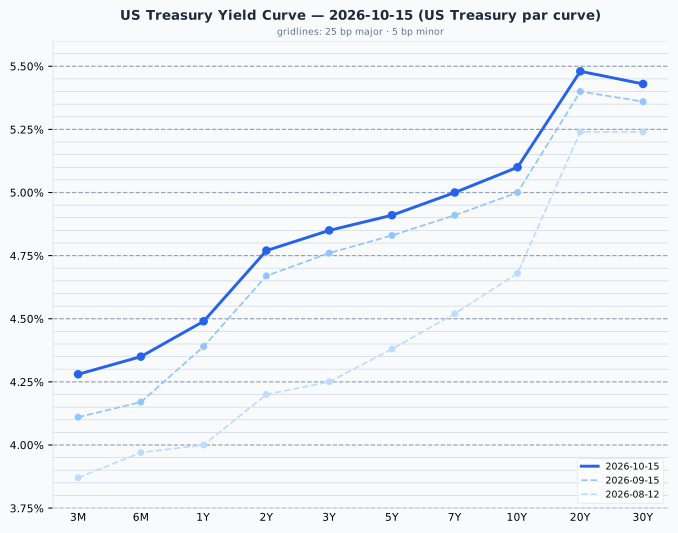
US Treasury par curve, 15 Oct 2026: 3M 4.28%, 6M 4.35%, 1Y 4.49%, 2Y 4.77%, 3Y 4.85%, 5Y 4.91%, 7Y 5.00%, 10Y 5.10%, 20Y 5.48%, 30Y 5.43%; 2-to-10 slope +33 bp. Prior curves: 15 Sep and 12 Aug 2026. The 3-month bill at 4.28% is 40.5 bp above the Fed Funds midpoint of 3.875%, more than the usual 25 bp, consistent with markets allowing for a further rise by December.
The US curve rises from 4.28% at three months to 5.48% at 20 years, with the 30-year 5 bp below the 20-year. Since 15 September every maturity is higher, by 7 bp at 30 years to 18 bp at six months, with the 10-year up 10 bp, and the 2-to-10 slope is back at the 33 bp it showed then. The 9 bp fall at ten and thirty years on 15 October took back about half of the month's rise in the 10-year and more than half in the 30-year.
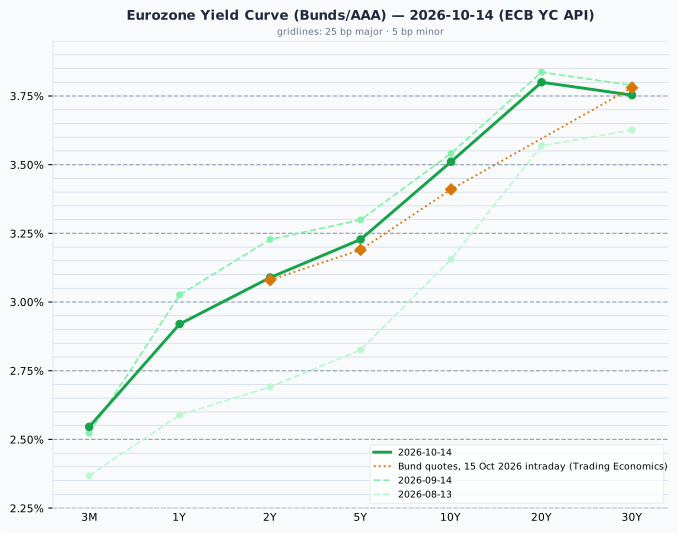
Euro area AAA government curve, 14 Oct 2026 (ECB YC API): 3M 2.55%, 1Y 2.92%, 2Y 3.09%, 5Y 3.23%, 10Y 3.51%, 20Y 3.80%, 30Y 3.75%; 2-to-10 slope +42 bp. Prior curves: 14 Sep and 13 Aug 2026. Today's Bund quotes (Trading Economics, 15 Oct 2026), shown as amber markers, are 10 bp below the plotted curve at 10 years (3.41% against 3.51%), within 4 bp at two, five and thirty years. The curve is the ECB's fitted AAA euro-area composite and the quotes are the most recently issued German bonds, which sit a few basis points apart by construction; on 14 October the 10-year Bund was already 5 bp below the curve, so about half of today's gap is the day's fall.
The euro AAA curve rises from 2.55% at three months to 3.80% at 20 years, with the 30-year 5 bp below the 20-year. Against 14 September it is lower by 3 to 14 bp from one year out, most at two years, and 2 bp higher at three months, so its 2-to-10 slope has widened from 31 bp to 42 bp, while US yields rose 7 to 18 bp at every maturity over the month to 15 October.
Credit Markets (from FRED - authoritative)
| Market | OAS | Obs. date | vs prior obs | Series ID |
|---|---|---|---|---|
| US Investment Grade | 84 bp | 14 Oct 2026 | +1 bp | BAMLC0A0CM |
| US High Yield | 325 bp | 14 Oct 2026 | +9 bp | BAMLH0A0HYM2 |
| Euro High Yield | 326 bp | 14 Oct 2026 | −1 bp | BAMLHE00EHYIOAS |
Change is 14 Oct 2026 vs 13 Oct 2026. Credit spreads are the 14 October close; today's session is not in them yet.
US high-yield spreads, the extra yield on lower-rated company bonds over Treasuries, widened 9 bp to 325 bp on 14 October, the day of the inflation figures and CoreWeave's 15.5% fall, after a 5 bp widening on 13 October. They are still in the lower part of their normal 300–500 bp range; investment-grade spreads at 84 bp are at the bottom of their 80–150 bp range. Euro high-yield spreads were little changed at 326 bp. The VIX closed at 16.87 on 14 October (FRED VIXCLS), up from 15.27 on 13 October and still a moderate reading.
Real Yields (US and Euro Area)
| Region | Nominal 10Y | Expected inflation | Real 10Y | How the real yield is obtained |
|---|---|---|---|---|
| United States | 5.10% (US Treasury par curve, 15 Oct 2026) | 2.32% (residual: nominal − real) | 2.78% (US Treasury real curve, 15 Oct 2026) | Measured. TIPS trade, so the market quotes a real yield directly; expected inflation is the residual (the breakeven) |
| Euro area | 3.51% (ECB YC API, 14 Oct 2026) | 2.04% (ECB SPF, 2026 Q3, measured) | 1.47% (residual: nominal − expected) | Constructed. No euro inflation-linked benchmark is published, so a survey expectation is subtracted from the nominal yield |
Only the US real yield is a market price; the euro figure is derived from a survey and is the softer of the two. Two mismatches apply when comparing them: the US breakeven includes a premium investors demand for inflation risk, which a survey does not, and the survey looks five years ahead against the bond's ten. The US leg is dated 15 October and the euro leg 14 October, the ECB's latest published curve. The 159 bp gap between US and euro nominal 10-year yields splits into 28 bp of expected-inflation difference (2.32% against 2.04%) and 131 bp of real-rate difference (2.78% against 1.47%), so the gap is almost entirely real. The US real yield fell 6 bp on 15 October, from 2.84% on 14 October.
Why the US real-yield advantage is not a return a euro investor can capture
The US real yield has exceeded the euro one in every quarter since 2014, by 1.52 pp on average, and the 131 bp here is below that mean. It is a structural feature (US trend growth, euro-area savings, the scarcity of German government bonds, heavy US government borrowing), not a return a euro-based reader can capture: hedging the currency removes it, because the forward exchange rate is set from the same interest differential, and holding Treasuries unhedged is a bet on the dollar rather than a bond decision. A real yield is real in its own currency; a US real yield of 2.78% is that much above US inflation, which is not a real return for someone who spends euros. The gap is stated here as a description of relative policy stance and growth expectations, and no portfolio conclusion is drawn from it.
Bond Portfolio Implications
A 10 bp rise in yields is an ordinary day's move. At the 15 Oct 2026 par yields it costs:
| Maturity | Yield | Modified duration | Loss for a 10 bp rise | Months of coupon lost |
|---|---|---|---|---|
| 2-year | 4.77% | 1.89 | 0.19% | 0.5 |
| 10-year | 5.10% | 7.76 | 0.77% | 1.8 |
| 30-year | 5.43% | 14.73 | 1.46% | 3.2 |
Months of coupon lost is the loss divided by one month of coupon (yield ÷ 12) on a par bond. Source: US Treasury par curve, 15 October.
The same arithmetic works in reverse on a day like today: the 10-year's 9 bp fall gained a holder about 0.7%, nearly two months of coupon, and the 30-year's 9 bp fall about 1.3%. The 30-year pays 0.66 pp more than the 2-year for more than seven times as much price movement per 10 bp. Today is the case for holding some long bonds: when chip and AI shares fell on worries about growth and Asian markets slumped, long bonds rose, which is the protection a balanced portfolio relies on. Wednesday was the case against: on inflation news, short-term yields rose and long bonds gave little cover. Short maturities keep most of the income with far less exposure to either kind of day. For a holder of French 10-year debt, with a duration close to the US 10-year's 7.8, today's 9 bp fall gained roughly 0.7%.
Currencies & Commodities
Currencies (Yahoo Finance live quotes)
| Pair | Rate | Day chg % | Source |
|---|---|---|---|
| EUR/USD | 1.1210 | +0.47% | yfinance (18:44 CEST) |
| USD Index (DXY, ICE) | 102.11 | −0.43% | yfinance (18:34 CEST) |
| USD/JPY | 158.10 | −0.12% | yfinance (18:44 CEST) |
| GBP/USD | 1.3260 | +0.53% | yfinance (18:44 CEST) |
| USD/CHF | 0.8286 | −0.69% | yfinance (18:44 CEST) |
FX quotes as of 18:44 CEST; day change vs the previous 17:00 ET close.
The dollar fell against every currency in the table, giving back most of Wednesday's 0.67% rise in the ICE index, as US yields fell. The euro rose 0.47% to $1.1210, having traded as high as 1.1240 in Asian hours (Saxo), and the pound rose 0.53% to $1.3260. The Swiss franc gained most (0.69%). The yen gained only 0.12% despite the fall in US yields and the finance minister's warning, so it fell about 0.35% against the euro.
Commodities (Yahoo Finance front-month futures)
| Commodity | Price | Day Chg % | Ticker | Source |
|---|---|---|---|---|
| Brent Crude ($/bbl) | 105.92 | −0.13% | BZ=F | yfinance (BZZ26, Dec) |
| WTI Crude ($/bbl) | 96.50 | +2.77% | CL=F | yfinance (CLZ26, Dec) |
| Gold ($/oz) | 4,170.10 | +1.51% | GC=F | yfinance (GCZ26, Dec) |
| Silver ($/oz) | 57.16 | +2.29% | SI=F | yfinance (SIZ26, Dec) |
| Copper ($/lb) | 6.557 | −1.56% | HG=F | yfinance (HGZ26, Dec) |
| Nat Gas ($/MMBtu) | 3.236 | +1.19% | NG=F | yfinance (NGX26, Nov) |
Day changes are settlement-to-settlement: 15 Oct 2026 settlement vs 14 Oct 2026 settlement.
The Brent row is the December contract (BZZ26); the January contract (BZF27), next in line, settled at $103.17. The WTI row now shows the December contract (CLZ26); Wednesday's table showed November (CLX26), which settled at $95.09 and expires on 20 October. So today's level is not comparable with Wednesday's, but the day change is: December WTI settled at $96.50, up 2.77% from its own Wednesday settlement of $93.90. The December Brent contract (BZZ26) settled 0.13% lower at $105.92, so the gap between the two December contracts narrowed to $9.42 from $12.16 at Wednesday's settlements. A US-only factor fits that: US crude stocks fell 8.6 million barrels in the week to 9 October (EIA via OilPrice.com), which tightens supply at the US delivery point that WTI is priced on more than the seaborne market Brent reflects. The International Energy Agency raised its forecast for the fall in world oil demand this year to 2.6 million barrels a day (Saxo), a sign that high prices are cutting consumption. December Brent is 16.00% below the generic's 52-week high of $126.10 (range $58.72 to $126.10), also set by an earlier contract, and December WTI 19.23% below the generic's 52-week high of $119.48 (range $54.98 to $119.48), a high set by an earlier contract.
Gold settled 1.51% higher at $4,170.10, 25.35% below its all-time high of $5,586.20 set on 29 January 2026, and silver 2.29% higher at $57.16, 52.88% below its all-time high of $121.30 set the same day. Both recovered part of Wednesday's falls as the dollar and US yields fell, because metals that pay no interest become more attractive when bond yields drop. Copper fell 1.56% to $6.557, slightly below its all-time high of $6.83 set on 22 September (4.00% below it), in line with worries about growth. Natural gas rose 1.19% to $3.236, in the lower part of its 52-week range of $2.483 to $7.827.
Sector & Theme Highlights
US sector funds (Select Sector SPDRs, 15 Oct close): eight of the eleven rose and three fell. Health care (XLV) +1.86% led, followed by materials (XLB) +1.79%, consumer discretionary (XLY) +1.71%, communication services (XLC) +1.46%, financials (XLF) +1.38%, real estate (XLRE) +1.21%, consumer staples (XLP) +0.72% and industrials (XLI) +0.51%. Energy (XLE) −1.58% fell most, even with December WTI up 2.77%, followed by technology (XLK) −0.65% and utilities (XLU) −0.17%. Health care has now led two days running, up 2.53% on Wednesday as well: investors are moving money out of technology and AI shares into the rest of the market, health care first.
- Doubts about AI spending: CoreWeave's debts, Chinese competition in memory chips and US rate fears turned into falls of 7.57% in Seoul and 4.90% in Tokyo, while TSMC's third-quarter revenue of NT$1,494 billion, above forecasts, and its fourth-quarter guidance of $52.3–54.3 billion showed the demand for AI chips is still growing. The sell-off is about the price paid for that growth and how it is financed, not about the demand itself.
- Inflation and the Fed: producer prices up 1.3% in September, after consumer prices beat forecasts on Wednesday, keep a Fed rate rise on 28 October possible; yet bond yields fell because investors were more worried about growth today.
- Rotation out of technology: health care led in the US, closely followed by materials and consumer discretionary; in Europe the Swiss and UK indices, weighted towards drug makers and consumer staples, led.
- French public finances: the OAT-Bund spread narrowed 4 bp to 138 bp as French bonds joined the global rally, ahead of the 20 October budget vote and Moody's review on 23 October.
Top Stories (Global)
- Kospi falls 7.57%, trading halted. The index closed at 5,554.22, its lowest since 7 April, with Samsung Electronics down 9.48% and SK hynix 11.06%; foreign investors sold a net 3.62 trillion won (Korea JoongAng Daily).
- Nikkei 225 falls 4.90%. Advantest lost about 14% and SoftBank Group about 9% on worries about AI spending and US interest rates (Japan Times, TradingView, The Standard).
- US producer prices jump 1.3% in September. The largest monthly rise since March 2022 took the annual rate to 6.3%, with energy up 10.8% in the month; retail sales rose 0.8%, but only 0.1% excluding cars, petrol, building materials and restaurants (BLS, CNN).
- Treasuries rally despite the inflation data. The 10-year yield settled 9 bp lower at 5.10% as investors moved from technology shares into bonds (CNBC; US Treasury par curve).
- Dow rises 1.08% as money leaves AI stocks. The Nasdaq 100 closed almost flat (−0.05%) and Nvidia fell 1.84%, while CoreWeave recovered from a 9.5% morning fall to close 5.94% higher (ts2.tech, Pomegra).
- Warsh keeps the October decision open. Fed Chair Kevin Warsh, speaking with IMF Managing Director Kristalina Georgieva in Bangkok at 03:30 GMT on 16 October, said he would deliver price stability but would not pre-judge upcoming meetings; the dollar index extended its fall to near 101.80 afterwards (FXStreet).
- TSMC profit beats forecasts. Third-quarter net income of NT$763.1 billion, up 68.7%, against NT$740.8 billion expected, and fourth-quarter revenue guidance of $52.3–54.3 billion (TSMC filing, LSEG).
- UK economy grows 0.1% in August. Economists had expected a 0.1% contraction; the figure supports a Bank of England rate rise in November (Trading Economics).
- Nordea pauses buybacks; Ericsson beats forecasts. Nordea fell 6% after pausing share buybacks during an ECB review of its capital; Ericsson rose on results driven by its network business in Japan and India (dpa-AFX via ARIVA).
Looking Ahead
- Friday 16 October: US industrial production and import prices (ZeroHedge, 13 Oct); the European Council's 15–16 October meeting ends.
- Next week: Germany's ZEW survey and UK labour figures on 20 October, the day of the first French vote on budget revenue and of the November WTI contract's expiry; Moody's review of France on 23 October.
- Later: Brazil's presidential runoff on 25 October; the Fed meets on 27–28 October; the UK budget on 28 October (Trading Economics); the Bank of Japan meets on 29–30 October; US midterm elections on 3 November.
Market closures - None in the next five days. - No Indian holiday data is available here, so Indian closures are not checked.
Special Analysis: CoreWeave's Debt Scare, and Why Its Shares Rose the Next Day While Its Bonds Kept Falling
Added 16 October 2026. CoreWeave rents out Nvidia's AI chips and has borrowed heavily to buy them. On 14 October investors sold its bonds until they yielded about 15%, and its shares fell 15.5%. That yield is nearly twice the 8.2% average on junk-rated US company debt, and not far below the 17.6% paid by the riskiest borrowers. The next day, 15 October, the shares rose 5.94%, winning back about a third of that fall, after Nvidia's chief executive said CoreWeave did not need Nvidia to stand behind its debts. Its bonds kept falling, though, and the cost of insuring its debt against default reached a record. The same words that reassured shareholders told lenders that Nvidia would not guarantee what they are owed.
What CoreWeave does and how it pays for it
CoreWeave buys Nvidia's graphics processors (GPUs), the chips that train and run AI models, installs them in data centres and rents out the computing power, often under contracts lasting several years. Its largest customer has been Microsoft, which provided about two-thirds of its 2025 revenue (Forbes). The leading AI developers have since signed up: OpenAI, with contracts worth about $22.4bn signed during 2025; Meta, whose two agreements total about $35bn and run to the end of 2032; and Anthropic, with a multi-year agreement signed in April whose value was not disclosed (company announcements; CNBC). Smaller customers include Databricks, Caterpillar and the trading firm Hudson River Trading. Revenue still rests on a few buyers: in the quarter to June, the three largest customers provided 36%, 26% and 10% of it (quarterly filing), so the value of the contract backlog depends heavily on a handful of companies. Demand is not the problem: revenue in the quarter to June was $2.58bn, up 112% on a year earlier, and the company counted about $104bn of future revenue under signed contracts at the end of June, plus more than $25bn of new commitments signed in the first weeks of July (company results, 11 August). The problem is timing. The chips have to be paid for when they are installed, while the rent arrives over the life of each contract.
| Quarter to | Revenue | Cash from operations | Spending on equipment | Free cash flow | Interest expense | Total debt |
|---|---|---|---|---|---|---|
| Jun 2025 | $1.21bn | −$0.25bn | $2.45bn | −$2.70bn | $0.27bn | $14.6bn |
| Sep 2025 | $1.37bn | $1.69bn | $2.39bn | −$0.70bn | $0.31bn | $18.8bn |
| Dec 2025 | $1.57bn | $1.56bn | $4.06bn | −$2.50bn | $0.39bn | $29.8bn |
| Mar 2026 | $2.08bn | $2.98bn | $7.70bn | −$4.71bn | $0.54bn | $35.1bn |
| Jun 2026 | $2.58bn | $0.68bn | $6.42bn | −$5.74bn | $0.64bn | $51.6bn |
Company filings via Yahoo Finance. Free cash flow is cash from operations less spending on equipment. Cash from operations is after interest paid ($0.44bn in the June 2026 quarter), so free cash flow already includes it; the interest column is the expense in the income statement, shown for scale. Total debt includes $16.5bn of lease obligations at the end of June 2026.
Free cash flow over the four quarters to June was −$13.7bn, and borrowing filled the gap: total debt rose from $14.6bn to $51.6bn in a year, against $5.0bn of shareholders' equity and $5.5bn of cash. Interest of $640m in the June quarter took 44% of the company's $1.47bn of earnings before interest, tax, depreciation and amortisation, the usual measure of the cash a business generates before paying for its equipment; after charging for the wear on its chips, CoreWeave made an operating loss. The pace is not slowing. In August the company raised its 2026 investment plan to $35–39bn, about three times its expected revenue of $12.4–13.2bn, and said further investment would likely need more debt or new shares (MarketBeat).
What the bond market said on 14 and 15 October
A bond pays a fixed coupon, so when investors want a higher return for holding it, only its price can adjust. CoreWeave's notes due 2031 and 2032 pay coupons of 9.75% and 9.625%. By Wednesday's close they yielded close to 15% (CNBC), and on Thursday the yield on the 2031 notes passed 16% (Reuters via BNN Bloomberg). For a 9.75% note with about five years left to run, a 16% yield means a price of roughly 80 cents on the dollar. For comparison, on 14 October the average US high-yield bond, the debt of companies rated below investment grade, yielded 8.20%, and the lowest-rated part of that market, bonds rated CCC or below, yielded 17.61% (ICE BofA via FRED). The market was pricing CoreWeave's debt much closer to the companies most likely to default than to the average junk-rated borrower.
The cost of insuring the debt said the same. A credit default swap pays out if a borrower defaults, and the buyer pays an annual premium for that protection. The five-year premium on CoreWeave rose by as much as 74.5 bp on Thursday to 1,194.5 bp, 11.9% of the insured amount a year and the highest on record (ICE Data Services via TradingKey).
Reuters reported that a premium of about 1,000 bp implied a nearly 63% chance of default within five years, against about 30% a year earlier (BNN Bloomberg). Its article, published at 08:23 New York time on Thursday, rests on a premium of 10% a year, lower than the 11.9% reached at the session high. It does not say how it reached its figure, but the usual conversion treats the premium as a fair price for expected losses: the yearly premium equals the chance of default in a year multiplied by the share of the money lost in a default. Taking the 10% premium and assuming lenders get back 40 cents on the dollar, the market's standard assumption:
- Loss per default. Lenders get back 40 cents, so they lose 60 cents on each dollar insured.
- Yearly chance of default. 10% ÷ 60% = 16.7%.
- Chance of surviving one year. 100% − 16.7% = 83.3%.
- Chance of surviving five years. The borrower has to survive five years in a row: 0.833 multiplied by itself five times is 0.40.
- Chance of default within five years. 100% − 40% = about 60%.
Forty cents is the convention because the standard model the industry has used to price default insurance since 2009 assumes it for senior unsecured debt: ordinary bonds that rank ahead of shareholders and junior lenders, but behind lenders who hold specific assets as security. It is close to what such bondholders have recovered on average in past defaults, roughly 35 to 40 cents on the dollar in the rating agencies' long-run studies, although recoveries vary widely from case to case and are lowest in recessions, when many companies default at once. CoreWeave's unsecured lenders may well get back less. Much of its borrowing is secured on its chips and data centres, which the secured lenders would claim first, and chips lose value quickly as newer generations arrive, so their resale value in a default could be well below what the company paid.
The result depends on both inputs. A lower recovery gives a lower chance of default, because each default costs lenders more, so fewer defaults are needed to justify the same premium.
| Premium | Lenders get back | Yearly chance of default | Default within five years |
|---|---|---|---|
| 10% (about 1,000 bp, Reuters' basis) | 40 cents (the convention) | 16.7% | 60% |
| 10% | 25 cents | 13.3% | 51% |
| 11.9% (1,194.5 bp, the session high) | 40 cents (the convention) | 19.9% | 67% |
| 11.9% | 25 cents | 15.9% | 58% |
Simple yearly calculation as in the steps above. Models that spread the risk of default evenly through the year give slightly lower figures, for example 57% rather than 60% for a 10% premium with 40 cents recovered.
Reuters' 63% is close to the conventional result for a 10% premium. Probabilities read from a premium this way overstate the real odds, because part of the premium pays the seller for carrying the risk rather than for expected losses, much as an insurer charges more than the claims it expects to pay. What matters is the change: the price of protection implies roughly twice the chance of default it did a year ago, a sign that lenders have grown far more worried about being repaid.
No company announcement set off the selling, and Deutsche Bank's analyst said it was hard to identify a single trigger (TradingKey). It came on the day hotter US consumer prices raised the odds of a further Fed rate rise, which would make refinancing $51.6bn of debt more expensive, and amid a wider debate over whether spending on AI will pay for itself. The shares fell 15.5% to $65.78 on 111.2 million shares traded, almost six times the volume of 12 October. Chief executive Mike Intrator told staff that the contract backlog more than covers the company's debt obligations and that markets can "misunderstand and act irrationally" (Reuters via BNN Bloomberg).
Why the shares rose on 15 October
The shares opened at $61.43, fell early in the session to $59.51, 9.5% below Wednesday's close and 27.5% below the 9 October close of $82.08, then climbed steadily for the rest of the day to close at $69.69, up 5.94%, on 130.0 million shares, even more than on Wednesday. Four things lifted them.
- Nvidia's chief executive vouched for the company. Speaking in Stockholm, Jensen Huang said CoreWeave's strength is improving "every day", that its "cost of capital is actually coming down", that Nvidia does not need to backstop it, meaning stand behind its debts, and that worries about circular financing, the charge that Nvidia invests in its customers so that they can buy its chips, are "ridiculous" (Bloomberg via TradingKey; Pomegra). Nvidia owns about 10% of CoreWeave and is its main supplier, so shareholders took the remarks as a sign that Nvidia would not let one of its largest customers run short of money, whatever Huang said about a backstop.
- The fall had gone far enough for some buyers. Deutsche Bank's Brad Zelnick kept his buy rating and called the sell-off a buying opportunity, arguing that the contract backlog should let the company keep raising money steadily (TradingKey).
- The whole market turned. Invesco's Nasdaq 100 fund also made its low in the first half-hour of trading and rose 1.5% from there to the close; over the same hours CoreWeave rose 17.1% from its low (Yahoo Finance, 15-minute prices). A heavily indebted, loss-making company amplifies the market's moves in both directions.
- Short sellers probably bought back. On 30 September, 19.2% of the shares available for trading had been sold short, a high proportion (Yahoo Finance). Short sellers profit from falls, and when a stock turns up many buy back shares to limit their losses, pushing the price higher still. Thursday's heavy volume fits that pattern, but no report confirms it.
Why the same words did not help the bonds
The bonds fell further on Thursday while the shares rose, because shareholders and lenders hold different claims on the same company and listened for different things.
- "No backstop" was what lenders did not want to hear. An Nvidia guarantee would have repaired the bonds at once, since Nvidia's own credit is among the strongest of any company. Hearing a 10% owner rule one out in public removed part of the safety net the bond price had been leaning on.
- Lenders cannot gain from good news, only lose from bad. A bond's best outcome is its coupons and its money back. Optimism about growth adds nothing to that; only evidence of cash to repay does, and the figures in the table above did not change on Thursday. A share has no ceiling, so after a 27.5% fall the chance of a large rise was enough to bring buyers back.
- Uncertainty helps shareholders and hurts lenders. Shareholders can lose no more than their stake but keep all of the upside, so a wider range of outcomes adds to the value of a share. A loan bears the bad outcomes without sharing in the good ones, so the same uncertainty subtracts from its value.
- The claim about the cost of capital contradicted the lenders' own prices. CoreWeave's cost of borrowing is the yield its lenders demand, and on the day Huang said it was coming down, the 2031 notes yielded more than 16%.
- The case for the shares involves more borrowing. Deutsche Bank's argument rests on CoreWeave continuing to raise money. New debt funds growth, which shareholders want, but leaves existing lenders sharing the company's assets with more creditors in a default, some of them possibly with a prior claim on the chips and buildings.
- What lifted the shares does not reach the bonds. Short sellers buying back, bargain hunters and a rising Nasdaq all act on the stock. In credit, the way to bet against a company is to buy default protection, and that buying took the premium to its record.
None of the reports explain Thursday's bond move directly; these are the standard reasons the two can move apart, applied to the figures above.
Why it moved markets in Asia
CoreWeave matters beyond its own size because it is the clearest example of a company borrowing to build AI capacity. Each Nvidia GPU it buys carries high-bandwidth memory made by SK hynix and Samsung Electronics, and the chips are tested on equipment from makers such as Advantest. If lenders stop financing buyers like CoreWeave, orders all the way back along that chain shrink. That is why Korea JoongAng Daily named CoreWeave's debt among the three causes of Seoul's 7.57% fall, alongside Chinese memory output and US interest rates, and why TSMC's profit beat did not stop the selling: investors were questioning how the spending on AI is financed, not the demand for chips today.
What it means for readers
When a company's shares rise and its bonds fall on the same day, the market is saying there is both more upside and more risk of not being repaid. Here it says Thursday's gain was relief among shareholders, not an easing of the doubts about CoreWeave's debt. For holders of technology and semiconductor ETFs, the episode shows that part of the demand behind those funds' earnings comes from buyers whose debt is priced near the riskiest part of the bond market. The tests come in order: whether the yields on CoreWeave's notes fall back below 15% and the default-insurance premium retreats from its record; the company's effort, described by co-founder Brannin McBee to the Financial Times, to win an investment-grade credit rating, which would lower its cost of borrowing; and its third-quarter results, which Yahoo Finance expects around 11 November, where the questions will be how much new debt the quarter took on and how much of the backlog turned into cash.
Data sources: US Treasury par and real curves (15 Oct 2026) and FRED (policy rates, VIX, credit spreads, CPI and labour data); ECB YC API (AAA curve, 14 Oct 2026) and ECB SPF (2026 Q3); equity indices, ETF P/E proxies, commodity futures and sector funds via Yahoo Finance (15 Oct close) and FX via Yahoo Finance (as of 18:44 CEST); European, UK and Japanese bond yields, economic releases and news via web search (Trading Economics, Korea JoongAng Daily, Japan Times, TradingView, The Standard, BLS, CNBC, CNN, Babypips, Yahoo Finance, TSMC filing via SEC, dpa-AFX via ARIVA, Saxo, OilPrice.com, FXStreet, ZeroHedge, ts2.tech, Pomegra, World Today News).