2026 06 24
Global Financial Briefing — Wednesday, 24 June 2026
Market Overview
Wednesday's session delivered a dramatic intraday reversal in the US: an early rally that pushed the S&P 500 to +0.76% and the Dow to +1.10% by midday gave way to a late-session fade, with the S&P 500 closing barely negative at −0.10% (7,358.22) and the Nasdaq settling −0.43%. The Dow was the lone US winner (+0.35%), supported by energy cost relief. The defining macro event of the day was geopolitical: President Trump signed a nuclear framework agreement with Iran, clearing a potential path for Strait of Hormuz reopening — triggering a broad commodity collapse, with WTI crude crashing −4.5% to $69.88/bbl and Brent −5.1% to $73.18/bbl, the largest single-day oil move in months. Gold fell −3.2% to $4,016.8/oz and silver plunged −7.3% to $57.53/oz as geopolitical risk premia were stripped from safe-haven assets.
The macro backdrop that gave markets pause is equally significant. US CPI re-accelerated to 4.17% YoY in May — nearly double the February 2026 low of 2.43% — prompting BofA and Deutsche Bank to forecast three Fed rate hikes in H2 2026. Fed Chair Kevin Warsh faces mounting political pressure but the inflation data leaves him little room to ease. Investors are also watching the BOJ's June 16 hike to 1.0% (highest since September 1995), which has pushed JGB 10Y yields to ~2.67%, reshaped yen carry trade dynamics, and signalled the end of Japan's decades-long ultra-loose policy era. Micron Technology reports earnings after today's close — the week's most important corporate event and a real-time test of the AI infrastructure investment thesis. PCE deflator arrives Thursday.
Globally, the session was mixed. European indices closed with modest moves (Swiss SMI +1.49% a standout), Asian markets broadly positive led by Kospi Korea's extraordinary +3.26% surge, while commodities absorbed the largest shock. Credit spreads remain at historically tight levels — US HY OAS at 271 bps vs a normal range of 300–500 bps — suggesting markets are pricing near-zero near-term default risk despite the elevated inflation and rate-hike environment.
Global Indices Snapshot
Americas
Americas data reflects today's close (24 Jun).
| Index | Level | Day Chg | Day Chg % | Source |
|---|---|---|---|---|
| S&P 500 | 7,358.22 | −7.24 | −0.10% | yfinance ^GSPC |
| Nasdaq 100 | 29,220.06 | −127.22 | −0.43% | yfinance ^NDX |
| Dow Jones | 51,848.90 | +182.06 | +0.35% | yfinance ^DJI |
| Brazil IBOV | 170,506.66 | −752.22 | −0.44% | yfinance ^BVSP |
FRED SP500 authoritative prior close: 7,365.46 (23 Jun 2026, FRED SP500). yfinance ^GSPC shows today's 24 Jun close at 7,358.22 (−0.10% from yesterday's close). The intraday rally to 7,421 (+0.76%) faded into the close as Micron uncertainty weighed on the Nasdaq.
Europe
European data reflects today's close (24 Jun).
| Index | Level | Day Chg | Day Chg % | Source |
|---|---|---|---|---|
| Euro STOXX 600 | 635.16 | +0.53 | +0.08% | yfinance ^STOXX |
| Euro STOXX 50 | 6,214.70 | −15.85 | −0.25% | yfinance ^STOXX50E |
| CAC 40 | 8,385.49 | +44.78 | +0.54% | yfinance ^FCHI |
| DAX | 24,740.36 | −153.22 | −0.62% | yfinance ^GDAXI |
| FTSE 100 | 10,461.63 | +32.78 | +0.31% | yfinance ^FTSE |
| SMI (Swiss) | 14,117.75 | +207.05 | +1.49% | yfinance ^SSMI |
Asia-Pacific
Asia-Pacific data reflects today's close (24 Jun).
| Index | Level | Day Chg | Day Chg % | Source |
|---|---|---|---|---|
| Nikkei 225 | 69,174.97 | −613.41 | −0.88% | yfinance ^N225 |
| Hang Seng | 23,412.18 | +75.90 | +0.33% | yfinance ^HSI |
| Shanghai Composite | 4,110.81 | +4.56 | +0.11% | yfinance 000001.SS |
| ASX 200 | 8,808.40 | +21.40 | +0.24% | yfinance ^AXJO |
| Kospi (Korea) | 8,471.02 | +267.18 | +3.26% | yfinance ^KS11 |
† Kospi +3.26% is an unusually large single-day move. 52-week low data for ^KS11 returned 0.0 in yfinance (data quality issue); that field has been suppressed. Daily change figure confirmed across two independent fetches but warrants verification.
Emerging Markets
| Index | Level | Day Chg % | Source |
|---|---|---|---|
| MSCI EM (EEM) | 67.25 | +0.12% | yfinance EEM |
| India Nifty 50 | 24,021.65 | +0.83% | yfinance ^NSEI |
| South Africa JSE | (not retrieved) | — | yfinance ^J203 |
Index Valuations & Investment Risk
Valuation Table
| Index | Trailing P/E (live) | Hist avg trailing P/E (†) | Premium to hist avg | Shiller CAPE |
|---|---|---|---|---|
| S&P 500 | 26.26x (SPY) | ~16–18x | +54.5% ⚠ | (not retrieved) |
| Nasdaq 100 | 32.63x (QQQ) | ~25–30x | +18.7% | n/a |
| Euro STOXX 600 | 18.12x (EXSA.DE) | ~15–17x | +13.3% | n/a |
| CAC 40 | 17.53x (CAC.PA) | ~14–16x | +16.9% | n/a |
| DAX | 18.07x (EXS1.DE) | ~15–17x | +13.0% | n/a |
| FTSE 100 | 17.62x (ISF.L) | ~13–15x | +25.9% ⚠ | n/a |
| Nikkei 225 | 23.53x (1321.T) | ~20–22x | +12.1% | n/a |
| MSCI EM | 17.81x (EEM) | ~13–15x | +27.2% ⚠ | n/a |
(†) Hist avg trailing P/E: static long-run reference constants. Trailing P/E (live): sourced from yfinance trailingPE on ETF proxies. ⚠ = >20% above historical average.
Investment Risk Assessment for ETF Investors
United States (S&P 500 / Nasdaq ETFs)
The S&P 500 at 26.26x trailing P/E sits 54.5% above its long-run historical average of ~17x — in the historically stretched zone. The Equity Risk Premium is negative:
ERP = (1÷26.261) − 4.50% (DGS10, FRED 2026-06-23) = 3.81% − 4.50% = −0.69%
US 10-year Treasuries now yield more than S&P 500 earnings, making bonds competitive with equities on a forward-return basis for the first time in the cycle. The 10Y TIPS real yield at 2.29% (FRED DFII10) — a high positive real rate — mechanically compresses the present value of future earnings, adding further headwind. The S&P 500 at 7,358 sits 3.4% below its 52-week high of 7,621 and is above both the 50-day MA (7,340) and 200-day MA (6,912), so technicals are still constructive. But with CPI at 4.17% YoY driving BofA and Deutsche Bank to forecast H2 2026 Fed hikes, and the yield curve signalling potential short-end repricing, the macro environment is deteriorating for high-multiple equities. Risk assessment: HIGH valuation risk / low margin of safety.
Europe (STOXX 600 / CAC 40 / DAX ETFs)
European equities offer substantially better value than the US. Euro STOXX 600 at 18.12x is 13.3% above its long-run average but the EUR Equity Risk Premium is strongly positive:
EUR ERP = (1÷18.116) − 2.97% (Bund 10Y, ECB YC API) = 5.52% − 2.97% = +2.55%
European equities price a meaningful return above European risk-free rates. The CAC 40 (17.53x, +17% premium) and DAX (18.07x, +13% premium) are modestly elevated but not stretched. A specific French risk to flag: the OAT 10Y yield climbed to 3.88% (highest since March 2026), implying an OAT–Bund spread of ~91 bps (3.88% − 2.97%). This reflects ongoing French fiscal and political anxiety — a spread of 91 bps is not crisis-level but warrants attention from French-market investors. EUR/USD at 1.1470 means euro-denominated returns face currency headwinds for non-EUR investors. Risk assessment: MODERATE — positive ERP, fair valuation; French fiscal risk and EUR currency exposure are key considerations.
Japan (Nikkei / TOPIX ETFs)
The BOJ's June 16 hike to 1.0% — the highest since September 1995 — is the biggest structural shift in Japanese markets in a generation. JGB 10Y at ~2.67% is at multi-decade highs, and the BOJ has explicitly signalled further hikes. Japan ERP = (1÷23.530) − 2.67% = 4.25% − 2.67% = +1.58%, modest but positive. The Nikkei at 69,175 is 5% below its 52-week high of 72,832 and well above both moving averages. USD/JPY at 161.56 means that despite the BOJ tightening, the yen remains very weak — the US–Japan rate differential (3.625% Fed midpoint vs 1.0% BOJ) still enormously favours the dollar carry trade. A sharp yen reversal, should it come, would severely hit unhedged Nikkei ETF investors. Risk assessment: MODERATE — fair valuation, positive ERP, but BOJ tightening pace and yen reversal risk are significant. Currency hedge strongly recommended.
Emerging Markets (MSCI EM ETFs)
MSCI EM at 17.81x trailing P/E is 27.2% above its long-run average of ~14x — a notable premium that erodes the traditional EM valuation discount. EEM trades at $67.25, 6.0% below its 52-week high of $71.57, and above both the 50-day ($66.03) and 200-day ($58.63) MAs. Korea's extraordinary +3.26% session suggests AI/semiconductor enthusiasm is flowing into EM. China (Hang Seng +0.33%) remains subdued with a large overhang of structural concerns. USD strength (index at 120.40) is a structural headwind for EM local-currency assets. Risk assessment: MODERATE to HIGH — valuations elevated vs historical EM averages; selectivity required.
Overall risk summary: - US equities: High valuation risk / negative ERP / low margin of safety - European equities: Moderate — positive ERP, fair-ish valuations; French fiscal tail risk - Japan: Moderate — fair value, BOJ tightening risk, currency hedge needed - EM: Moderate-high — above-historical-average PE, USD headwind
Disclaimer: This is financial information, not personalised investment advice. Past valuations do not guarantee future returns. Consult a financial advisor before investing.
US Economic Indicators (FRED — authoritative)
| Indicator | Current | Prior | Delta | Reference Period | FRED Series |
|---|---|---|---|---|---|
| CPI YoY % | 4.17% | 3.78% | +0.39pp | May 2026 | CPIAUCSL |
| Core CPI YoY % | 2.82% | 2.74% | +0.08pp | May 2026 | CPILFESL |
| Unemployment Rate | 4.3% | 4.3% | flat | May 2026 | UNRATE |
| Nonfarm Payrolls | +172k | +179k | −7k | May 2026 (MoM) | PAYEMS |
| 10Y TIPS Real Yield | 2.29% | — | — | 2026-06-23 | DFII10 |
The headline CPI re-acceleration from 2.43% in February to 4.17% in May is the most consequential US macro development of this cycle. This is not a rounding error — it represents a genuine re-ignition of inflationary pressures, attributed primarily to tariff pass-through into goods prices, energy (before today's oil crash), and sticky services. Core CPI at 2.82% confirms the re-acceleration is not purely energy-driven. Labour market remains resilient: unemployment holds at 4.3%, payrolls at +172k (May). The 10Y TIPS real yield of 2.29% is elevated by post-2008 standards — this is the true cost of capital that discounts future equity earnings and makes risk-free Treasuries genuinely competitive.
Other economic releases today (24 Jun): The economic calendar was light. The Thursday PCE deflator (the Fed's preferred inflation measure) and weekly initial jobless claims are the next key data points. No PMI or GDP surprises were retrieved for today.
Fixed Income & Bond Analysis
Policy Rates
| Central Bank | Rate | Source |
|---|---|---|
| Fed Funds (upper) | 3.75% | FRED DFEDTARU (2026-06-24) |
| Fed Funds (lower) | 3.50% | FRED DFEDTARL (2026-06-24) |
| Effective FFR | 3.63% | FRED DFF (2026-06-23) |
| ECB Deposit Rate | 2.25% | FRED ECBDFR (2026-06-24) |
| BOJ Policy Rate | 1.00% | web search (hiked 16 Jun 2026) |
| BOE Bank Rate | ~3.73% (SONIA) | FRED IUDSOIA (2026-06-22) |
Government Bond Yields
| Country | 2Y Yield | 10Y Yield | 30Y Yield | Source |
|---|---|---|---|---|
| USA | 4.16% | 4.50% | 4.94% | FRED (2026-06-23) |
| Germany | 2.50% | 2.97% | 3.49% | ECB YC API (2026-06-23) |
| France | — | 3.88% | — | web search (24 Jun 2026) |
| UK | 4.18% | 4.78% | — | web search (24 Jun 2026) |
| Japan | — | 2.67% | — | web search (24 Jun 2026) |
| Italy | — | (not retrieved) | — | — |
Yield Curve Spreads (FRED — live as of 2026-06-24):
- 10Y–2Y spread: +30 bps (FRED T10Y2Y, 2026-06-24) — The curve is modestly positive but very flat. The spread has compressed from ~53 bps a month ago (May 22: 10Y 4.57%, 2Y 4.04%) to 30 bps today as the 2Y rose +12 bps while the 10Y fell −7 bps — a classic "bear flattening" driven by front-end rate-hike expectations. This is not inversion, but 30 bps is far from the ~75 bps that would historically signal a "steep" curve. The shape suggests markets expect near-term hikes but see limited upside for long-term rates.
- 10Y–3M spread: +56 bps (FRED T10Y3M, 2026-06-24) — Positive; the yield curve is no longer sending a recession warning via this metric.
OAT–Bund Spread: France 10Y OAT at 3.88% vs Germany Bund 10Y at 2.97% implies a spread of approximately 91 bps — the highest France-Germany differential in months, reflecting persistent French fiscal concern and political uncertainty. A 3.88% OAT yield is the highest since March 2026 per web search, suggesting renewed pressure on French sovereign debt.
Yield Curve Charts
US Treasury Yield Curve (FRED, as of 2026-06-23):
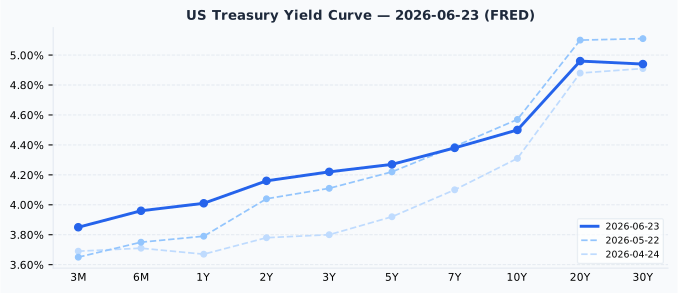
The US curve displays a modestly upward slope, with the 3M at 3.85% anchored near the 3.625% Fed Funds midpoint (a 22.5 bps premium — within the normal 25 bps sanity range ✓). The belly (2Y–7Y: 4.16%–4.38%) has risen sharply relative to April, while the long end (20Y–30Y: 4.96%–4.94%) has been more stable. Compared to one month ago (22 May: 10Y at 4.57%), today's 10Y at 4.50% is actually 7 bps lower — the long end has rallied on oil-disinflation expectations even as the short end rose. Two months ago (24 Apr: 10Y at 4.31%), the entire curve was materially lower, confirming the bear flattening trend driven by inflation re-acceleration.
Eurozone Yield Curve (ECB YC API, as of 2026-06-23):
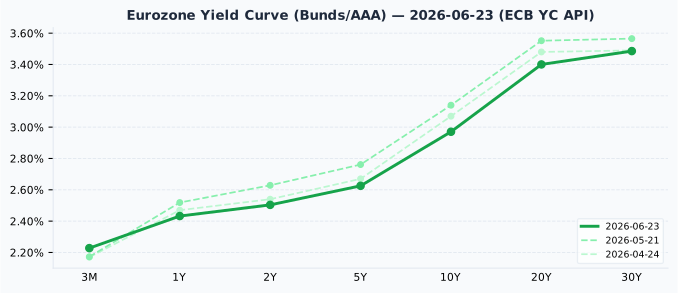
The ECB AAA-rated euro area curve is upward sloping from 3M (2.23%) to 30Y (3.49%), with the 10Y at 2.97%. Compared to one month ago (May 21: 10Y at 3.14%), the ECB 10Y has fallen 17 bps, reflecting ECB easing expectations building into the longer end. The short end (3M: 2.23%) is anchored by the ECB deposit rate (2.25%). The US–Eurozone 10Y spread is approximately 153 bps (4.50% − 2.97%) — a wide transatlantic gap that has underpinned USD strength and EUR weakness over the past year.
Credit Markets (FRED — authoritative)
| Market | OAS Spread | In bps | Normal range | Signal | Series ID | Date |
|---|---|---|---|---|---|---|
| US Investment Grade | 0.74% | 74 bps | 80–150 bps | Below normal — tight | BAMLC0A0CM | 2026-06-23 |
| US High Yield | 2.71% | 271 bps | 300–500 bps | Well below normal — very tight | BAMLH0A0HYM2 | 2026-06-23 |
| Euro High Yield | 2.62% | 262 bps | 300–500 bps | Well below normal — very tight | BAMLHE00EHYIOAS | 2026-06-23 |
US IG at 74 bps (below the 80–150 bps normal band) and US HY at 271 bps (well below the 300–500 bps normal range) reflect a credit environment that is pricing near-perfect economic execution. When spreads are this compressed, there is little cushion against earnings deterioration, a Fed policy mistake, or a geopolitical shock. The Iran deal today is a reminder that geopolitical tail risks can resolve quickly in either direction. Extremely tight credit spreads are historically followed by periods of spread volatility.
Bond Portfolio Implications
The Equity Risk Premium is the key investment decision metric at current levels:
- S&P 500 ERP = (1÷26.261) − 4.50% = 3.81% − 4.50% = −0.69% — negative. US 10Y Treasuries yield more than S&P 500 earnings per dollar invested. This is a historically significant warning signal for forward equity returns.
- Euro STOXX ERP = (1÷18.116) − 2.97% = 5.52% − 2.97% = +2.55% — positive. European equities offer substantial return over Bunds, making European allocation relatively more attractive.
Duration risk: With the US 10Y at 4.50% and BofA forecasting Fed hikes to potentially 4.50–5.00%+ by end-2026, extended duration in long-dated bonds carries material price risk. Short-to-medium US Treasuries (1Y at 4.01%, 2Y at 4.16%) provide competitive risk-adjusted returns with far less rate-risk exposure. They also beat the S&P 500 earnings yield by ~30–70 bps — a meaningful inversion of the traditional "stocks beat bonds" framework.
⚠ Markdown notation reminder (embedded rule): All ERP calculations above use (1÷PE) notation with parentheses and the ÷ symbol — not square brackets — to avoid CommonMark link-reference parsing issues.
Currencies & Commodities
Currencies:
| Pair | Rate | Source |
|---|---|---|
| EUR/USD | 1.1470 | FRED DEXUSEU (2026-06-18) |
| USD Index | 120.40 | FRED DTWEXBGS (2026-06-18) |
| USD/JPY | 161.56 | web search (24 Jun 2026) |
| GBP/USD | 1.3193 | web search (24 Jun 2026) |
| USD/CHF | 0.8074 | web search (24 Jun 2026) |
FRED EUR/USD and USD Index data lag to 18 June — the H.10 release schedule means the most recent Fed H.10 publication covered that week. The FX market has likely moved since; treat these values as directional, not precise. USD/JPY, GBP/USD, and USD/CHF are from web search for 24 Jun and reflect the trading session.
The dollar's broad strength (USD Index 120.40) persists, supported by the wide US–Eurozone rate differential (~153 bps at 10Y). The yen remains weak at 161.56 despite the BOJ's historic hike to 1.0% — the yen carry trade is massive and the 2.625% US–Japan rate differential still powerfully incentivises borrowing in yen to buy USD-denominated assets. A sustained BOJ hiking path or a sharp economic shock could trigger rapid yen appreciation and multi-market volatility.
Commodities (all yfinance MCP front-month futures, 24 Jun end-of-session):
| Commodity | Price | Day Chg % | ATH | vs ATH | 52wk Range | Ticker |
|---|---|---|---|---|---|---|
| Brent Crude | $73.18/bbl | −5.06% | $147.43 | −50.4% | $58.72 – $126.10 | BZ=F |
| WTI Crude | $69.88/bbl | −4.55% | $147.27 | −52.5% | $54.98 – $119.48 | CL=F |
| Gold ($/oz) | $4,016.8 | −3.20% | $5,586.2 | −28.1% | $3,253.8 – $5,586.2 | GC=F |
| Silver ($/oz) | $57.53 | −7.32% | $121.3 | −52.6% | $35.27 – $121.3 | SI=F |
| Copper ($/lb) | $5.987 | −2.62% | $6.6525 | −10.0% | $4.3235 – $6.6525 | HG=F |
| Nat Gas ($/MMBtu) | $3.265 | +2.54% | $15.78 | −79.3% | $2.483 – $7.827 | NG=F |
Crude oil: WTI fell 4.55% to $69.88/bbl, Brent fell 5.06% to $73.18/bbl — both benchmarks are 52–50% below their all-time highs of ~$147/bbl set during the post-invasion price spike. The Iran deal, if fully implemented, could add meaningful supply capacity to global markets. Brent is already 42% below its 52-week high of $126.10. An sustained oil price around $70/bbl would mechanically reduce US CPI via energy components, potentially easing the Fed's dilemma.
Gold: Closed at $4,016.8/oz, 28.1% below its all-time high of $5,586.2/oz (the ATH coincides with the 52-week high, indicating the record was set within the past year at the peak of Iran-related geopolitical tension). Today's −3.2% decline is the largest single-day fall in months. The Iran deal has directly removed one of gold's key demand drivers — geopolitical safe-haven premium. The 10Y TIPS real yield at 2.29% is also a structural headwind for non-yielding gold. Despite the pullback, gold remains substantially elevated in historical context; the $5,586 ATH and today's $4,017 level both represent unprecedented price territory in absolute terms.
Silver: Fell 7.32% to $57.53/oz — 52.6% below its all-time high of $121.3/oz (also the 52-week high). Silver's dual role as precious metal and industrial input (semiconductors, solar) amplifies its volatility; its beta to gold is elevated in geopolitical risk-off moves.
Copper: Declined 2.62% to $5.987/lb, now 10.0% below its all-time high of $6.6525/lb. A 10% ATH distance is notable and worth flagging — copper has been one of the strongest commodity performers over the past year (52-week range: $4.32–$6.65). Today's decline is moderate and may reflect global growth concern from the oil shock, rather than a structural reversal.
Natural gas: Rose 2.54% to $3.265/MMBtu, bucking the commodity selloff. Natural gas remains 79.3% below its post-Ukraine ATH of $15.78 and 58.3% below its 52-week high of $7.83, but summer cooling demand provides seasonal support.
Crypto: No notable moves (>3%) in Bitcoin or Ethereum were reported in web search results today.
Sector & Theme Highlights
-
Energy crash: Today's dominant theme. The Iran deal is the largest geopolitical oil supply catalyst in years. US energy sector faces headwinds; Trump's DOJ investigation into oil company pricing adds regulatory uncertainty.
-
AI/Semiconductor nervousness: Micron Technology's −13% Tuesday selloff and cautious pre-market rebound (+4.1%) created a "hold and wait" tone for tech. The Nasdaq's −0.43% close (vs Dow's +0.35%) illustrates this bifurcation. Tonight's Micron earnings are the real-time verdict on AI memory demand and will likely drive Thursday's semiconductor-sector move globally.
-
Korean Kospi surge (+3.26%): The standout session performer globally. Likely driven by Samsung Electronics and SK Hynix optimism ahead of Micron results — Korea is the world's dominant DRAM/NAND memory exporter. If Micron beats, Korean tech stocks should extend gains Thursday.
-
Swiss SMI (+1.49%): Switzerland's index benefited from safe-haven allocation (Iran deal geopolitical recalibration), CHF strength (USD/CHF 0.8074), and the Swiss market's defensive character (Nestlé, Novartis, Roche dominate).
-
DAX underperformance (−0.62%): Germany's industrial and automotive exposure creates sensitivity to global trade and energy dynamics. The market may be pricing in tighter ECB conditions or uncertainty around the French fiscal situation.
-
Inflation as the defining macro theme: With CPI at 4.17% and Fed hike expectations building, the entire valuation framework for equities is under pressure. The negative S&P 500 ERP (−0.69%) quantifies this precisely: for the first time in this cycle, 10-year Treasuries beat S&P 500 earnings yield.
Top Stories (Global)
-
Trump signs Iran nuclear deal (24 Jun): A framework agreement with Iran clears a path for Strait of Hormuz reopening and potential sanctions relief. WTI −4.55%, Brent −5.06% — the largest single-day oil decline in months. If fully implemented, could add 1–2 mb/day to global supply and provide meaningful CPI relief.
-
Micron Technology Q3 FY2026 earnings after close: Analysts (FactSet consensus) expect EPS of $20.83 on revenue of $35.75bn — a roughly 3.8× revenue increase year-over-year, driven by the AI memory chip supercycle. TD Cowen raised price target to $1,500. Micron fell −13% Tuesday on broad AI profit-taking and rebounded +4.1% pre-market Wednesday. Tonight's result will set the tone for semiconductors, Korea, and the Nasdaq into Thursday.
-
US CPI 4.17% YoY (May 2026): Inflation re-accelerated sharply from a February 2026 low of 2.43%. BofA and Deutsche Bank both forecast three Fed rate hikes in H2 2026 (September, October, December). The PCE deflator (Fed's preferred measure) is due Thursday — a hot print would cement the hike consensus.
-
BOJ hiked to 1.0% on June 16 — highest since September 1995: Deputy Governor Himino signalled further hikes are on the table. JGB 10Y yield at ~2.67% is the highest this century. USD/JPY remains elevated at 161.56 despite the historic tightening, reflecting the enormous US–Japan rate differential.
-
OAT–Bund spread at ~91 bps: France 10Y OAT at 3.88% (highest since March 2026) vs German Bund 2.97% signals renewed French fiscal anxiety. The OAT spread at 91 bps is not crisis-level but is a watch item for EUR-denominated portfolio investors and anyone with French sovereign exposure.
-
Trump DOJ investigates oil companies over pump pricing: President Trump directed the DOJ to investigate whether oil companies are "not dropping their price at the pump commensurate with the sharply lower prices they are paying for Oil." Adds regulatory uncertainty to US energy sector on top of the Iran supply shock.
-
Fed Chair Warsh under political pressure: Sen. Elizabeth Warren stated the Fed is "in a box" given Trump's political stance against rate hikes and CPI's re-acceleration. Fed independence concerns are emerging as a market risk factor.
Looking Ahead
Next 5 trading days (25 Jun – 1 Jul 2026):
Thursday, 25 June: - 🇺🇸 PCE Deflator (May 2026) — the Fed's preferred inflation measure. Following CPI at 4.17%, a hot PCE reading would cement expectations for H2 Fed hikes. This is the week's most important data release. - 🇺🇸 Weekly Initial Jobless Claims — labour market pulse amid payroll softening. - 📊 Micron Technology post-earnings reaction — results released after today's (Wed) close; pre-market and cash-session reaction defines Thursday tech tone. - 🇬🇧 UK flash PMI already showed weaker UK economic momentum; UK gilts at 4.78% (10Y) reflect lingering market concern.
Friday, 26 June: - Quarter-end rebalancing flows (end of Q2 2026) may create above-normal volatility. - Watch for any pre-weekend geopolitical updates on Iran deal implementation.
Monday, 29 June – Wednesday, 1 July: - 🇨🇦 Canada Day (1 July) — Canadian markets closed. (Source: the Nager.Date holiday calendar) - Eurozone flash CPI estimate typically released at end of month — watch for June 2026 preliminary reading.
Upcoming closures (from the Nager.Date holiday calendar): - US: 3 July 2026 — Independence Day (observed, Saturday 4 Jul falls on a weekend → markets closed Friday 3 Jul). Only 7 trading days away. - Canada: 1 July 2026 — Canada Day. - No closures in US, GB, DE, FR, JP, AU, CH, KR, BR on 25–30 June 2026.
Central bank calendar: - Fed FOMC: Late July 2026 meeting. Rate hike probability rising on CPI trajectory. - ECB: July meeting. Rate at 2.25%; further easing remains possible if Eurozone growth slows. - BOJ: Next meeting late July. Deputy Governor Himino signalled continued tightening path; another 25 bps hike (to 1.25%) possible in H2 2026. - BOE: No immediate meeting. SONIA/base rate at ~3.73%; watch UK PMI data and May CPI follow-through.
Data sources and dates: FRED (Federal Reserve Economic Data) — US yields, macro, credit spreads, policy rates, EUR/USD, USD Index: as of 2026-06-23 unless noted (T10Y2Y, T10Y3M: 2026-06-24; ECBDFR, DFEDTARL/U: 2026-06-24; IUDSOIA: 2026-06-22; DEXUSEU/DTWEXBGS: 2026-06-18). ECB Yield Curve API: as of 2026-06-23. yfinance MCP: global equity indices, P/E proxies, commodity futures — as of 24 June 2026 session close. Web search: UK/Japan/France bond yields, USD/JPY, GBP/USD, USD/CHF, BOJ rate, and market news — 24 June 2026.