2026 08 28
Global Financial Briefing — Friday, 28 August 2026
Americas index levels, US-listed ETFs, commodities and day changes reflect the 28 August closing print; US Treasury figures, the curve spreads, the real yields and the US yield curve chart use Treasury's settled 28 August par and real curves. Currencies, macro releases, policy rates, the euro area bond rows and the ECB curve chart are dated inline.
Market Overview
Today was a hawkish repricing, and it started with one speech. Fed Chair Kevin Warsh used his Jackson Hole appearance to say the central bank "must be confident that underlying inflation is moving to our objective, clearly and at sufficient speed. Otherwise, we have work to do", and he put rate increases explicitly back on the table. Markets took him at his word: implied odds of a hike at next month's meeting closed at 57.5%, against 35.9% the day before (Axios, Washington Times, Kitco). That is a genuine regime shift in expectations, not a marginal tweak, and it is visible in almost every asset class on the screen today.
The clearest damage was in precious metals. Gold fell 2.88% to $4,529.90 and silver dropped 3.49% to $67.786. For gold that is the steepest one-day fall since 24 June, verified against the price history; silver has had larger down days as recently as 23 July. Metals with no yield are the most direct casualty of a higher-for-longer real rate path, and the move was concentrated in the hours after the speech: gold was quoted at $4,650.90 as late as 07:43 ET (Yahoo Finance) before giving up more than a hundred dollars and finishing just above its 200-day moving average near $4,526 (Kitco). The Treasury curve told the same story from the other direction, and the settled par curve for the session now confirms it: the 2-year rose 14 bp to 4.34%, the 5-year 10 bp to 4.48%, the 3-month 6 bp to 3.90% and the 10-year 6 bp to 4.73%, while the 30-year added only 3 bp to 5.22%. Note the shape of that: the front end and the belly moved between two and five times as much as the long bond. That is what a policy repricing looks like as opposed to an inflation scare, which would have hit the long end hardest.
US equities took it in stride, but unevenly. The Nasdaq 100 closed 0.70% lower and the S&P 500 0.25%, while the Dow finished essentially flat at -0.02%, the familiar pattern of long-duration technology bearing the brunt of a higher discount rate while value and financials hold. The dip was shallow enough that all three still finished the week higher (CNBC). Europe, closing hours before the worst of the repricing, had a genuinely good session: the CAC 40 rose 0.98%, the Euro STOXX 50 0.95% and the DAX 0.77%, the last of those finishing within a whisker of its all-time high. France had the best of it, recovering most of the previous session's 1.68% fall ahead of the Fitch review that had driven that fall, and which landed after the European close leaving the sovereign at A+ with a stable outlook. Asia was mixed and mostly closed before the news, with the exception of Korea, where the Kospi fell 1.79% and was the worst major index of the day. Underneath all of it, the volatility complex was untroubled: the VIX settled at 14.51 (FRED VIXCLS, 2026-08-27), and credit spreads are close to the tightest levels of this cycle. Investors have repriced the path of policy without yet repricing the risk of anything going wrong because of it.
One note on the fixed income tables below. Treasury's settled par curve for 28 August has since published, so the Government Bond Yields table, the curve spreads, the real yield decomposition and every figure feeding the valuation arithmetic are now the session's own settled close rather than the previous day's. The euro area rows remain dated 27 August, which is the freshest ECB publication available for them.
Global Indices Snapshot
Americas
| Index | Level | Day Chg | Day Chg % | Source |
|---|---|---|---|---|
| S&P 500 | 7,711.76 | -19.23 | -0.25% | yfinance ^GSPC |
| Nasdaq 100 | 29,433.43 | -208.13 | -0.70% | yfinance ^NDX |
| Dow Jones | 53,559.99 | -9.41 | -0.02% | yfinance ^DJI |
| Brazil IBOV | 175,664.62 | +529.22 | +0.30% | yfinance ^BVSP |
Americas data reflects the 28 Aug close. The S&P 500 close is confirmed independently at 7,711.76 by FRED SP500 (2026-08-28), matching to the cent.
Europe
| Index | Level | Day Chg | Day Chg % | Source |
|---|---|---|---|---|
| Euro STOXX 600 | 655.16 | +3.31 | +0.51% | yfinance ^STOXX |
| Euro STOXX 50 | 6,485.67 | +60.94 | +0.95% | yfinance ^STOXX50E |
| CAC 40 | 8,401.18 | +81.31 | +0.98% | yfinance ^FCHI |
| DAX | 26,569.99 | +202.75 | +0.77% | yfinance ^GDAXI |
| FTSE 100 | 10,824.26 | +31.72 | +0.29% | yfinance ^FTSE |
| SMI (Swiss) | 14,399.77 | +15.40 | +0.11% | yfinance ^SSMI |
European data reflects today's close (28 Aug).
Asia-Pacific
| Index | Level | Day Chg | Day Chg % | Source |
|---|---|---|---|---|
| Nikkei 225 | 66,405.56 | +273.59 | +0.41% | yfinance ^N225 |
| Hang Seng | 25,584.79 | +19.05 | +0.07% | yfinance ^HSI |
| Shanghai Comp | 3,952.18 | -4.39 | -0.11% | yfinance 000001.SS |
| ASX 200 | 9,092.30 | +54.10 | +0.60% | yfinance ^AXJO |
| Kospi (Korea) | 6,788.88 | -123.49 | -1.79% | yfinance ^KS11 |
Asia-Pacific data reflects today's close (28 Aug). Day changes were verified against the price history, because Yahoo Finance's previous-close field is one session stale for several of these tickers; the changes shown are correctly measured against 27 August closes.
Emerging Markets
| Index | Level | Day Chg % | Source |
|---|---|---|---|
| MSCI EM (EEM) | 67.14 | -0.70% | yfinance EEM |
| India Nifty 50 | 24,175.65 | +0.35% | yfinance ^NSEI |
| South Africa | 70.72 | -1.17% | yfinance EZA |
EEM and EZA are US-listed ETFs and reflect the 28 Aug close. The Nifty 50 reflects today's Indian close. South Africa's 1.17% fall is consistent with the metals complex: EZA is heavily weighted to precious-metals miners.
Index Valuations & Investment Risk
Valuation Table
| Index | Trailing P/E (live) | Hist avg trailing P/E (†) | Premium to hist mid |
|---|---|---|---|
| S&P 500 | 25.91x | ~16-18x | +52.4% |
| Nasdaq 100 | 30.62x | ~25-30x | +11.4% |
| Euro STOXX 600 | 18.07x | ~15-17x | +12.9% |
| CAC 40 | 17.23x | ~14-16x | +14.9% |
| DAX | 19.23x | ~15-17x | +20.2% |
| FTSE 100 | 18.20x | ~13-15x | +30.0% |
| Nikkei 225 | 22.34x | ~20-22x | +6.4% |
| MSCI EM | 17.41x | ~13-15x | +24.3% |
(†) Hist avg trailing P/E: static long-run reference constants, not live data. Live trailing P/E from Yahoo Finance on ETF proxies (SPY, QQQ, EXSA.DE, CAC.PA, EXS1.DE, ISF.L, 1321.T, EEM). Bold marks a premium above 20% to the historical midpoint.
Investment Risk Assessment for ETF Investors
United States (S&P 500 / Nasdaq ETFs)
The S&P 500 at 25.91x trailing earnings is 52% above the midpoint of its long-run range, which is the single most stretched reading in this table by a wide margin. Its earnings yield is 3.86% (1÷25.91) against a 10-year Treasury at 4.73% (US Treasury par curve, 2026-08-28), so the earnings yield gap is -0.87 pp: on the session's closing prices, the government bond pays more current income than the index does. Corrected onto a real basis, using the 10-year TIPS yield of 2.42% (US Treasury real curve, 2026-08-28), the gap is +1.44 pp. That correction is 2.31 pp wide and flips the sign, which is the point worth noticing: how this comparison reads depends almost entirely on whether you put both legs on the same inflation footing.
The index closed at 7,711.76, comfortably above its 50-day (7,557.96) and 200-day (7,114.32) moving averages and 1.3% below its 52-week high, so the technical picture is intact even after today. The risks are the familiar ones and today sharpened one of them. Concentration in a handful of large-cap AI names means the Nasdaq's 0.70% fall is not diversified away at the index level, and the whole complex is long-duration: if Warsh follows through and the policy path turns upward rather than downward, the discount rate moves against exactly the assets carrying the highest multiples. The Nasdaq 100 at 30.62x is only 11% above its own historical range, which sounds reassuring until you remember that range was itself set in a much lower-rate era.
Europe (STOXX 600 / CAC 40 / DAX ETFs)
European valuations are far less demanding. The STOXX 600 at 18.07x yields 5.54% (1÷18.07) against a euro AAA 10-year of 3.28% (ECB YC API, 2026-08-27), a euro earnings yield gap of +2.26 pp, against -0.87 pp in the US. On real yields the euro gap is +4.30 pp versus the US +1.44 pp.
That difference is real but it is not purely a statement about risk compensation. Part of it is simply that US and euro-area inflation and policy paths differ, and the euro real yield is the softer of the two numbers because it is constructed rather than traded (see Real Yields below). The US trades on a 43% higher multiple than the STOXX 600, a premium that has persisted for years and is partly justified by sector mix, but 52% above its own history is a different claim from being expensive relative to Europe.
The CAC 40 at 17.23x is the cheapest of the large European indices on this measure and had the best session of the day, up 0.98%, though at 8,401.18 it remains below both its 50-day average (8,463.44) and its 52-week high of 8,755.03. It is the one major index here trading under its 50-day line. The DAX is the opposite case: at 26,569.99 it closed essentially at its all-time high of 26,573.50, and at 19.23x it now carries a 20% premium to its own long-run range. French fiscal risk remains the specific European tail risk, though Fitch's A+ affirmation after the close takes the immediate rating catalyst off the table and leaves the September budget as the next test; the OAT-Bund spread discussed below is where to keep watching it.
On currency: a euro-based investor holding EUR-quoted European funds has no FX effect on the quoted value of the holding, but real exposure remains inside the earnings, since CAC 40 and STOXX 600 constituents are multinationals earning substantially abroad. The exposure is smaller and slower than in a USD-denominated fund, not absent.
Japan (Nikkei / TOPIX ETFs)
The Nikkei at 22.34x is the most reasonably valued major developed index relative to its own history, only 6% above midpoint, and it rose 0.41% today. The dominant variable is policy. The BOJ held at 1.00% on 31 July in an 8-1 vote, its underlying inflation gauge remains above 2%, and a board member has publicly floated a faster hike path (Bloomberg). Markets widely expect a move at the 17-18 September meeting. The 10-year JGB at roughly 2.88% is near multi-decade highs. For a euro-based investor the currency decision is likely to matter more than the equity call: at USD/JPY 159.35 the yen is historically weak, and a BOJ hike into a hawkish Fed is a genuinely two-sided setup. Corporate governance reform continues to provide a structural tailwind independent of the macro.
Emerging Markets (MSCI EM ETFs)
EEM at 17.41x is 24% above its historical range, which is a poor look for an asset class whose main attraction is meant to be its discount to developed markets. It fell 0.70% today, and a hawkish Fed is a straightforwardly negative input for EM: a firmer dollar tightens financial conditions across the complex. The China weight remains the dominant single factor, and Chinese equities were quiet today with the Shanghai Composite off 0.11% and the Hang Seng flat.
Overall Risk Score: High valuation risk in the US, low margin of safety. Moderate and closer to fair value in Europe and Japan. Emerging markets look less attractive than their reputation suggests on this measure. The common risk across all four, and the one that repriced today, is that the policy path may be pointing up rather than down.
Disclaimer: This is financial information, not personalised investment advice. Past valuations do not guarantee future returns. Consult a financial advisor before investing.
US Economic Indicators (FRED - authoritative)
| Indicator | Current | Prior | Delta | Reference Date | FRED Series |
|---|---|---|---|---|---|
| CPI YoY % | 3.30% | 3.46% | -0.16 pp | Jul 2026 | CPIAUCSL |
| Core CPI YoY % | 2.47% | 2.57% | -0.10 pp | Jul 2026 | CPILFESL |
| Unemployment Rate | 4.1% | 4.2% | -0.1 pp | Jul 2026 | UNRATE |
| Nonfarm Payrolls | -23k | +20k | -43k | Jul 2026 (m/m) | PAYEMS |
| 10Y TIPS Real Yield | 2.42% | 2.34% | +8 bp | 28 Aug / 27 Aug | DFII10 |
Note: FRED macro data is monthly and typically lags four to six weeks. The July reference month is unchanged from yesterday's briefing, so the prior-month comparisons are the same. The real yield row is daily and both legs come from the US Treasury real curve: 2.42% on 28 August against 2.34% on 27 August, 8 bp higher on the settled session and the only row here that moved with Friday's repricing.
Other economic releases:
| Indicator | Actual | Consensus | Prior | Surprise |
|---|---|---|---|---|
| US PCE price index YoY (Jul) | 3.7% | 3.6% | 3.7% | 0.1 pp hotter |
| US core PCE YoY (Jul) | 3.3% | 3.3% | 3.3% | in line |
| US PCE price index MoM (Jul) | +0.2% | +0.1% | — | above consensus |
| Euro area HICP YoY (Jul) | 2.9% | 2.9% | 2.8% | in line, accelerating |
The PCE report is the evidence behind today's speech. Headline PCE at 3.7% is running a full percentage point above the Fed's target and came in above consensus, while core at 3.3% matched expectations but is not falling. Set against payrolls that turned negative in July, this is the uncomfortable combination the Fed now has to choose between, and Warsh made it clear today which side he is weighting. In the euro area, HICP accelerated to 2.9% from 2.8%, driven by a 10.0% surge in energy inflation, with Germany at 2.8% (from 2.4%) and France at 2.4% (from 2.0%) (Eurostat).
Fixed Income & Bond Analysis
Policy Rates
| Central Bank | Rate | Source |
|---|---|---|
| Fed Funds (upper) | 3.75% | FRED DFEDTARU |
| Fed Funds (lower) | 3.50% | FRED DFEDTARL |
| Effective FFR | 3.63% | FRED DFF |
| ECB Deposit Rate | 2.25% | FRED ECBDFR |
| BOJ Policy Rate | 1.00% | web search |
| BOE Bank Rate | ~3.73% | FRED IUDSOIA (SONIA proxy, 2026-08-26) |
Government Bond Yields
| Country | 2Y Yield | 10Y Yield | 30Y Yield | Day Chg (10Y) | Source |
|---|---|---|---|---|---|
| USA | 4.34% | 4.73% | 5.22% | +6.0 bp | US Treasury par curve (2026-08-28) |
| Euro AAA | 2.79% | 3.28% | 3.73% | — | ECB YC API (2026-08-27) |
| France | — | 4.08% | — | — | web (2026-08-21) |
| UK | — | 5.03% | — | -1.0 bp | web (2026-08-28) |
| Japan | — | ~2.88% | — | — | web (2026-08-28) |
| Italy | — | 4.11% | — | +4.0 bp | web (2026-08-28) |
The US row is a single date throughout: all three maturities and the day change come from the 28 August par curve against the 27 August curve. The Germany row is shown as "Euro AAA" because it is the ECB's AAA-rated euro area composite rather than the Bund specifically; the most recent direct Bund quote retrievable was 3.24% as of 21 August, a week stale, so the composite is the better figure. The French OAT print is also a week old and should be treated as indicative.
The UK is the outlier in this table: a 10-year gilt above 5% is 30 bp over the equivalent Treasury and roughly 175 bp over the euro AAA curve, which is a substantial premium for a developed sovereign. The 2-year gilt was not retrievable today, so that cell is left blank rather than estimated.
Yield Curve Spreads (both recomputed from the 28 August par curve):
- 10Y-2Y spread: +39 bps, in from +47 bp on 27 August. Still positively sloped and normal, but 8 bp flatter on the day and well short of the roughly 75 bp where steep begins. The curve has been upward-sloping since the inversion cleared.
- 10Y-3M spread: +83 bps, unchanged on the day, because the 3-month and the 10-year both rose 6 bp. Comfortably positive and carrying no recession signal.
The point worth drawing out is what today did to the shape rather than the level. The settled curve bear-flattened: the 2-year rose 14 bp and the 5-year 10 bp against 3 bp at the 30-year, so the front end and the belly cheapened relative to the long bond, which is the characteristic response to a repricing of the near-term policy path rather than of inflation. Watch the 3-month too: at 3.90% it is now 27.5 bp above the Fed Funds target midpoint of 3.625%, a bill market leaning distinctly toward a hike.
OAT-Bund Spread: 83.6 bp as of 21 August, up 0.4 bp on that session (ideal-investisseur). This is a stale reference; no fresher print was retrievable today. At 83.6 bp French fiscal risk is priced as elevated but not acute. The more striking development is that the OAT-BTP gap has effectively closed, with the French 10-year at 4.08% against Italy's 4.11%. France now borrows at very nearly Italy's cost, which would have been an extraordinary statement a few years ago.
That convergence has to be read against Fitch's decision the same evening to leave France at A+ with a stable outlook. The affirmation removes the immediate downgrade risk without removing the fiscal trajectory that produced the repricing, and Fitch said as much, warning that widening deficits and political uncertainty could still force a downgrade later. Note that both the spread and the French 10-year quoted above predate the review, so neither reflects the market's response to it.
Yield Curve Charts
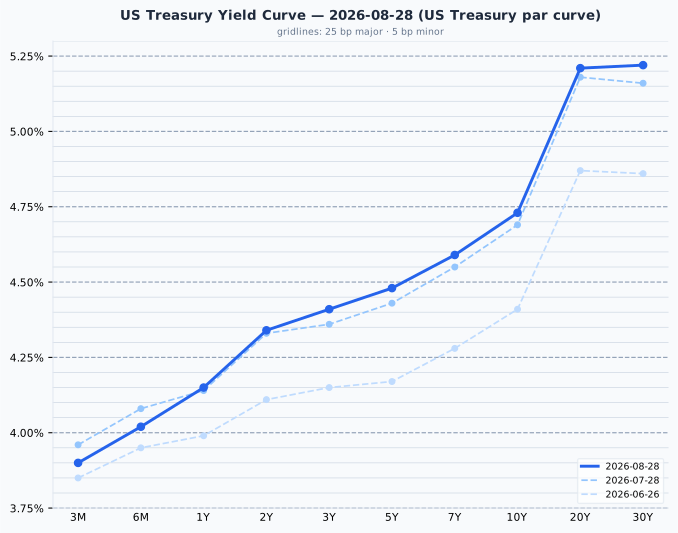
The US curve is upward-sloping across its whole length with a pronounced steepening beyond the 10-year, where the 20-year is at 5.21% and the 30-year at 5.22% while the 10-year is at 4.73%. Against a month ago the front end has richened while the long end has cheapened: the 3-month and the 6-month are both down 6 bp from 28 July, while the 30-year is up 6 bp, a continuation of the summer's long-end backup. Against two months ago the whole curve is higher and the move is strongly tilted to the back: 5 bp at the 3-month against 36 bp at the 30-year since 26 June. The chart is drawn from the settled 28 August curve, so it includes the session's repricing.
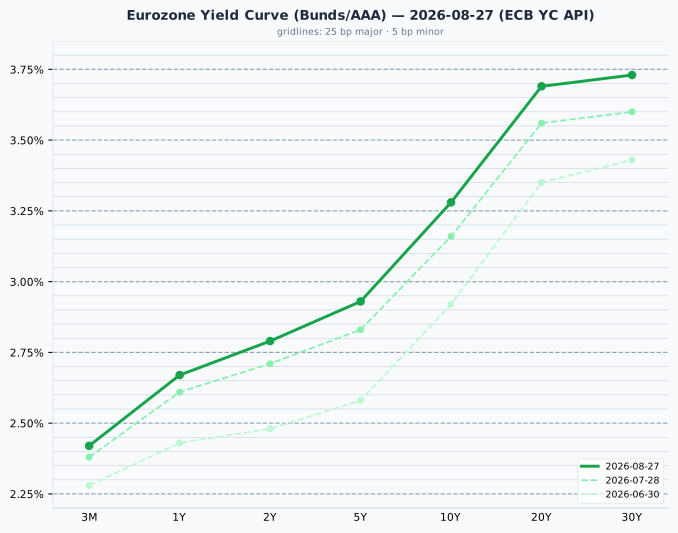
The euro AAA curve is smoothly upward-sloping from 2.42% at 3 months to 3.73% at 30 years, a total slope of 131 bp that is noticeably gentler than the US curve's. It has shifted up in parallel over the past month, with the 10-year rising 12 bp from 3.16% on 28 July and the 30-year 13 bp from 3.60%, and it is up substantially more than that against 30 June, when the 10-year stood at 2.92%. Europe has been repricing its own term premium steadily through the summer, independently of the Fed.
Credit Markets (from FRED - authoritative)
| Market | OAS Spread | Series ID |
|---|---|---|
| US Investment Grade | 79 bps | BAMLC0A0CM |
| US High Yield | 263 bps | BAMLH0A0HYM2 |
| Euro High Yield | 256 bps | BAMLHE00EHYIOAS |
All observations dated 2026-08-27. Every one of these is at or below the bottom of its normal range: US IG at 79 bp sits just under the 80 to 150 bp band, and US high yield at 263 bp is well inside the 300 to 500 bp range that constitutes normal conditions. This is historically tight pricing, not merely comfortable pricing. Euro high yield at 256 bp is tighter still than its US counterpart, an unusual ordering.
Tight spreads and a 14.51 VIX say the same thing: credit and volatility markets are pricing essentially no probability of the policy path damaging anything. That is the vulnerability rather than a reassurance. There is very little cushion in these levels if a hiking cycle actually materialises, because at 263 bp high yield is being paid almost nothing for the possibility.
Real Yields (US and Euro Area)
| Region | Nominal 10Y | Expected inflation | Real 10Y | How the real yield is obtained |
|---|---|---|---|---|
| United States | 4.73% | 2.31% (residual) | 2.42% | Measured. TIPS trade, so the market quotes a real yield directly; expected inflation is backed out as the residual (the breakeven) |
| Euro area | 3.28% | 2.04% (measured) | 1.24% | Constructed. No euro inflation-linked benchmark is published, so a survey expectation is subtracted from the nominal yield |
US figures from the US Treasury par and real curves (2026-08-28). Euro nominal from the ECB YC API (2026-08-27); euro inflation expectation is the ECB Survey of Professional Forecasters long-term HICP point estimate, 2.037% for 2026 Q3.
The two rows are built in opposite directions and only one of them is a price. In the US, TIPS trade, so the real yield is what the market quotes and expected inflation is what falls out. In the euro area there is no traded equivalent, so a survey number is subtracted from a nominal yield and the real yield is the residual. Treat the euro figure as the softer of the two. Two mismatches follow whenever the pair is compared: the US breakeven carries an inflation risk premium that a survey does not, and the SPF horizon is five years against the bond's ten.
Decomposing the 145 bp nominal gap between the two regions gives 27 bp of expected-inflation difference (2.31% against 2.04%) and 118 bp of real rate difference (2.42% against 1.24%). So this is overwhelmingly a real rate story, roughly four parts real to one part inflation, and not the inflation-differential explanation one might reach for by default. Note that the two legs are a day apart: the US curve is the 28 August settle and the euro nominal the 27 August ECB publication, so a small part of the widening is the US session the euro leg has not yet seen.
The US-euro real rate gap is not an opportunity
The US real yield has exceeded the euro one in every quarter since 2014, and today's 118 bp gap is close to the long-run average. It is a structural feature reflecting higher US trend growth, euro-area excess savings, Bund scarcity and US fiscal supply. It is not something a euro-based reader can capture. Hedging the currency cancels it almost exactly, because the forward rate is set precisely to remove the interest differential, and unhedged it is a currency bet rather than a bond decision. A real yield is real in its own currency: 2.42% means 2.42% above US inflation, which is not a real return for anyone who spends euros. The gap's survival across twelve years is itself the proof that it is compensation for risk borne by dollar investors rather than a free lunch anyone forgot to take.
Bond Portfolio Implications
The earnings yield gap compares what the two instruments pay today, using nothing but quoted prices. For the S&P 500 it is (1÷25.91) − 4.73% = -0.87 pp, and for the STOXX 600 it is (1÷18.07) − 3.28% = +2.26 pp. On real yields those become +1.44 pp and +4.30 pp respectively.
Read that as a description of today's trade-off and nothing more. It says a US investor can lock a 4.73% nominal Treasury coupon or accept full equity risk for 3.86% of current earnings yield, which is an unusually unattractive-looking swap on its face. It does not forecast which will win, and it should not be read as one: adding the bond yield to the earnings yield empirically makes the equity forecast worse than the earnings yield alone. Two biases are worth naming while the number is in view. It ignores growth, since a bond coupon is fixed for a decade while the earnings behind the equity leg grow roughly with inflation, and the real-yield version above is the clean correction for that. And an equity holder does not actually receive the full earnings yield in cash, only the dividend and buyback portion, with the rest retained.
The cross-country comparison needs the same care. Part of the difference between +2.26 pp and -0.87 pp is the difference between two currencies and two policy stances, not a difference in risk compensation, which is why the real-yield pair is quoted alongside it.
Are yields high enough to make bonds attractive? At the front end, increasingly yes, and today made that case stronger. A 2-year at 4.34%, 14 bp higher on the day, with the policy path possibly turning upward is a reasonable place to sit, and it carries a fraction of the duration risk. The long end is where the caution belongs: a 100 bp rise in yields costs roughly 8 to 9% on a 10-year bond, and today's move was a reminder that the direction of the next policy surprise is no longer obviously downward. Short duration is being paid decently and is the more defensible position in this environment.
Currencies & Commodities
Currencies:
| Pair | Rate | Source |
|---|---|---|
| EUR/USD | 1.1684 | FRED DEXUSEU (2026-08-21) |
| USD Index | 118.06 | FRED DTWEXBGS (2026-08-21) |
| USD/JPY | 159.35 | web search |
| GBP/USD | 1.3595 | web search |
| USD/CHF | 0.8039 | web search |
The two FRED series are a week stale, so they do not reflect today's move; a hawkish Fed repricing would ordinarily firm the dollar, and the more current cross-rates above are the better guide. At 159.35 the yen remains historically weak, which is the tension the BOJ carries into its September meeting.
Commodities (front-month futures):
| Commodity | Price | Day Chg % | Ticker | Source |
|---|---|---|---|---|
| Brent Crude | $88.10 | -0.47% | BZ=F | yfinance |
| WTI Crude | $83.40 | -0.16% | CL=F | yfinance |
| Gold ($/oz) | $4,529.90 | -2.88% | GC=F | yfinance |
| Silver ($/oz) | $67.786 | -3.49% | SI=F | yfinance |
| Copper ($/lb) | $6.6590 | -0.45% | HG=F | yfinance |
| Nat Gas ($/MMBtu) | $2.888 | -0.89% | NG=F | yfinance |
Day changes are the final trade of the 28 August session against the prior session's settlement (27 August). These are the session's closing last trades, not settlement prices: exchange settlements for 28 August had not published in time, so a settlement-to-settlement figure was not available. Each front-month generic still points at the contract quoted here, so no contract roll distorts the comparison.
Precious metals are the story. Gold at $4,529.90 is 18.9% below its all-time high of $5,586.20, set on 29 January 2026, and silver at $67.786 is 44.1% below its all-time high of $121.30 from the same date. Both records are recent enough to be meaningful reference points rather than historical curiosities, and both metals have given up a substantial part of their extraordinary run since. Today's declines are the single-day expression of exactly the mechanism that drove that run in reverse: a non-yielding asset reprices when the expected real rate path shifts upward.
Copper is the interesting counterpoint. At $6.6590 it fell only 0.45% and closed within 2% of its all-time high of $6.75, 1.3% below a record set on 26 August, just two sessions ago. Copper's demand story, driven by electrification and grid investment, is evidently strong enough to shrug off a monetary repricing that hit the metals traded primarily as stores of value. That divergence within the metals complex on a single day is itself informative about what is driving each.
Energy was quiet. WTI at $83.40 sits in the middle-lower part of its 52-week range of $54.98 to $119.48, and Brent at $88.10 similarly against a $58.72 to $126.10 range. Both have come well off the highs reached earlier in the year when US-Iran hostilities lifted energy inflation. Natural gas at $2.888 is near the bottom of its 52-week range of $2.483 to $7.827, seasonally unremarkable.
A note on contracts: the Brent generic reports an underlying of BZX26 (the November contract) while its stated expiry of 31 August corresponds to September's. The two disagree, which means the generic has already rolled and the stated expiry is lagging, so no imminent roll discontinuity should be expected in the Brent quote. WTI is on CLV26 (October, expiring 22 September), gold on GCZ26 (December), silver and copper on their December and September contracts respectively, and natural gas on NGV26 (October). None was close enough to expiry to distort this session's comparison, and re-checking each generic against the contract quoted here confirmed no roll had occurred.
Crypto: no data retrieved today.
Sector & Theme Highlights
Precious metals and their miners were the worst place to be today. Gold down 2.88% and silver down 3.49% is a large move for a single session in either metal, and the effect propagated into equity indices with heavy mining weights. South Africa's EZA fell 1.17%, the weakest of the emerging market proxies, which is consistent with its precious-metals exposure rather than a South Africa-specific event.
Technology underperformed on rate duration. The Nasdaq 100's 0.70% fall against the Dow's 0.02% is a textbook discount-rate rotation. High-multiple, long-duration growth is the most rate-sensitive corner of the equity market, and a repricing toward possible hikes hits it first.
European equities decoupled, at least for one session. The CAC 40 up 0.98% and the DAX up 0.77% into a record close is a striking divergence from the US tape. Timing explains part of it, since European markets closed at 17:30 to 18:00 CEST while the US repricing was still developing, so the next session is the real test of whether Europe absorbs the news or shrugs it off. With the LSE shut on Monday for the Summer Bank Holiday, that test arrives without the FTSE 100.
Copper against gold is the theme worth watching. Industrial demand held copper 1.3% off a record on the same day monetary policy expectations knocked nearly 3% off gold. Electrification and grid capital expenditure are proving to be a genuinely different driver from the monetary one that has powered precious metals, and days like today separate them cleanly.
Korea broke ranks in Asia. The Kospi's 1.79% fall stands out against gains in Tokyo and Sydney. It follows a remarkable twelve months in which the index traded between 3,135 and 9,386, and at 6,788.88 it is well below both its 50-day average of 7,200.93 and its 52-week high. That is a market digesting a very large move rather than reacting to today's Fed news, most of which broke after the Seoul close.
Top Stories (Global)
-
Warsh puts rate hikes back on the table at Jackson Hole. The Fed Chair said the central bank "must be confident that underlying inflation is moving to our objective, clearly and at sufficient speed. Otherwise, we have work to do", and signalled that increases are in play if inflation does not fall. Market-implied odds of a hike next month closed at 57.5%, up from 35.9% the day before (Axios, Washington Times, Kitco). This puts him at odds with President Trump, who has pressed publicly for cuts.
-
Gold and silver sell off hard. Gold fell 2.88% to $4,529.90 and silver 3.49% to $67.786, the clearest asset-market expression of the repricing. Gold had been quoted at $4,650.90 as recently as 07:43 ET before the speech landed (Yahoo Finance), and finished barely above its 200-day moving average near $4,526 (Kitco).
-
July PCE ran hotter than expected on the headline. Headline PCE at 3.7% year on year beat consensus by 0.1 pp and core matched at 3.3%, with the monthly headline at +0.2% against +0.1% expected (CBS News, Invezz). Inflation is not descending toward target at a pace that supports easing, which is the substantive case behind today's speech.
-
US tech leads Wall Street lower while blue chips hold. The Nasdaq 100 closed down 0.70% against the Dow's 0.02%, with the S&P 500 off 0.25%, a clean duration-driven split. All three indices still finished the week higher (CNBC).
-
The preliminary payrolls benchmark revision came in far smaller than feared. March 2026 employment was revised down by 79,000 jobs, a fraction of the adjustment some traders had positioned for (Kitco). A large downward revision would have been the strongest available counter to the hawkish case; a small one removed it, which is part of why the hike-odds move held through the close.
-
BOJ's underlying inflation gauge stays above 2%, supporting September hike expectations. A board member has flagged that the pace of increases could exceed market expectations (Bloomberg). The 10-year JGB near 2.88% is close to multi-decade highs, and the meeting is on 17-18 September.
-
Europe rallies to a DAX record. The DAX closed at 26,569.99, effectively at its all-time high of 26,573.50, with the CAC 40 up 0.98% and the Euro STOXX 50 up 0.95%, all before the full US repricing had developed.
-
Fitch left France at A+ with a stable outlook. The scheduled review was the most immediate risk event on the European calendar and it landed after the European close with no change. Fitch cited France's large, diversified economy, its solid banking sector and its diverse investor base, while repeating that widening deficits and political uncertainty could still force a downgrade later (Bloomberg, franceinfo, La Libre). French assets had sold off into the review the day before, with the CAC 40 down 1.68% and the worst showing among major indices; the 0.98% recovery came as a status quo outcome became the consensus expectation (Euronews).
-
Euro area inflation accelerated to 2.9% in July on an energy surge. Energy inflation jumped to 10.0% from 8.5% as US-Iran hostilities resumed, with Germany at 2.8% and France at 2.4% (Eurostat). The ECB deposit rate remains at 2.25%.
Looking Ahead
Central banks - Fed follow-through is now the dominant question. Watch for other FOMC members either endorsing or walking back Warsh's framing over the coming week; the divergence between the Chair and the committee is the thing to track. The next FOMC decision is in September. - BOJ meets 17-18 September with a hike widely expected. Yen positioning into that meeting is a live risk given USD/JPY at 159.35. - ECB is on hold at 2.25% with euro area inflation at 2.9% and accelerating on energy, which argues against any near-term easing.
Economic releases (next 1-5 trading days) - Euro area flash HICP for August is due in the coming days and is the key European datapoint, particularly given July's energy-driven acceleration. - The US employment report for August is the next major release and is unusually important after July's -23k payrolls print. If the labour market weakens further, it directly contradicts the hawkish case Warsh made today, and that tension will drive the tape. - Global manufacturing and services PMIs for August arrive at the start of September.
Market closures (Nager.Date holiday calendar, 2026): - Monday 31 August: United Kingdom, Summer Bank Holiday. The LSE is closed, so no FTSE 100 print on Monday. - Monday 7 September: United States and Canada, Labour Day. Brazil, Independence Day. US and Canadian markets closed; a three-day weekend for Wall Street. - No closures in Germany, France, Japan, Australia, Switzerland or Korea within the next twelve days. Indian holiday data is unavailable for 2026, so Indian closures could not be checked and are not asserted here.
Other - The French budget proposal from the Lecornu minority government is expected in late September. With the Fitch review resolved, it is the substantive event behind the OAT repricing and the main French catalyst left on the calendar. - Earnings season is largely finished for the major indices, leaving macro and policy as the dominant drivers into September.