2026 09 11
Global Financial Briefing — Friday, 11 September 2026
Americas index levels, commodities and day changes reflect the 11 September closing print; US Treasury figures and the US yield curve chart use Treasury's settled 11 September par curve. Euro area bond rows, the ECB curve chart, FX and macro figures are dated inline.
Market Overview
The last inflation print before the FOMC landed exactly where it was expected, and the market treated a hot number that met consensus as a relief. August CPI rose 0.4% on the month and 3.4% on the year (FRED CPIAUCSL puts the annual rate at 3.35%, up from 3.30% in July), and core CPI 0.3% on the month against 0.2% expected with the annual core rate at 2.4% (FRED CPILFESL 2.45%, down from 2.47%). That combination, headline drifting higher on energy while core stays a touch under two and a half, is what the Fed has to weigh on Wednesday, and the market's answer was to raise the odds of a 25 bp hike to roughly 90% on the CME FedWatch tool from about 70% before the data. What kept it from being a bond-market event was oil. Iranian state media said Tehran would meet Gulf states in Oman to discuss the Strait of Hormuz, and Oman is reported to be trying to gather GCC and Iranian foreign ministers in Salalah on Monday, the first such meeting since the war began more than six months ago. Brent settled at $104.61, down 2.81% against Thursday's $107.63 settlement, and WTI at $100.05, down 2.37%, after trading below $100 during the session. That is a retracement of just under three percent in a week in which Brent is still up about 8%, so it is a pause in the shortage story rather than a reversal of it, but it was enough to turn the week's fourth straight equity decline into a bounce.
The S&P 500 closed at 7,656.98, up 0.86%, the Nasdaq 100 up 0.91% and the Dow up 0.98%, all three ending a four-session losing run that had been the longest since March, though each finished below its midday high. The bounce was oil and CPI rather than the AI trade: Oracle, up about 8% in the morning after a first-quarter beat and a $664bn cloud backlog, closed down 1.74% at $150.28 as the market moved from the backlog to the margin and the capex plan underneath it (see the Special Analysis). The settled Treasury curve for 11 September shows the front end doing the moving: the 2-year rose 7 bp to 4.63%, the 3-month bill 7 bp to 4.07%, the 5-year 3 bp to 4.78% and the 10-year 1 bp to 4.96%, a new high since October 2023 after Thursday's 12 bp jump, while the 30-year fell 2 bp to 5.35%. The 10Y-2Y spread flattened to 33 bp from 39, the front end still climbing toward next week's hike while the long end held. The consumer is where the day's tension shows: the University of Michigan's preliminary September sentiment index fell to 47.8 from 51.7, the second-lowest reading on record, with one-year inflation expectations jumping to 4.6% from 4.0% and the five-year measure to 3.4%. A Fed hiking into that is hiking into a consumer who already believes the inflation and does not believe the growth; the expectations component fell to 45.8 from 51.5.
Europe recovered too, the STOXX 600 closing up 0.49% at 639.10 after two sessions of losses, the CAC 40 up 0.78%, the DAX up 0.82%, banks and aerospace leading (Santander +1.3%, Airbus +1.6%, Safran +2%), and the FTSE 100 up 0.39% after UK GDP for July surprised at +0.4% against a flat consensus. The euro area bond market did not join the rally: the ECB AAA curve for 10 September, published today, put the 10-year at 3.50%, up 7 bp from 3.43% on the 9th, and the 2-year at 3.10%, up 12 bp, the market's second day of pricing Thursday's hike and the ones it thinks follow. Friday-morning quotes had the Bund at about 3.50%, the French OAT at 4.44% (a 94 bp spread) and the Italian BTP at 4.37%, so Italy trades inside France by 7 bp; the 10-year gilt eased toward 5.35% after touching 5.378% on Thursday, its highest since 2007, with the 30-year gilt at 5.948%, a level last seen in 1998. Asia took the worst of it because it traded first, on Thursday's oil and yields and before the Oman news: the Nikkei fell 1.93% to 64,011.34, the Kospi 1.76%, with Samsung Electronics, SK Hynix and Kioxia sold on the combination of $100 oil, a 4.95% Treasury and a BOJ that 97% of economists now expect to raise rates to 1.25% on 18 September. The JGB 10-year rose to 2.965% and the 30-year to 4.055%. Copper settled flat at $6.548/lb, gold flat at $4,408.90, the VIX 17.84 (FRED VIXCLS, 10 September), moderate, and US high yield at 270 bp and investment grade at 80 bp still historically tight. The 50 bp of curve repricing in a month has not moved credit by ten.
Global Indices Snapshot
Americas
| Index | Level | Day Chg | Day Chg % | Source |
|---|---|---|---|---|
| S&P 500 | 7,656.98 | +65.28 | +0.86% | yfinance ^GSPC |
| Nasdaq 100 | 29,368.44 | +264.93 | +0.91% | yfinance ^NDX |
| Dow Jones | 52,573.29 | +509.19 | +0.98% | yfinance ^DJI |
| Brazil IBOV | 187,206.89 | -1,061.71 | -0.56% | yfinance ^BVSP |
Americas data reflects the 11 Sep close. FRED's SP500 series reports the 11 September close at 7,656.98, matching the yfinance figure to the cent, and the 10 September close at 7,591.70, which the day change is measured against. All three US indices closed below their midday highs (the S&P 500 had been up 1.01% at 12:46 ET), and the Bovespa's afternoon was worse than its morning: it closed down 0.56%, giving back a good part of Thursday's 1.42% gain as crude fell, the mirror image of Thursday, when it was the only major index to rise. The S&P 500 is 2.0% below its record of 7,816.70 and back above its 50-day average (7,603.86) by 0.7%; the Dow remains just under its own (52,961.85).
Europe
| Index | Level | Day Chg | Day Chg % | Source |
|---|---|---|---|---|
| Euro STOXX 600 | 639.10 | +3.13 | +0.49% | yfinance ^STOXX |
| CAC 40 | 8,179.77 | +63.01 | +0.78% | yfinance ^FCHI |
| DAX | 25,568.56 | +207.41 | +0.82% | yfinance ^GDAXI |
| FTSE 100 | 10,650.44 | +41.52 | +0.39% | yfinance ^FTSE |
| SMI (Swiss) | 13,775.27 | +35.17 | +0.26% | yfinance ^SSMI |
European data reflects today's cash close (11 Sep). The Euro STOXX 50 closed at 6,325.13, up 0.90%. For the CAC 40, DAX, FTSE 100 and SMI, yfinance's previousClose field again lags a session and does not equal price − change; the day changes shown reconcile exactly with the 10 September closes published yesterday (8,116.76, 25,361.15, 10,608.90 and 13,740.10), so the change fields are the ones to trust. On the week the STOXX 600 is still down about 1.6%, and it remains 1.6% below its 50-day average and 3.7% below its record of 663.41. The CAC 40 is the weakest of the group on the moving averages, 3.1% under its 50-day and now marginally (0.7%) below its 200-day at 8,240.
Asia-Pacific
| Index | Level | Day Chg | Day Chg % | Source |
|---|---|---|---|---|
| Nikkei 225 | 64,011.34 | -1,259.61 | -1.93% | yfinance ^N225 |
| Hang Seng | 24,805.63 | -148.84 | -0.60% | yfinance ^HSI |
| Shanghai Comp | 3,888.11 | -46.29 | -1.18% | yfinance 000001.SS |
| ASX 200 | 8,741.20 | -78.20 | -0.89% | yfinance ^AXJO |
| Kospi (Korea) | 6,909.91 | -124.01 | -1.76% | yfinance ^KS11 |
Asia-Pacific data reflects today's close (11 Sep). The Hang Seng, Shanghai and ASX 200 previousClose fields lag a session; the changes shown reconcile with yesterday's published closes (24,954.47, 3,934.40 and 8,819.40). The region closed before the Oman headlines and before US CPI, so it priced Thursday's $107 Brent and 4.95% Treasury with nothing to offset them. The Nikkei's loss was reported at more than 2.7% intraday before it recovered into the close; it is now 12.1% below its record of 72,831.73 and 3.4% below its 50-day average, though still 8% above its 200-day. The Kospi, 26% below its record of 9,385.59, is still 12.9% above its 200-day average, which is what a 4.6% single-day gain earlier this week does to the arithmetic. Shanghai fell below its 50-day average.
Emerging Markets
| Index | Level | Day Chg % | Source |
|---|---|---|---|
| MSCI EM (EEM) | 67.84 | +1.25% | yfinance EEM |
| India Nifty 50 | 23,398.10 | -0.34% | yfinance ^NSEI |
| South Africa | 70.10 | +0.81% | yfinance EZA |
EEM and EZA are USD-denominated ETF proxies at the 11 September NYSE close. EEM rose more than the S&P 500 despite the Korean and Hong Kong closes it carries having already printed lower, which says the ETF priced the post-Oman, post-CPI world that those markets had not yet traded. The Nifty 50 is a settled 11 September close; its previousClose lags a session and the change reconciles with yesterday's 23,477.80. It is 3.2% below its 50-day average and 4.7% below its 200-day, the weakest of the emerging market rows on trend.
Index Valuations & Investment Risk
Valuation Table
| Index | Trailing P/E (live) | Hist avg trailing P/E (†) | Premium to hist. midpoint |
|---|---|---|---|
| S&P 500 | 24.73x | ~16-18x | +45% |
| Nasdaq 100 | 29.18x | ~25-30x | +6% |
| Euro STOXX 600 | 17.76x | ~15-17x | +11% |
| CAC 40 | 16.63x | ~14-16x | +11% |
| DAX | 18.11x | ~15-17x | +13% |
| FTSE 100 | 15.29x | ~13-15x | +9% |
| Nikkei 225 | 21.21x | ~20-22x | +1% |
| MSCI EM | 14.45x | ~13-15x | +3% |
(†) Hist avg trailing P/E: static long-run reference constants, not live data. Trailing P/E (live): yfinance trailingPE on ETF proxies SPY, QQQ, EXSA.DE, CAC.PA, EXS1.DE, ISF.L, 1321.T and EEM, fetched 11 September at 18:46 CEST; the US and EM proxies were intraday at that point, but the close-priced values (SPY 24.69x, QQQ 29.14x, EEM 14.43x) differ by less than 0.2%, so the table stands.
The S&P 500 at 24.7x is the only index in the table more than 20% above its long-run range, and today's 1% rally has taken it back toward the 24.9x it carried at the start of the week. Everything else sits within 15% of its historical band. The Nikkei at 21.2x and MSCI EM at 14.4x are essentially at their averages, and after a 1.9% and 1.8% loss respectively the Japanese and Korean markets are the two where the price has moved most against the multiple this week.
Investment Risk Assessment for ETF Investors
United States (S&P 500 / Nasdaq ETFs)
The S&P 500's earnings yield is 4.04% (1÷24.73). Against the settled 10-year Treasury at 4.96% (US Treasury par curve, 11 September) the earnings yield gap is −0.92 pp: the bond pays 92 bp more than the equity index earns, before growth. The gap has widened from the bond side: the 10-year has risen 24 bp in a month while the multiple has barely moved. On a real basis the picture reverses: the 10-year TIPS yield is 2.60% (US Treasury real curve, 11 September, up 5 bp on the day), so earnings yield less real yield is +1.44 pp, the inflation correction worth about 2.4 pp. The Nasdaq 100 at 29.2x yields 3.43%, 1.53 pp below the nominal 10-year.
The index is 2.0% below its record of 7,816.70 and, after today's bounce, 0.7% above its 50-day average and 7.0% above its 200-day. The Nasdaq 100 is 4.5% below its record. Concentration risk has a fresh data point, and it cuts the other way from how the morning read it: Oracle's $664bn remaining performance obligation and 121% cloud infrastructure growth are what a 24.7x index needs the AI capex complex to keep delivering, and the stock's round trip from up 8% to a 1.74% loss at the close, on a 61% gross margin and a $90bn to $95bn capex plan, is the market saying backlog alone no longer clears the bar. The S&P 500 held its gain without Oracle, which locates the day's bounce in oil and CPI rather than in AI. Rate sensitivity is the live risk. A Fed hike next week is now roughly 90% priced; a 2-year at 4.63% and a 5-year at 4.78% say the market expects it to stick, and the University of Michigan five-year inflation expectation at 3.4% is the number that would make the dot plot uncomfortable. Nothing in today's CPI argues against the hike, and the only thing arguing for a pause is a consumer sentiment reading two points above its record low.
Europe (STOXX 600 / CAC 40 / DAX ETFs)
The STOXX 600's earnings yield is 5.63% (1÷17.76) against an AAA euro 10-year of 3.50% (ECB YC API, 10 September), a euro earnings yield gap of +2.13 pp, down from the 2.4 pp it carried a week ago as the Bund has risen and the index has fallen. The CAC 40 yields 6.01% (1÷16.63) and the DAX 5.52% (1÷18.11). The US index trades at a 39% premium to the STOXX 600 on trailing earnings (24.73 against 17.76), a spread that has been roughly stable all summer.
The US gap at −0.92 pp against the euro gap at +2.13 pp is a 3.1 pp difference, and part of it is the difference between the two currencies' inflation and policy paths rather than a difference in risk compensation. The real-yield version is the check: the US real gap is +1.44 pp and the euro real gap is +4.16 pp (5.63% less a constructed euro real 10-year of 1.47%), so the difference narrows to 2.7 pp on a real basis. Most of the nominal difference survives the correction, which says it is largely a valuation difference, not an inflation artefact; see the Real Yields section for how the euro figure is built and why it is the softer of the two.
The risks are the ones the bond market is pricing. The ECB hiked into a 3.3% headline HICP driven by energy, the AAA 2-year has risen 39 bp in a month, and the OAT-Bund spread at about 94 bp leaves French fiscal risk where it was before the summer. On currency: a EUR-based holder of EUR-quoted European funds has no FX effect on the quoted value of the holding, but STOXX 600 and CAC 40 constituents earn abroad, so the dollar and the yen sit inside the earnings whether or not they show in the price. That exposure is smaller and slower than holding a US fund unhedged, and partly offset by foreign cost bases, but it is not absent.
Japan (Nikkei / TOPIX ETFs)
The Nikkei at 21.2x is on its long-run average and 12.1% below its record after a third straight loss. The 18 September BOJ decision is now a near-consensus hike to 1.25%, the JGB 10-year at 2.965% and the 30-year at 4.055% have already moved to meet it, and the yen has firmed more than 3% in a month to 154.17. For a EUR-based investor the hedging decision is the larger question: an unhedged Nikkei ETF has had the yen working for it this month even as the index fell, and a hedge that was cheap when Japanese rates were zero costs more every time the BOJ moves. The semiconductor weight (Kioxia, plus the Korean read-across) is what fell today, and it is the part of the index most exposed to US yields.
Emerging Markets (MSCI EM ETFs)
EEM at 14.4x trades at a 42% discount to the S&P 500 on trailing earnings and 3% above its own long-run range. It is 5.2% below its 52-week high of 71.57, above both moving averages (65.83 and 61.96), and rose 1.25% on a day the Korean and Hong Kong closes it carries fell, so it priced the Oman news before those markets could. The risks are a dollar backed by a 4.96% 10-year and a Fed hike, Korea's index at 26% below its record and 13% above its 200-day, and China, where Shanghai has dropped below its 50-day average. The Nifty is the trend laggard in the group.
Overall Risk Score (qualitative, not financial advice): - United States: high valuation risk / low margin of safety. 24.7x trailing, a negative nominal earnings yield gap of 92 bp and a central bank about to hike. - Europe: moderate, fair value with mixed signals. Multiples within 15% of range and a positive gap above 2 pp, against a rising Bund and a hiking ECB. - Japan: moderate. Average multiple, a 12% drawdown from the record, and a BOJ hike that is priced but not yet delivered. - Emerging markets: moderate, relative value. The lowest multiple in the table with the dollar and the Korean chip cycle as the swing factors.
Disclaimer: This is financial information, not personalised investment advice. Past valuations do not guarantee future returns. Consult a financial advisor before investing.
US Economic Indicators (FRED - authoritative)
| Indicator | Current | Prior | Delta | Reference Date | FRED Series |
|---|---|---|---|---|---|
| CPI YoY % | 3.35% | 3.30% (Jul) | +5 bp | Aug 2026 | CPIAUCSL |
| Core CPI YoY % | 2.45% | 2.47% (Jul) | −2 bp | Aug 2026 | CPILFESL |
| Unemployment Rate | 4.1% | — | — | Aug 2026 | UNRATE |
| Nonfarm Payrolls | +162k | — | monthly chg | Aug 2026 | PAYEMS |
| 10Y TIPS Real Yield | 2.55% | 2.55% (9 Sep) | 0 bp | 10 Sep 2026 | DFII10 (US Treasury real curve) |
The August CPI released this morning is already in FRED, so the headline and core rates above are today's print; the prior-month rates are the July observations recorded in yesterday's briefing. Only the latest observation was retrieved for the unemployment and payrolls series, so those Prior and Delta cells are left blank rather than filled from memory. The TIPS prior is the 9 September figure from yesterday's briefing; the real 10-year was unchanged on the 10 September curve.
Other economic releases today (web search):
| Release | Actual | Consensus | Prior | Reaction |
|---|---|---|---|---|
| US CPI, Aug, m/m | +0.4% | +0.4% | — | In line |
| US CPI, Aug, y/y | 3.4% | 3.4% | 3.3% | In line; Fed hike odds rose to ~90% |
| US core CPI, Aug, m/m | +0.3% | +0.2% | — | Hotter by 0.1 pp |
| US core CPI, Aug, y/y | 2.4% | 2.4% | 2.5% | In line |
| UMich sentiment, Sep prelim | 47.8 | 51.0 | 51.7 | Second-lowest on record; expectations 45.8 from 51.5 |
| UMich 1y inflation expectations | 4.6% | — | 4.0% | Highest since June |
| UMich 5y inflation expectations | 3.4% | — | 3.3% | Higher |
| UK GDP, Jul, m/m | +0.4% | 0.0% | +0.3% | Beat; services +0.6%, production and construction −0.5% |
| UK GDP, 3m/3m to Jul | +0.4% | — | +0.4% | Eighth consecutive three-month gain |
The CPI print was the consensus number, which after Thursday's 5.4% PPI counted as good news, and the equity market rallied on it while the rate market took it as confirmation of next week's hike. The core monthly figure at 0.3% is the one an inflation hawk would point to: it is the second decimal of a 2.4% annual rate that the energy pass-through has not yet reached. The Michigan survey is the day's ugly number. Sentiment at 47.8 is within two points of the record low set in May, and the jump in one-year inflation expectations to 4.6% is the fuel-price shock arriving in household psychology in the same week the Fed prepares to raise rates. The UK's +0.4% month was driven by professional services and computer programming, a services economy growing while production and construction contract, and it firmed sterling and helped the FTSE without touching the gilt market's problem.
What the Michigan survey is. The University of Michigan Surveys of Consumers is a monthly poll of several hundred US households, run since the late 1940s, asking how they judge their own finances, business conditions and whether it is a good time to buy big-ticket items. The headline Index of Consumer Sentiment is scaled to 1966 = 100; readings in the 90s were normal in 2018 and 2019, so 47.8 is a household sector describing conditions as worse than at the 2022 inflation peak. It splits into a Current Conditions index and an Expectations index, and today it is the forward-looking half that has collapsed, to 45.8 from 51.5. The survey also asks what inflation households expect over one year and over five to ten years, and those two series are the Fed's longest-running gauge of whether inflation expectations are anchored: a five-year figure at 3.4% and rising is the survey telling the committee that they are slipping, which is why a hike into a sentiment reading this weak is not the contradiction it looks. Two caveats apply. This is the preliminary September estimate, taken from roughly the first two-thirds of interviews, and the final print on 25 September can move it by a point or two. And it measures mood rather than spending: households have reported feeling terrible while continuing to spend for several years now, which is why Tuesday's retail sales are the first hard test of whether this month's mood is reaching behaviour. The Conference Board's confidence index, the other main US consumer survey, leans on the labour market and tends to follow jobs; Michigan leans on prices and personal finances, so it reacts harder to an energy shock, and it is the one the Fed cites.
Fixed Income & Bond Analysis
Policy Rates
| Central Bank | Rate | Source |
|---|---|---|
| Fed Funds (upper) | 3.75% | FRED DFEDTARU (11 Sep 2026) |
| Fed Funds (lower) | 3.50% | FRED DFEDTARL (11 Sep 2026) |
| Effective FFR | 3.63% | FRED DFF (9 Sep 2026) |
| ECB Deposit Rate | 2.50% | ECB decision 10 Sep 2026 (web); FRED ECBDFR still shows 2.25% dated 11 Sep, pending the decision's effective date |
| BOJ Policy Rate | 1.00% | web search (held 31 Jul; hike to 1.25% expected 18 Sep) |
| BOE Bank Rate | ~3.73% | FRED IUDSOIA (SONIA proxy, 9 Sep 2026) |
The Fed decides on 16 September with a 25 bp hike priced at roughly 90% after this morning's CPI, up from about 70% to 74% after Thursday's PPI. The 3-month bill at 4.07% on the settled 11 September curve, up 7 bp on the day, sits 45 bp above the current 3.625% target midpoint, well outside the usual 25 bp band and consistent with a hike being priced into the bill's life. The BOJ follows on 17 to 18 September, with 97% of surveyed economists expecting 1.25% and Governor Ueda having said that a hike is on the table at every meeting. The ECB's 2.50% deposit rate was set on Thursday; FRED's daily series carries the rate in force, which is why it still prints 2.25% today. Three of the four major central banks are now either hiking or priced to hike within a week.
Government Bond Yields
| Country | 2Y Yield | 10Y Yield | 30Y Yield | Day Chg (10Y) | Source |
|---|---|---|---|---|---|
| USA | 4.63% | 4.96% | 5.35% | +1.0 bp | US Treasury par curve (11 Sep 2026) |
| Germany | 3.10% | 3.50% | 3.83% | +7.1 bp | ECB YC API AAA curve (10 Sep 2026) |
| France | — | 4.44% | — | — | web (11 Sep 2026, morning) |
| UK | — | 5.35% | 5.948% | — | web (10Y 11 Sep morning; 30Y 10 Sep) |
| Japan | — | 2.965% | 4.055% | — | web (11 Sep 2026) |
| Italy | — | 4.37% | — | — | web (11 Sep 2026, morning) |
The USA row is the settled US Treasury par curve for 11 September, with the day change against the 10 September session (10-year 4.95%); after Thursday's parallel jump the curve flattened from the front: 3-month +7 bp to 4.07%, 1-year +7 bp to 4.35%, 2-year +7 bp to 4.63%, 3-year +6 bp to 4.69%, 5-year +3 bp to 4.78%, 10-year +1 bp to 4.96%, 20-year −1 bp to 5.38% and 30-year −2 bp to 5.35%. The German row is the ECB AAA composite for 10 September, published today, with the day change against the 9 September curve (10-year 3.43%): the 2-year rose 12 bp to 3.10%, the 5-year 11 bp to 3.21%, the 10-year 7 bp to 3.50% and the 30-year 5 bp to 3.83%, so the euro curve flattened as the front end priced the ECB. Friday-morning quotes put the 10-year Bund at about 3.50%, in line with the AAA composite. The 10-year gilt was reported easing toward 5.35% on Friday after 5.378% on Thursday; the 5.948% 30-year gilt is Thursday's figure, described as the highest since 1998. The JGB 30-year at 4.055% is a Friday quote. No French, Italian or UK 2-year was retrieved.
Yield Curve Spreads: - 10Y-2Y spread: +33 bp (US Treasury par curve, 11 September), 6 bp flatter on the day as the 2-year rose 7 bp against 1 bp for the 10-year. Positive, neither flat nor steep, and down from 47 bp a month ago: the 2-year has risen 38 bp in that time against 24 bp for the 10-year, so the curve is 14 bp flatter over the month, a bear flattening, which is the shape a market takes when it is repricing the policy rate rather than the term premium. - 10Y-3M spread: +89 bp (same source and date), down 6 bp on the day and up from 83 bp a month ago. Comfortably positive; the 3-month bill has risen 18 bp in a month against 24 bp for the 10-year, and it is the bill that has furthest to go if the Fed hikes twice.
Neither spread is inverted and neither is steep. The recession signal that an inverted 10Y-3M would carry is absent; what the curve is saying instead is that the Fed's next moves are up, the belly has priced most of that, and the long end has been sold on inflation rather than on growth.
OAT-Bund Spread: roughly 94 bp on Friday-morning quotes (OAT 4.44% against Bund 3.50%), unchanged from Thursday and up from 84.7 bp a week ago. The 10-year OAT at 4.44% is at levels last seen in 2008. The BTP at 4.37% trades 7 bp inside the OAT, the France-Italy inversion that opened in August persisting.
Yield Curve Charts
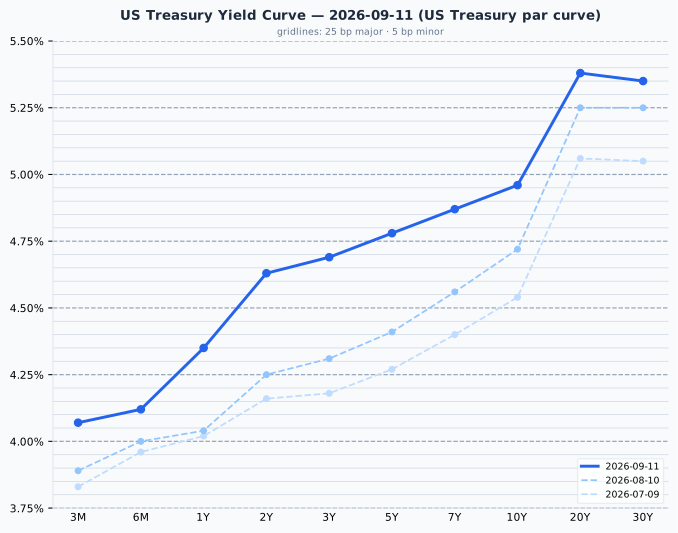
The US curve is upward sloping from the 3-month bill at 4.07% through 4.63% at two years and 4.96% at ten years, with a hump at twenty years (5.38%) above the thirty (5.35%). Against the 10 August curve the whole curve is higher, and the shift is largest in the front end and belly: +38 bp at two years, +37 bp at five years, +24 bp at ten years and only +10 bp at thirty, a bear flattening centred on the policy horizon, and Friday's session added to it from the short end.
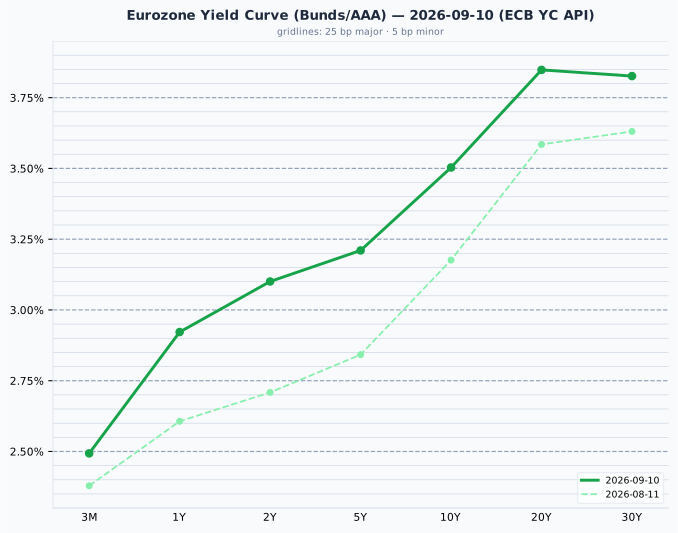
The euro AAA curve for 10 September rises from 2.49% at three months to 3.10% at two years and 3.50% at ten, and is flat to slightly inverted at the long end (3.85% at twenty years, 3.83% at thirty). Against the 10 August curve it is higher throughout and, as in the US, most so in the belly: +39 bp at two years, +37 bp at five, +33 bp at ten and +20 bp at thirty, the month in which the market went from pricing one ECB hike to pricing three.
Credit Markets (from FRED - authoritative)
| Market | OAS Spread | Series ID |
|---|---|---|
| US Investment Grade | 80 bp | BAMLC0A0CM (10 Sep 2026) |
| US High Yield | 270 bp | BAMLH0A0HYM2 (10 Sep 2026) |
| Euro High Yield | 268 bp | BAMLHE00EHYIOAS (10 Sep 2026) |
Both US spreads are historically tight: high yield at 270 bp is below the 300 to 500 bp range that counts as normal, and investment grade at 80 bp is at the floor of its 80 to 150 bp band. Euro high yield at 268 bp is in the same place. These are 10 September closes, so they include Thursday's 12 bp Treasury selloff and the $107 Brent print, and they moved by a basis point. Credit is the one market that has not repriced the summer at all: a 5.4% PPI, a 3.4% CPI, three central banks hiking and a 50 bp rise in two-year yields in a month have left high-yield compensation where it was in July. Either the corporate sector is genuinely insulated from an energy shock and higher rates, or spreads are the next thing to move.
Real Yields (US and Euro Area)
| Region | Nominal 10Y | Expected inflation | Real 10Y | How the real yield is obtained |
|---|---|---|---|---|
| United States | 4.96% (US Treasury par curve, 11 Sep) | 2.36% (residual: nominal − real) | 2.60% (US Treasury real curve, 11 Sep) | Measured. TIPS trade, so the market quotes a real yield directly; expected inflation is the breakeven residual |
| Euro area | 3.50% (ECB YC API AAA, 10 Sep) | 2.04% (ECB SPF, 2026 Q3, longer-term HICP expectation, measured) | 1.47% (residual: nominal − expected) | Constructed. No euro inflation-linked benchmark is published, so a survey expectation is subtracted from the nominal yield |
The two rows are built in opposite directions. The US real yield is a market price and its breakeven is derived; the euro figure is derived from a survey and no one trades it. Treat the euro 1.47% as the softer number. Two mismatches apply whenever the pair is compared: the US breakeven carries an inflation risk premium that a survey does not, and the SPF horizon is five years against the bond's ten. The 146 bp nominal gap between the two 10-years decomposes into 32 bp of expected-inflation difference (2.36% against 2.04%) and 113 bp of real-rate difference (2.60% against 1.47%); on Friday the US real yield rose 5 bp and the breakeven narrowed 4 bp, so the day's 1 bp move in the nominal was a real-rate move. A month ago the real component was 130 bp; the euro real yield has risen faster than the US one as the AAA 10-year climbed 33 bp on an unchanged survey expectation, so the gap is closing from the European side, and it remains mostly a real-rate story.
That gap is a description of relative policy stance and growth expectations, not an opportunity. Hedged into euros, the US yield advantage is removed by the forward points; unhedged, it is a dollar position rather than a bond decision. A 2.60% real yield is real in dollars, against US inflation, and is not a real return for someone who spends euros.
Bond Portfolio Implications
The earnings yield gap is now clearly negative in the US and clearly positive in Europe, and the direction of travel this week has been toward both extremes. S&P 500 gap: 4.04% less 4.96% = −0.92 pp. Euro gap: 5.63% less 3.50% = +2.13 pp. The measure compares the income the two instruments offer today, from quoted prices alone, and that is what it is good for: a US investor can lock a 4.96% nominal coupon for ten years or accept equity risk at a 4.04% earnings yield, and a European one chooses between 3.50% and 5.63%. It says nothing about which will do better, and no forward-return claim should be read into it.
Two biases to keep in view. The gap ignores growth: the coupon is fixed for a decade while earnings tend to grow with inflation, so the nominal gap understates equities by roughly expected inflation. The real-yield version corrects for that and is the cleaner statement: the US real gap is +1.44 pp (4.04% less 2.60%), the euro one +4.16 pp (5.63% less 1.47%), and the size of the correction, about 2.4 pp in the US, is the point of interest; it is enough to flip the US sign. Second, an equity holder does not receive the full earnings yield; only the dividend and buyback portion is paid out.
For a forward-looking view lean on the multiple against its own history, which is where the predictive power lies: the S&P 500 at 24.7x is 45% above its long-run range and the STOXX 600 at 17.8x is 11% above.
Duration: a 100 bp rise in yields costs a 10-year bond roughly 8 to 9% in price, and the last month has delivered a quarter of that at the ten-year and more than a third at the five. The front end has been the safer place to hold duration in a bear flattening, but it is also the part of the curve that has moved most in the past month, which says the market has been chasing the Fed rather than leading it. With the 2-year at 4.63% against a target range topping out at 3.75%, a single 25 bp hike next week is fully in the price; the risk for a short-duration holder is the dot plot, not the decision.
Currencies & Commodities
Currencies:
| Pair | Rate | Source |
|---|---|---|
| EUR/USD | 1.1618 | FRED DEXUSEU (4 Sep 2026) |
| USD Index | 118.07 | FRED DTWEXBGS (4 Sep 2026) |
| USD/JPY | 154.17 | web search (11 Sep 2026) |
| GBP/USD | 1.3505 | web search (11 Sep 2026) |
| USD/CHF | 0.8044 | web search (11 Sep 2026) |
The two FRED series are a week stale and have not been updated since the 4 September observation. A live EUR/USD quote of 1.1651 today (web) is about 0.3% above the FRED figure, so the ECB hike and a 3.50% Bund have given the euro a little ground against a dollar that has a 4.95% 10-year and a Fed hike behind it. The yen at 154.17 was 0.16% firmer on the session and is more than 3% stronger on the month on the BOJ trade; yesterday's briefing quoted 153.38 from a different morning source, so the two figures should not be read as a one-day move. Sterling at 1.3505 was slightly softer despite the GDP beat; the franc at 0.8044 firmed.
Commodities (all front-month futures):
| Commodity | Price | Day Chg % | Ticker | Source |
|---|---|---|---|---|
| Brent Crude | 104.61 | -2.81% | BZ=F | yfinance |
| WTI Crude | 100.05 | -2.37% | CL=F | yfinance |
| Gold ($/oz) | 4,408.90 | +0.04% | GC=F | yfinance |
| Silver ($/oz) | 65.19 | +0.40% | SI=F | yfinance |
| Copper ($/lb) | 6.548 | +0.01% | HG=F | yfinance |
| Nat Gas ($/MMBtu) | 2.831 | -0.11% | NG=F | yfinance |
Prices are the 11 September settlements and day changes are settlement vs the prior session's settlement (10 September). Contract months are October for WTI (CLV26, expiring 22 September) and natural gas (NGV26, expiring 28 September), November for Brent (BZX26, expiring 1 October) and December for the metals (GCZ26, SIZ26, HGZ26). Yahoo's expireDate for WTI agrees with the October symbol, so the 22 September expiry is real: the generic will roll to November within two weeks, and the quoted level will jump by the calendar spread when it does. The same applies to natural gas six days later.
Crude gave back two and a half to three dollars on the report that Tehran will sit down with the Gulf states in Oman, and the market's reading is the right one for now: a meeting to discuss a temporary arrangement for Hormuz transit is the first diplomatic step in six months, and it is worth a retracement, not a reversal. Brent settled at $104.61, 17.0% below its 52-week high of $126.10 and 78% above its 52-week low of $58.72; WTI settled at $100.05, 16.3% below its 52-week high of $119.48, having traded under $100 during the session before the settlement was struck just above it. Both contracts' records date from July 2008 and describe a different market. On the week Brent is still up about 8%, Saudi output is still 6.24 mn b/d, and nothing in today's move changes the supply arithmetic that turned last week's risk premium into this week's shortage pricing; it changes the probability that the shortage is managed. The EIA and OPEC monthly reports and the Salalah meeting itself will decide whether Monday opens lower or higher.
Copper settled flat at $6.548/lb, 3.8% below its all-time high of $6.8055 set on 9 September, holding Thursday's 5% loss without extending it. The White House copper-tariff report that caused the drop has had neither a confirmation nor a denial, so the metal is sitting at the post-unwind level waiting for one; the 15% tariff due 1 January is the variable.
Gold settled at $4,408.90, 21.1% below its all-time high of $5,586.20 (29 January 2026), up 0.04% on the day. Silver settled at $65.19, 46.3% below its all-time high of $121.30 from the same date, up 0.40%. Both records are inside the last twelve months and coincide with their 52-week highs, so these are drawdowns from a recent peak, and they are not being bought. A day with a near-three percent fall in oil, a diplomatic opening in the Gulf and a 10-year real yield that rose 5 bp to 2.60% gave gold no reason to move in either direction, and it did not. The metal's problem all week has been the real yield, not the news.
Natural gas settled at $2.831, down 0.11%, near the floor of its $2.483 to $7.827 52-week range and insulated from the Gulf, as it has been all week.
Crypto: no notable moves retrieved.
Sector & Theme Highlights
Best performing: the US rally was broad, led by the sectors that had been sold hardest in the four-day slide, and its headline name did not hold. Oracle opened up 7.5% at $164.43 and printed $166.00 after fiscal first-quarter revenue of $19.35bn (+30%, against $19.14bn expected), adjusted EPS of $1.92 against $1.75, cloud infrastructure revenue up 121% and a remaining performance obligation of $664bn against $640bn expected, with management saying AI training and inference demand continues to outrun supply; it then sold off through the session on the 61% gross margin, the five-cent guidance raise and the $90bn to $95bn capex plan, and closed down 1.74% at $150.28 on 79.5m shares, two and a half times its three-month average. CoreWeave and Nebius, up about 4% in sympathy in the morning, went the same way. Adobe, which had reported after Thursday's close alongside Oracle (see Top Stories), opened 2.7% lower and closed up 1.37% at $252.23, the reverse of Oracle's shape. In Europe the rally was led by banks (Santander +1.3%, BBVA +1%), which benefit from the steeper front end the ECB has delivered, and by aerospace and industrials (Safran +2%, Airbus +1.6%, Siemens +1.1%). The FTSE 100 was helped by the GDP surprise.
Worst performing: Asian semiconductors. Samsung Electronics, SK Hynix and Kioxia fell on the combination of $100 oil, Treasury yields at three-year highs and Fed hike odds, taking the Kospi down 1.76% and contributing to the Nikkei's 1.93% loss; a week that began with the Kospi up 4.6% in a day is ending with the chip trade being sold for macro reasons rather than for anything in the order books. SAP fell 1.6% in Europe. Brazilian equities were the day's other loser, the Bovespa closing down 0.56% as crude gave back its Thursday gain.
Themes. The Fed's decision is no longer the question; the dot plot is. With CPI matching consensus and hike odds at 90%, the market's attention has moved to whether Wednesday's projections show one hike or a path, and the Michigan five-year expectation at 3.4% is the number that makes a path more likely. Second, the first diplomatic opening in the Gulf since the war began has arrived in the same week the market decided the oil problem was physical rather than psychological; the two will be tested against each other on Monday in Salalah. Third, the bear flattening is global: the belly of the curve has risen 30 to 40 bp in a month in both the US and the euro area, credit has not moved, and the equity market has responded by rotating within itself (energy and banks up, chips and consumer down) rather than by de-rating. Oracle's close is the first sign of what de-rating looks like when it arrives one name at a time: a beat-and-raise sold for its margin. Something has to give, and the most likely candidate remains the multiple on 24.7x.
Top Stories (Global)
- US CPI rose 0.4% in August and 3.4% on the year, matching consensus; core CPI 0.3% on the month against 0.2% expected, 2.4% on the year. FRED puts the annual rates at 3.35% and 2.45%. CME FedWatch odds of a 25 bp hike on 16 September rose to roughly 90% from about 70% before the data. The 10-year settled at 4.96%, +1 bp, a new high since October 2023, while the 2-year rose 7 bp to 4.63% and the 30-year fell 2 bp to 5.35% (US Treasury par curve, 11 September).
- Oil fell after Iranian state media said Tehran will meet Gulf states in Oman on the Strait of Hormuz. Oman is aiming to gather GCC and Iranian foreign ministers in Salalah on Monday, the first such meeting since the war began, to discuss a temporary arrangement for commercial shipping through a strait that handled about 20% of global oil supply before the conflict. Brent settled at $104.61, -2.81%, and WTI at $100.05, -2.37%, after trading under $100 intraday; Brent remains up about 8% on the week.
- Oracle closed down 1.74% at $150.28 after opening up 7.5% on a first-quarter beat: revenue $19.35bn (+30%), adjusted EPS $1.92 against $1.75 expected, cloud infrastructure revenue +121% to $7.4bn, and a $664bn backlog after more than $30bn of new AI cloud contracts in the quarter, against $640bn expected. The reversal traced to gross margin at 61% (68.7% a year ago), fiscal 2027 EPS guidance raised only to $8.10 from $8.05, and a $90bn to $95bn capex plan after $28.5bn in the quarter left free cash flow at minus $5.4bn. CoreWeave and Nebius, up about 4% in the morning, gave it back too.
- Adobe reported fiscal third-quarter results after Thursday's close: revenue $6.76bn, up 13%, and non-GAAP EPS $6.13, up 15%, both ahead of expectations; full-year revenue guidance raised to $26.58bn to $26.63bn and EPS to $24.45 to $24.50; AI-first annualised recurring revenue above $650m, up more than 150%. Shantanu Narayen will step down as chief executive, with Anil Chakravarthy, president of customer experience orchestration, taking over on 1 December. The shares fell about 2% after hours, opened Friday 2.7% lower and closed up 1.37% at $252.23.
- University of Michigan sentiment fell to 47.8 in the preliminary September survey, the second-lowest reading on record, from 51.7 in August and against 51.0 expected. One-year inflation expectations jumped to 4.6% from 4.0%, the highest since June, and five-year expectations to 3.4% from 3.3%; the expectations index fell to 45.8 from 51.5.
- The S&P 500 closed up 0.86% at 7,656.98, ending a four-session losing streak, with the Nasdaq 100 up 0.91% and the Dow up 0.98%, all three off their midday highs; European indices closed higher, the STOXX 600 up 0.49% and the DAX up 0.82%, led by banks and aerospace.
- Asia sold off before the CPI and the Oman news: the Nikkei fell 1.93%, the Kospi 1.76% and Shanghai 1.18%, with Samsung, SK Hynix and Kioxia lower on oil, yields and Fed hike odds. The JGB 10-year rose to 2.965% and the 30-year to 4.055% ahead of a BOJ meeting at which 97% of economists expect a hike to 1.25%.
- The euro AAA 10-year rose to 3.50% on the 10 September curve, its 2-year to 3.10%, the second day of repricing after the ECB's hike; the OAT at 4.44% is a 94 bp spread over the Bund and the BTP at 4.37% trades inside France. The 10-year gilt eased toward 5.35% after 5.378% on Thursday, its highest since 2007; the 30-year gilt's 5.948% is the highest since 1998.
- UK GDP grew 0.4% in July against a flat consensus, the eighth consecutive positive three-month period, with services up 0.6% on professional services and computer programming while production and construction each fell 0.5%.
Looking Ahead
Central banks - Wednesday 16 September: FOMC. A 25 bp hike to 3.75% to 4.00% is priced at roughly 90%. With CPI in line, the decision is close to settled and the market's focus is the dot plot and the press conference: whether the committee frames this as a single insurance move against an energy shock or the start of a path, and how it reconciles hiking with unemployment at 4.1%, payrolls at +162k and consumer sentiment at 47.8. - Thursday 17 to Friday 18 September: BOJ. A hike to 1.25% is expected by 97% of surveyed economists; Governor Ueda has said a move is on the table at every meeting. The yen has firmed more than 3% in a month on it and the JGB 30-year is above 4%. - ECB: no meeting until October. Speakers will be watched for whether "no debate on the path" was a shrug or a signal; the AAA 2-year at 3.10% says the market has decided it was a signal.
Economic releases - Monday 14 September: the GCC-Iran meeting in Salalah, if it happens, is the release that matters for oil. China's August activity data (industrial production, retail sales, fixed-asset investment) is also due in the Asian session. - Tuesday 15 September: US retail sales for August, the first hard read on the consumer after the Michigan survey; US industrial production; the German ZEW survey. - Wednesday 16 September: euro area final HICP for August (flash 3.3%), UK CPI for August, US housing starts, and the FOMC. - Thursday 17 September: US initial jobless claims and the Philadelphia Fed survey; BOJ decision overnight into Friday.
Earnings - Oracle and Adobe have both reported (see Top Stories). Between them they gave the two answers the market is weighing: Adobe showed AI revenue at a rising margin and was bought after an initial dip; Oracle showed AI backlog at a falling margin and was sold after an initial surge.
Geopolitical - The Salalah meeting is the pivot: a temporary arrangement for Hormuz transit would take the supply-loss pricing out of crude, and a failure would put Thursday's $107 back in play. The Houthi front against Saudi infrastructure and Saudi output at a 36-year low remain the second-order risks. - The White House copper-tariff decision is unresolved; copper is holding the post-report level at $6.55. - French fiscal risk at a 94 bp OAT-Bund spread and the UK gilt market at 2007 ten-year yields and 1998 thirty-year yields remain the European sovereign stories.
Market closures (Nager.Date API, fetched 2026-05-25) - No closures in the next five trading days across the US, UK, Germany, France, Japan, Australia, Switzerland, Canada, Korea or Brazil. - Further out: Japan 21 September (Respect for the Aged Day) and 23 September (Autumnal Equinox Day), the first falling three days after the BOJ decision; Korea 24 to 26 September (Chuseok); Canada 30 September (National Day for Truth and Reconciliation). - The holiday cache holds no data for India, so Indian closures cannot be checked from it.
Special Analysis: Oracle's $664bn Backlog and What It Is Not
Oracle's $664bn remaining performance obligation is the number that put the AI trade back on the front foot today, but it is a sum of multi-year promises from a handful of loss-making AI labs, not revenue, and converting it requires $90bn to $95bn of capex this year at a gross margin that has already fallen from 68.7% to 61%. The market worked that out during the session: the shares gave back the whole of the morning's 8% gain and closed down 1.74%.
What the number is
Remaining performance obligation (RPO) is the total value of signed contracts for which revenue has not yet been recognised. It is not revenue, not cash and not a forecast. It is a count of what customers have committed to buy over the life of their agreements, and most of it sits well beyond the next twelve months. Oracle recognises it only as it delivers the compute, quarter by quarter, for as long as the contracts run.
Scale against the business that has to deliver it
Oracle's quarterly revenue is $19.35bn, roughly $77bn a year, so the backlog is about eight and a half years of the whole company's current sales. The cloud infrastructure segment, where the backlog actually lives, ran at $7.4bn in the quarter, about $30bn annualised; against that base the $664bn is more than twenty years of current output. At the $150.28 close Oracle's market capitalisation is about $433bn, so the backlog is larger than the company. Numbers that large relative to the business tell you two things: the contracts are long-dated and back-loaded, and the near-term earnings contribution is a small fraction of the headline.
Three things the headline hides
Concentration and counterparty risk. The bulk of the backlog is a small number of AI-lab contracts, dominated by the OpenAI commitment reported last year at around $300bn over five years, with deals of the same type from other model builders. Those customers do not fund themselves from operations; they pay Oracle out of capital they raise. The backlog is therefore largely a claim on the future fundraising ability of a few private companies, not on the cash flows of a diversified enterprise base. A change in the funding climate for AI labs would flow straight through to the number.
It has to be built before it can be billed. Revenue is recognised only as compute is delivered, which means data centres, GPUs and power have to be in place first. That is capex Oracle is financing with debt: total debt stands at about $167bn and trailing free cash flow is around minus $24.5bn. With the 10-year at 4.95% and a Fed hike priced for next week, the cost of carrying that build is rising, and the briefing's point about rate sensitivity applies more sharply to Oracle than to the index. June's briefing recorded a 12% drop on exactly this concern, heavy debt-financed expansion against flat sales, and the stock is 54% below its 52-week high of $329.50. The hardware also depreciates over a few years, so a contract that stretches beyond five is being served with GPUs that may need replacing before it ends.
The beat was against a guess, and the useful numbers are elsewhere. "$664bn against $640bn expected" is a beat against sell-side estimates of a figure that moves by tens of billions on a single signature. The disclosures that matter are the more than $30bn of new AI contracts booked in the quarter, which is the run-rate of new demand, and management's statement that nearly half the backlog converts within 36 months. That second figure is the one to sit with: roughly $330bn over three years is about $110bn a year of infrastructure revenue against a segment currently running at $30bn, which is why the capex plan is the size it is.
Why the stock gave the gain back
The shares opened at $164.43, printed $166.00 in the first hour and closed at $150.28, down 1.74% on the day, on 79.5m shares, two and a half times the three-month average. The reversal traced to the parts of the release the backlog headline crowded out. Gross margin fell to 61% against roughly 62% expected and 68.7% a year earlier, which management attributed to the cost of ramping data centres: the 121% growth is arriving at a lower margin than the business it is diluting. Fiscal 2027 adjusted EPS guidance was raised to $8.10 from $8.05, five cents on a quarter that added more than $30bn of contracts. And the quarter's capex was $28.5bn, leaving free cash flow at minus $5.4bn, with the full-year plan of $90bn to $95bn exceeding the company's entire annual revenue. Morgan Stanley's note asked for "more evidence of progress towards gross margin stabilization", and that is the market's question in one line: the backlog is real, but the margin on it is falling and the cash to build it is leaving faster than the earnings are arriving. The stock is down roughly 23% this year and 54% from its 52-week high.
The margin, line by line
Oracle does not report a gross profit line; the gross margin everyone quotes is revenue less the three delivery cost lines (cloud and software, hardware, services), and the 61% and 68.7% are the non-GAAP version, which also adds back the stock-based compensation booked in those lines. The earnings release makes the comparison explicit, in $bn:
| Line | Q1 FY26 (Aug 2025) | Q1 FY27 (Aug 2026) | Change |
|---|---|---|---|
| Total revenue | 14.93 | 19.35 | +30% |
| Cloud and software expenses | 3.61 | 6.40 | +77% |
| Hardware expenses | 0.18 | 0.28 | +58% |
| Services expenses | 1.10 | 1.05 | −4% |
| Cost of revenue | 4.88 | 7.73 | +58% |
| Gross profit (GAAP) | 10.04 (67.3%) | 11.61 (60.0%) | |
| Gross margin, non-GAAP | 68.7% | 61.0% | |
| Sales and marketing | 2.06 | 1.81 | −12% |
| Research and development | 2.49 | 2.40 | −4% |
| General and administrative | 0.38 | 0.38 | 0% |
| Amortisation of intangibles | 0.42 | 0.20 | −52% |
| Restructuring and other | 0.42 | 0.09 | −77% |
| Operating income | 4.28 (28.7%) | 6.73 (34.8%) | +57% |
Two things the table settles. The whole of the seven-point compression sits in one line: cloud and software delivery costs, which are the data centres' power, staff and depreciation, rose 77% against revenue growth of 30%. Nothing below gross profit contributed; sales and marketing, R&D, amortisation and restructuring were cut by $1.2bn combined, which is why operating margin went the other way, up six points to 35%. The market chose to price the gross-margin line rather than the operating-margin line, because the cost cuts are finite and the delivery costs scale with the backlog.
What it means for the index
The market's first reading was "AI demand still outruns supply", and for the first hour that was the story lifting the S&P 500 out of its four-session slide. By the close the index had kept its 0.86% gain and Oracle had lost 1.74%, which relocates the day's bounce to oil and CPI and leaves the AI complex without the confirmation the morning seemed to give it. The more sober reading is that a 24.7x index is leaning on a backlog that is overwhelmingly contingent on AI labs continuing to raise money and on Oracle continuing to borrow at rising rates to build the capacity, at a margin that is compressing as it scales. The 121% cloud infrastructure growth is real and current; the $664bn is a duration bet on all three of those things holding for years. That is why it belongs under concentration risk rather than under valuation support, and Oracle's own round trip, from up 8% to down 1.74% at the close, is the case study.