2026 08 24
Global Financial Briefing — Monday, 24 August 2026
Americas index levels, commodities and day changes reflect the 24 August closing print, and the US Treasury row the settled 24 August curve. Euro area fixed income, FX and macro figures are dated inline.
Market Overview
A risk-off Monday concentrated almost entirely in technology, with the rest of the world holding up rather better than the headline indices suggest. The damage began in Seoul, where the Kospi closed down 3.12% at 6,696.96 after Samsung Electronics fell 8.35% — the company unveiled a ₩110trn shareholder-return plan, the largest in Korean corporate history, and the market judged it insufficient against expectations that had run further still. Foreign investors net-sold ₩3.69trn and institutions ₩1.29trn; notably the KOSDAQ rose on the same day, so this was a large-cap semiconductor repricing rather than a broad Korean exit. That impulse carried into the Nikkei (−0.74%) and then into US tech: the Nasdaq 100 closed down 0.97% while the Dow closed up 0.26% — the divergence widened on both sides into the close.
The day's other event was geopolitical, and the market reaction was the opposite of the obvious one. The US rolled out "Operation Economic Outcast", a sanctions campaign against Iran that Treasury Secretary Scott Bessent had trailed as an "economic D-Day", with Washington signalling that China would not be exempt. Oil fell on the announcement — WTI settled −2.35% at $85.01, Brent −2.35% at $92.17 — after both contracts had gained more than 5% over the previous two weeks on the Strait of Hormuz disruption. The read is a sell-the-news unwind: the escalation risk was already in the price, and the published detail did not exceed what the run-up had discounted. Failed US–Canada trade talks and renewed reciprocal-tariff threats sat alongside it as a second risk headline.
Fixed income went the other way, and gently. After Friday's selloff left the settled 30-year par yield at 5.27% and the 10-year at 4.74%, the long end was bid back: the settled 10-year came in at 4.70%, −4.0 bp, and the 30-year at 5.23%, −4.0 bp, with the 2-year unchanged at 4.24% (US Treasury par curve, 24 August). That is a modest bull-flattening — 10Y−2Y narrowed from 50 to 46 bp — against a settled curve that had steepened five basis points at the 10-year point on Friday. The dollar remains pinned near multi-month lows on sovereign debt concerns, with EUR/USD around 1.1682 — the same fiscal anxiety that keeps the 30-year above 5.20% is showing up in the currency, which is the more telling of the two signals. Europe closed essentially flat (STOXX 600 unchanged, DAX −0.11%, CAC 40 −0.37%, FTSE 100 +0.35%), untroubled by the tech move.
Global Indices Snapshot
Americas
| Index | Level | Day Chg | Day Chg % | Source |
|---|---|---|---|---|
| S&P 500 | 7,652.86 | −21.51 | −0.28% | yfinance ^GSPC |
| Nasdaq 100 | 29,023.18 | −285.72 | −0.97% | yfinance ^NDX |
| Dow Jones | 53,417.16 | +140.16 | +0.26% | yfinance ^DJI |
| Brazil IBOV | 171,906.72 | +874.98 | +0.51% | yfinance ^BVSP |
Americas data reflects the 24 Aug close.
Cross-check: FRED SP500 for 2026-08-24 publishes the S&P 500 close at 7,652.86, matching the
yfinance ^GSPC close to the cent.
Europe
| Index | Level | Day Chg | Day Chg % | Source |
|---|---|---|---|---|
| Euro STOXX 600 | 654.21 | +0.03 | +0.00% | yfinance ^STOXX |
| Euro STOXX 50 | 6,447.98 | −14.24 | −0.22% | yfinance ^STOXX50E |
| CAC 40 | 8,453.01 | −31.42 | −0.37% | yfinance ^FCHI |
| DAX | 26,106.60 | −29.96 | −0.11% | yfinance ^GDAXI |
| FTSE 100 | 10,854.32 | +37.76 | +0.35% | yfinance ^FTSE |
| SMI (Swiss) | 14,447.19 | −9.79 | −0.07% | yfinance ^SSMI |
European data reflects today's close (24 Aug).
Asia-Pacific
| Index | Level | Day Chg | Day Chg % | Source |
|---|---|---|---|---|
| Nikkei 225 | 65,528.09 | −488.27 | −0.74% | yfinance ^N225 |
| Hang Seng | 25,517.33 | −492.13 | −1.89% | yfinance ^HSI |
| Shanghai Comp | 3,882.01 | −23.19 | −0.59% | yfinance 000001.SS |
| ASX 200 | 9,103.10 | +44.20 | +0.49% | yfinance ^AXJO |
| Kospi (Korea) | 6,696.96 | −215.99 | −3.12% | yfinance ^KS11 |
Asia-Pacific data reflects today's close (24 Aug).
The Kospi figure is large enough to warrant a check, and it survives one: the prior close of 6,912.95 (21 Aug) gives exactly −215.99 points and −3.12%, and Korean press confirms a close of 6,696.96. It is a real move, not a bad field. Yahoo reports a 52-week low of 0.0 for ^KS11, which is plainly a data error, so no 52-week range is quoted for that index below.
Emerging Markets
| Index | Level | Day Chg % | Source |
|---|---|---|---|
| MSCI EM (EEM) | 66.11 | −1.50% | yfinance EEM |
| India Nifty 50 | 24,219.05 | −0.14% | yfinance ^NSEI |
| South Africa | 71.33 | −1.63% | yfinance EZA |
EEM and EZA are US-listed ETFs and now reflect the 24 Aug NYSE close; the Nifty figure is the 24 Aug Indian close.
Index Valuations & Investment Risk
Valuation Table
| Index | Trailing P/E (live) | Hist avg trailing P/E (†) | Premium to hist avg |
|---|---|---|---|
| S&P 500 | 25.72x | ~16-18x | +51.3% |
| Nasdaq 100 | 30.26x | ~25-30x | +10.0% |
| Euro STOXX 600 | 18.04x | ~15-17x | +12.8% |
| CAC 40 | 17.33x | ~14-16x | +15.6% |
| DAX | 18.90x | ~15-17x | +18.1% |
| FTSE 100 | 18.23x | ~13-15x | +30.2% |
| Nikkei 225 | 22.06x | ~20-22x | +5.1% |
| MSCI EM | 17.15x | ~13-15x | +22.5% |
(†) Static long-run reference constants. Live trailing P/E from yfinance
trailingPE on ETF proxies (SPY, QQQ, EXSA.DE, CAC.PA, EXS1.DE, ISF.L, 1321.T, EEM). Premium
computed against the midpoint of each historical range; bold marks >20% above.
The striking feature is that the S&P 500's premium (+51.3%) is now five times the Nasdaq 100's (+10.0%). That is not because large-cap tech is cheap — QQQ at 30.26x is at the very top of its own historical band — but because the Nasdaq's historical benchmark is itself a high-multiple range, while the S&P's is not. The broad US index has migrated toward the growth index's valuation without inheriting its reference point.
Investment Risk Assessment for ETF Investors
United States (S&P 500 / Nasdaq ETFs). SPY's 25.72x trailing earnings puts the S&P 500 more than 40% above its long-run average — historically stretched by the threshold used here. The earnings yield is 3.89% (1÷25.72) against a 10-year Treasury at 4.70% (US Treasury par curve, 2026-08-24), an earnings yield gap of −0.81 pp: on today's prices a Treasury pays more current yield than the index's earnings, before any growth. The index sits 2.10% below its 52-week high and above both its 50- and 200-day moving averages, so the price action is not confirming the valuation concern. The Nasdaq 100 is the softer of the two technically — 5.65% below its 52-week high and closed below its 50-day average (29,023.18 vs 29,324.90), a break in the tech leadership that has driven this market. Concentration risk in the AI complex is the obvious transmission channel, and today's Samsung reaction is a reminder that the semiconductor trade now reprices on capital-return disappointments as readily as on demand news. Rate sensitivity is material at these multiples: the real 10-year yield is 2.38% (US Treasury real curve, 2026-08-24), and a valuation resting on a 3.89% earnings yield has very little cushion against a further rise in the discount rate.
Europe (STOXX 600 / CAC 40 / DAX ETFs). European multiples are elevated in absolute terms but far less so relative to their own history: STOXX 600 at 18.04x (+12.8%), CAC 40 at 17.33x (+15.6%), DAX at 18.90x (+18.1%) — none crosses the 20% flag. The US trades at a 43% premium to the STOXX 600 on trailing earnings. The euro earnings yield gap is +2.29 pp (5.54% earnings yield less a 3.25% Bund) versus −0.81 pp in the US, a 3.1 pp difference in current income terms. Part of that difference is simply the gap between US and euro-area inflation and policy paths rather than a difference in risk compensation — see the real-yield decomposition below, which finds it is mostly not an inflation story. On the real basis the euro gap is +4.31 pp against +1.51 pp for the US, so Europe's relative advantage survives the correction and in fact widens. Fundamentals are cooperating: eurozone flash manufacturing PMI hit 52.8 in August, the fastest in four years, and German manufacturing 54.1, strongest since May 2022 — though German services fell to 48.5, a five-month run of contraction, which is the part of the German economy that actually employs most people. Geopolitical risks centre on French fiscal dynamics (OAT-Bund at 83.6 bp) and on tariff escalation now that US–Canada talks have failed.
A note on currency for a euro-based holder: EUR-quoted European funds carry no FX effect on the quoted value of the holding, but real currency exposure remains inside the earnings — CAC 40 and STOXX 600 constituents are multinationals earning substantially abroad. The exposure is smaller, slower and partly hedged by foreign cost bases; it is not absent.
Japan (Nikkei / TOPIX ETFs). At 22.06x the Nikkei is the closest of the major indices to its own historical average (+5.1%), and the index is 10.03% below its 52-week high and below its 50-day average. The BOJ held at 1.00% on 31 July on an 8-1 vote, with Takata dissenting for 1.25%, and guided that core inflation will run "clearly above" 2% from the second half of the fiscal year — citing wage pass-through, crude, and yen weakness. With USD/JPY at 159.08 the policy risk is asymmetric toward tightening, which is a headwind for the index and a tailwind for an unhedged euro or dollar holder. Corporate governance reform remains the structural support, and today's Samsung episode is a useful counter-example of how unforgiving markets have become about capital-return credibility across the region.
Emerging Markets (MSCI EM ETFs). EEM at 17.15x is 22.5% above its historical average, so the traditional "EM trades at a discount to developed markets" framing no longer holds against its own history — it holds only against the US. EEM is 7.63% below its 52-week high and closed almost exactly on its 50-day average (66.11 against 66.06), having been fractionally below mid-afternoon. China weight is the dominant risk: the Hang Seng is 9.05% below its 52-week high and below its 200-day average, and Shanghai is 8.85% below its 52-week high and below both averages. The extension of Iran sanctions explicitly to Chinese counterparties adds a new, concrete channel from the geopolitical story into EM equity.
Overall Risk Score: High valuation risk / low margin of safety in the US; moderate — fair value with mixed signals — in Europe and Japan. The US index offers less current income than a Treasury while sitting at a 51% premium to its historical multiple; Europe offers a positive gap on both nominal and real bases at a materially smaller premium.
Disclaimer: This is financial information, not personalised investment advice. Past valuations do not guarantee future returns. Consult a financial advisor before investing.
US Economic Indicators (FRED — authoritative)
| Indicator | Current | Prior | Delta | Reference Date | FRED Series |
|---|---|---|---|---|---|
| CPI YoY % | 3.30% | — | — | Jul 2026 | CPIAUCSL |
| Core CPI YoY % | 2.47% | — | — | Jul 2026 | CPILFESL |
| Unemployment Rate | 4.1% | — | — | Jul 2026 | UNRATE |
| Nonfarm Payrolls | 158,858k | 158,881k | −23k | Jul 2026 | PAYEMS |
| 10Y TIPS Real Yield | 2.38% | — | — | 2026-08-24 | DFII10 (US Treasury real curve) |
Note: FRED macro data is monthly and lags 4–6 weeks; July is the latest reference month. The payrolls print is the one to watch — a −23k monthly change is an outright contraction in employment, sitting alongside headline CPI at 3.30% against core at 2.47%. That combination (sticky headline inflation, softening labour demand) is precisely the one that makes the Fed's next move hard to read, and it is why the front end is not pricing much: the 3-month par yield of 3.87% sits 24.5 bp above the Fed funds target midpoint of 3.625%, i.e. the bill market is not discounting a near-term cut.
Other economic releases today. Germany's detailed Q2 2026 national accounts (Destatis) confirmed GDP at +0.2% q/q and +0.9% y/y, in line with the flash estimate — exports rose, capital formation fell, and final consumption was subdued. The composition is weaker than the headline: growth is coming from external demand while domestic investment contracts. There were no first-tier US releases today; the German Ifo index and US new home sales both land tomorrow.
Fixed Income & Bond Analysis
Policy Rates
| Central Bank | Rate | Source |
|---|---|---|
| Fed Funds (upper) | 3.75% | FRED DFEDTARU (2026-08-24) |
| Fed Funds (lower) | 3.50% | FRED DFEDTARL (2026-08-24) |
| Effective FFR | 3.63% | FRED DFF (2026-08-20) |
| ECB Deposit Rate | 2.25% | FRED ECBDFR (2026-08-24) |
| BOJ Policy Rate | 1.00% | web search (held 2026-07-31, 8-1 vote) |
| BOE Bank Rate | ~3.73% | FRED IUDSOIA (SONIA proxy, 2026-08-20) |
Government Bond Yields
| Country | 2Y Yield | 10Y Yield | 30Y Yield | Day Chg (10Y) | Source |
|---|---|---|---|---|---|
| USA | 4.24% | 4.70% | 5.23% | −4.0 bp | US Treasury par curve (2026-08-24) |
| Euro AAA | 2.76% | 3.27% | 3.72% | — | ECB YC API (2026-08-21) |
| Germany | (not retrieved) | ~3.25% | (not retrieved) | — | web (2026-08-21 ref) |
| France | (not retrieved) | 4.08% | (not retrieved) | — | web (2026-08-21 ref) |
| UK | (not retrieved) | (not retrieved) | (not retrieved) | — | — |
| Japan | (not retrieved) | 2.88% | (not retrieved) | — | web |
| Italy | (not retrieved) | (not retrieved) | (not retrieved) | — | — |
The USA row is settled data for 24 August throughout, with the day change measured against the 21 August par curve (10Y 4.74% → 4.70%). The "Euro AAA" row is the ECB's AAA-rated euro area composite curve — the term structure used for the chart and the real-yield work below; the Germany row is the Bund specifically. UK gilt and Italian BTP levels could not be retrieved for today and are left blank rather than estimated or carried forward.
Yield Curve Spreads (US Treasury par curve, 2026-08-24):
- 10Y−2Y: +46 bps — positively sloped and normal, though not steep (a steep curve on the historical convention used here would be above roughly +75 bps). The curve has re-steepened from inversion but has stalled short of a conventionally steep shape.
- 10Y−3M: +83 bps — comfortably positive. No recession signal from the measure that carries the better historical record of the two.
Read together, these say the market expects policy to be modestly easier over the medium term but is not pricing an imminent cut, which squares with the 3-month bill sitting above the funds midpoint.
OAT-Bund Spread: 83.6 bps (10Y OAT 4.08% vs Bund ~3.25%, web, 21 August reference), up 0.4 bp on the session quoted. This remains the cleanest market read on French fiscal risk, and at 83.6 bp it is elevated but orderly — not a stress level.
Yield Curve Charts
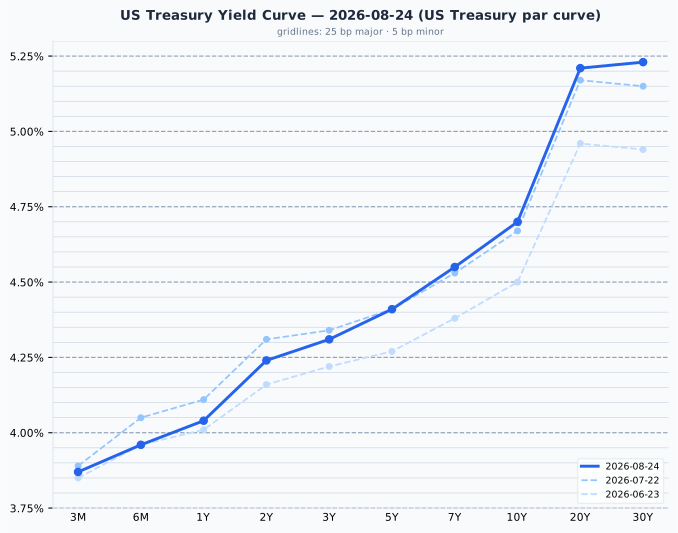
The US curve is upward-sloping throughout with a pronounced kink beyond ten years: 51 bp separates the 10Y from the 20Y, against just 2 bp from the 20Y to the 30Y. Since the 24 July curve the long end has shifted up — 10Y +3 bp, 20Y +4 bp, 30Y +8 bp — while the front end is lower (3M −2 bp, 6M −9 bp, 1Y −7 bp, 2Y −7 bp), a bear-steepening driven by term premium rather than policy expectations, and a milder one than Friday's curve had shown.
Sanity check: the 3M par yield of 3.87% sits 24.5 bp above the Fed funds target midpoint of 3.625% — just inside the usual tolerance, and consistent with a bill market pricing no near-term cut rather than with a data problem.
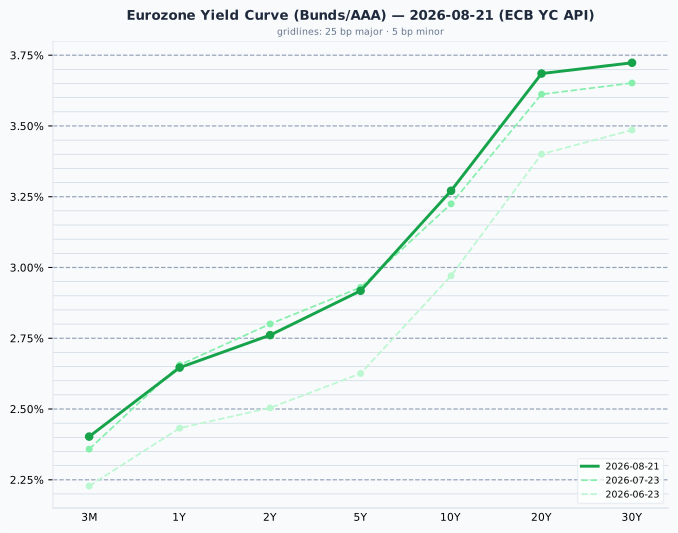
The euro AAA curve is likewise upward-sloping and considerably steeper in relative terms: 132 bp from 3M to 10Y, and a further 45 bp out to 30Y. Against the 23 July curve the move is a parallel lift at the long end (10Y +5 bp, 20Y +7 bp, 30Y +7 bp) with the 2Y point 4 bp lower — the same bear-steepening as the US, in smaller magnitude, and against the 23 June curve the 10Y is 30 bp higher.
Credit Markets (FRED — authoritative, 2026-08-21)
| Market | OAS Spread | Series ID |
|---|---|---|
| US Investment Grade | 81 bps | BAMLC0A0CM |
| US High Yield | 270 bps | BAMLH0A0HYM2 |
| Euro High Yield | 256 bps | BAMLHE00EHYIOAS |
US HY at 270 bp is historically tight — below the 300–500 bp normal range entirely — and Euro HY at 256 bp is tighter still. US IG at 81 bp sits at the very bottom of its 80–150 bp normal band: strictly within range, but at the tight edge of it. Credit is pricing close to no default risk at all. That is a complacency signal rather than a stress one, and it sits oddly beside the day's geopolitical headlines and an outright contraction in US payrolls — spreads this tight offer almost no compensation for the possibility that either matters. Equity volatility agrees: the VIX closed at 15.13 on 21 August (FRED VIXCLS), moderate and at the low end of that band. For a bond investor the practical conclusion is that credit is not where the value is: the extra yield over Treasuries does not pay for the risk taken.
Real Yields (US and Euro Area)
| Region | Nominal 10Y | Expected inflation | Real 10Y | How the real yield is obtained |
|---|---|---|---|---|
| United States | 4.70% | 2.32% (residual) | 2.38% | Measured. TIPS trade, so the market quotes a real yield directly; expected inflation is the residual (the breakeven) |
| Euro area | 3.27% | 2.04% (measured) | 1.23% | Constructed. No euro inflation-linked benchmark is published, so a survey expectation is subtracted from the nominal yield |
US figures: US Treasury par curve and US Treasury real curve, 2026-08-24. Euro figures: ECB YC API (2026-08-21) and ECB SPF long-term HICP expectation, 2026-Q3 (2.037%).
The two rows are built in opposite directions. In the US the real yield is the market price and expected inflation is inferred from it; in the euro area the inflation expectation is the measured quantity — a survey of forecasters — and the real yield is what falls out by subtraction. Only the US figure is something anyone actually trades, so the euro number is the softer of the two and should be treated as such. Two mismatches follow when the pair is compared: the US breakeven embeds an inflation risk premium that a survey does not, and the SPF horizon is five years against the bond's ten.
Decomposing the 143 bp nominal gap between the two regions: only 28 bp is a difference in expected inflation (2.32% vs 2.04%), and 115 bp is a difference in real rates (2.38% vs 1.23%). This is overwhelmingly a real-rate story, not an inflation story — higher US trend growth, fiscal supply, and euro-area savings dynamics, not a divergent inflation outlook.
⚠️ The US–euro real rate gap is not an investment opportunity
The US real yield has exceeded the euro one continuously for more than a decade. It is a structural feature, not a trade a euro-based reader can capture. Hedging the currency cancels it almost exactly, because the forward rate is set to remove the interest differential; unhedged, it is a bet on the dollar rather than a bond decision — and the dollar is currently sitting near multi-month lows on sovereign debt concerns, which is precisely the wrong backdrop for treating a yield pickup as free. A real yield is real in its own currency: 2.38% means 2.38% above US inflation, which is not a real return for someone who spends euros. The gap is stated here as a macro fact about relative policy stance and growth expectations, and no portfolio conclusion is drawn from it.
Bond Portfolio Implications
Earnings yield gap — what it is. This compares the income the two instruments offer today, using nothing but quoted prices: no growth forecast, no assumptions. It is not the equity risk premium, which is expected total return minus the risk-free rate and requires a growth estimate this measure omits. It does not forecast whether equities will beat bonds, and none is offered here.
- S&P 500 gap: (1÷25.72) − 4.70% = 3.89% − 4.70% = −0.81 pp. Bonds pay more current income than equities.
- Nasdaq 100 gap: (1÷30.26) − 4.70% = 3.31% − 4.70% = −1.39 pp.
- Euro gap (STOXX 600): (1÷18.04) − 3.25% = 5.54% − 3.25% = +2.29 pp.
The real-yield version, and the size of the correction. Stating the gap against the real yield rather than the nominal one corrects for the fact that a bond coupon is fixed for a decade while the earnings behind an equity yield grow roughly with inflation. For the US: 3.89% − 2.38% = +1.51 pp. The correction is 2.32 pp — large enough to flip the sign of the gap outright, which is the point worth reporting. For the euro area: 5.54% − 1.23% = +4.31 pp. Note that the US and euro real yields are constructed in opposite directions (above), so the euro figure is the softer number; the pair should not be read as two measurements of the same instrument.
Two structural biases to keep in view. First, the gap ignores growth entirely, which is what the real-yield version above partly repairs. Second, an equity holder does not receive the full earnings yield in cash — only the dividend and buyback portion arrives; the rest is retained. Whenever this section is read as a comparison of income, that second point matters: the S&P 500's 3.89% earnings yield is not 3.89% of cash in hand, whereas the Treasury's 4.70% coupon is.
For a forward-looking valuation argument, lean on earnings yield versus its own history — that measure does carry predictive content, where the gap does not.
Duration risk. A 100 bp rise in yields costs roughly 8–9% in price on a 10-year bond, and considerably more at the long end where the 30-year sits at 5.23%. The curve's shape argues for staying in the belly rather than the wings: the 2Y–10Y segment picks up 46 bp of yield for manageable duration, whereas extending from 10Y to 20Y buys 51 bp at roughly double the interest rate sensitivity, and the 20Y-to-30Y extension buys just 2 bp for ten more years of duration — which is not a trade worth making. Short duration remains well paid at 4.24% for two years with the funds rate at 3.50–3.75%.
Currencies & Commodities
Currencies:
| Pair | Rate | Source |
|---|---|---|
| EUR/USD | 1.1581 | FRED DEXUSEU (2026-08-14) |
| EUR/USD | 1.1682 | web search (2026-08-24, +0.02%) |
| USD Index | 118.90 | FRED DTWEXBGS (2026-08-14) |
| USD/JPY | 159.08 | web search (2026-08-24, +0.06%) |
| GBP/USD | 1.3650 | web search (2026-08-24, morning trade) |
| USD/CHF | (not retrieved) | — |
The two FRED series publish weekly and are ten days stale at 14 August; the web-sourced pairs are current. Both EUR/USD readings are shown rather than one, because the difference — 1.1581 against 1.1682 — is itself the story of the last ten days: the dollar has weakened roughly 0.9% against the euro over that span, consistent with reporting that it is pinned near multi-month lows on sovereign debt concerns. Do not read a cross-rate off this table, as the rows do not share a date. USD/CHF could not be retrieved for today and is left blank.
Commodities (all front-month futures):
| Commodity | Price | Day Chg % | Ticker | Source |
|---|---|---|---|---|
| Brent Crude | $92.17 | −2.35% | BZV26 | yfinance |
| WTI Crude | $85.01 | −2.35% | CL=F | yfinance |
| Gold ($/oz) | $4,697.80 | +0.37% | GC=F | yfinance |
| Silver ($/oz) | $68.594 | −1.35% | SI=F | yfinance |
| Copper ($/lb) | $6.605 | +0.27% | HG=F | yfinance |
| Nat Gas ($/MMBtu) | $2.835 | +0.85% | NG=F | yfinance |
Day changes are settlement (24 Aug) vs the prior session's settlement (21 Aug) — the exchange's official marks on both legs.
Contract note: the Brent generic BZ=F has since rolled from BZV26 to BZX26, so the row above is
BZV26's own 24 August settlement — the contract the briefing quoted. BZX26 settled the same day at
$90.54, $1.63 lower; that gap is the spread between two contracts, not a price move. The other
five rows are still on the contract the briefing quoted.
Crude. Both benchmarks settled down about 2.35% on the day the Iran sanctions were published, having risen more than 5% over the preceding two weeks. WTI settled at $85.01, 28.9% below its 52-week high of $119.48 and 54.6% above its 52-week low of $54.98; Brent settled at $92.17, 26.9% below its 52-week high of $126.10 and 57.0% above its low of $58.72. Both contracts' record highs date from July 2008 and say nothing useful about today's market, so the 52-week range is the relevant frame.
Gold and silver. Gold settled at $4,697.80, 15.9% below its all-time high of $5,586.20, set on 29 January 2026, and 39.6% above its 52-week low. It rose 0.37% on the day — a notably muted safe-haven response to a major sanctions announcement, which supports the sell-the-news reading of the oil move. Silver settled at $68.594, 43.5% below its all-time high of $121.30, also set on 29 January 2026, and fell 1.35%; it remains 78.1% above its 52-week low. Both metals are well off the January peak, and neither is anywhere near record territory despite the geopolitical backdrop.
Copper and gas. Copper settled at $6.605, 1.83% below its all-time high of $6.728 set on 6 August 2026 — near a record, and the only commodity here anywhere close to one. On the intraday capture it sat just outside that 2% band; the settlement puts it inside, and the industrial-demand signal in that is more encouraging than the equity tape today. Natural gas settled at $2.835, up 0.85%, sitting near the bottom of a wide 52-week range ($2.483–$7.827) and 14.2% above its low.
Crypto: no moves above the 3% threshold were retrieved; omitted.
Sector & Theme Highlights
Semiconductors were the day's clear loser and the source of the global impulse: Samsung Electronics −8.35% on a shareholder-return plan judged inadequate, dragging the Kospi −3.12% and feeding through to the Nikkei and the Nasdaq 100. Notably SK Hynix rose 2.4% on the same session and the KOSDAQ gained, so this was a company-specific capital-return repricing that spread by sentiment rather than a demand-side semiconductor warning. The AI capex theme remains intact on fundamentals but has become sensitive to how the cash it generates is returned.
Energy fell with crude on the sanctions announcement — the second consecutive theme where a bullish headline produced a bearish tape, and a reminder of how much escalation risk was already priced after two weeks of Hormuz-driven gains.
Defensives and value outperformed: the Dow closed +0.26% while the Nasdaq 100 closed −0.97%, the FTSE 100 was Europe's best major index at +0.35%, and the ASX 200 was Asia's only gainer at +0.49%. The pattern across three regions is consistent — investors rotated within equities rather than out of them.
Cross-market themes to watch: the extension of secondary sanctions explicitly to Chinese counterparties creates a new channel from Middle East policy into Chinese equity and EM broadly; and German industrial recovery (manufacturing PMI 54.1, best since May 2022) is diverging sharply from German services (48.5, five months contracting), a split that will complicate the ECB's read on the euro area's largest economy.
Top Stories (Global)
- US launches "Operation Economic Outcast" against Iran. An expanded sanctions campaign that Treasury Secretary Bessent had trailed as an "economic D-Day", with China explicitly not exempted from secondary measures. Oil settled about 2.35% lower on the announcement after a >5% two-week run-up — a sell-the-news unwind rather than a supply-risk repricing.
- Samsung's ₩110trn shareholder-return plan backfires. The largest such programme in Korean corporate history fell short of market expectations; the shares dropped 8.35% and the Kospi closed −3.12% at 6,696.96, with foreign investors net-selling ₩3.69trn and institutions ₩1.29trn.
- US–Canada trade talks fail, with reciprocal tariff threats renewed — a second risk headline weighing on US equities alongside the Iran story.
- Dollar pinned near multi-month lows on sovereign debt concerns, with EUR/USD at 1.1682 and the 30-year Treasury at 5.23% (settled, 24 August). Fiscal anxiety is showing simultaneously in the currency and at the long end of the curve.
- Germany confirms Q2 GDP at +0.2% q/q, +0.9% y/y, driven by exports while capital formation declined and consumption stayed subdued — a weaker composition than the headline implies.
- Eurozone flash PMIs surprise to the upside (released 21 August): manufacturing 52.8, fastest in four years, with German manufacturing at 54.1 but German services falling to 48.5.
- US payrolls contracted 23k in July (FRED PAYEMS) with headline CPI at 3.30% and core at 2.47% — a combination that leaves the Fed's path genuinely ambiguous and keeps the 3-month bill above the funds midpoint.
Looking Ahead
Tuesday 25 August - German Ifo Business Climate Index for August — released since this briefing: 88.8, up from 86.6 in July and a six-month high. The manufacturing PMI strength is showing up in the broader business survey, which sits awkwardly beside German services at 48.5. - US new home sales, July (Census/HUD, 10:00 ET) — June printed a 628k annualised rate. - US Conference Board consumer confidence, August — follows a weak UMich final of 51.0 for August (down from 55.2), which missed a 54.5 consensus badly.
This week - Nvidia reports fiscal Q2 2027 on Wednesday 26 August, after the US close. Guidance was around $91bn of revenue and the consensus sits above it. Today's Samsung reaction raises the bar for what counts as a good print. - The Fed's Jackson Hole symposium featured in today's reporting as something markets were digesting; its signals are being traded rather than awaited.
Market closures (from the Nager.Date holiday calendar): - Monday 31 August — UK Summer Bank Holiday: London markets closed. This falls within the next five trading days. - Monday 7 September — Labour Day (US, Canada) and Independence Day (Brazil): New York, Toronto and São Paulo closed. - No closures in Germany, France, Japan, Australia, Switzerland or Korea in the next two weeks. - Note: the Indian holiday list is empty in the calendar, so Indian closures could not be checked and are not asserted either way.