2026 10 01
Global Financial Briefing — Thursday, 1 October 2026
Figures reflect the 1 Oct close wherever close data exists. FX quotes and the French, German, UK, Japanese and Italian bond yields are late-afternoon quotes; other figures are dated inline. The US Treasury curve is the 1 Oct close; the euro AAA curve is the 30 Sep curve, the latest the ECB had published.
Market Overview
Long-term government bond yields reached multi-decade highs in the morning and gave the gains back by the afternoon, except in France and Italy, where they closed higher. The UK 30-year gilt yield touched 6.07%, its first time above 6% since 1998, before easing to about 5.9% (Investing.com, Yahoo Finance UK). The US 10-year Treasury yield briefly reached about 5.34%, its highest since 2002 (Yahoo Finance), and settled at 5.24%, 5 bp lower on the day, with the 5-year down 8 bp at 5.01% (US Treasury par curve). Germany's 10-year yield touched 3.65% in the morning, its highest since June 2009 (Investing.com), and by late afternoon was 3.49%, 9 bp lower on the day (Trading Economics). The morning rise came with higher oil prices (Bloomberg, ABC News). The US factory survey, the ISM manufacturing index, came in at 54.5 against 55.0 expected, but its prices-paid component, which tracks what factories pay for materials, jumped to 77.9 from 71.1, its highest since May (investinglive, Yahoo Finance).
Oil rose for a second day, after falling on 29 September. The December Brent contract (BZZ26) settled at $102.31, up 4.37% on Wednesday's settlement, and November WTI (CLX26) at $92.87, up 2.71%. Chinese refiners suspended fuel exports for October: Beijing began its week-long National Day holiday on Thursday without issuing export permits to the major refiners, except for shipments to Hong Kong and Macau, and PetroChina cancelled several October cargoes of gasoline and jet fuel (Quartz, citing Reuters). On Iran, President Trump said the choice was between a deal and "blowing them up", while Iran's president said Tehran had never avoided talks with Washington (Investing.com). US shares recovered from early losses to close slightly higher as Treasury yields fell back from their highs and chip stocks gained (Yahoo Finance, CNBC): the S&P 500 rose 0.19%, the Nasdaq 100 0.31% and the Dow 0.04%, with the energy sector fund up 1.95% and health care down 1.32%.
Europe fell across the board, the FTSE 100 by 1.68%, the CAC 40 by 1.62% and the STOXX 600 by 1.30%, the last after touching its lowest in more than three months (Investing.com). France presented its 2027 budget: a total correction of €54 billion, €43 billion of it in new measures, to bring the deficit to 5% of GDP in 2027 from 5.4% expected this year, with public debt reaching a record 121.7% of GDP (Journal du Net). The French 10-year yield rose above 4.9%, its highest since July 2002 (Trading Economics), and French banks fell hardest in Paris: Société Générale −5.0%, Crédit Agricole −3.7% and BNP Paribas −3.6% (BFM Bourse). The euro fell 0.82% to $1.1241, below $1.13 for the first time since May 2025, which FXStreet put down to oil above $100 and France's debt. In Asia the Nikkei rose 3.30% to its highest close in more than six weeks as chip stocks rallied on Micron's results (Investing.com, investinglive), and the Kospi gained 1.95%; Australia's ASX 200 fell 1.99% to its lowest since mid-June (ABC News). Hong Kong and mainland China were closed for National Day.
Global Indices Snapshot
Americas
| Index | Level | Day Chg | Day Chg % | Source |
|---|---|---|---|---|
| S&P 500 | 7,666.45 | +14.91 | +0.19% | yfinance ^GSPC |
| Nasdaq 100 | 30,501.56 | +93.06 | +0.31% | yfinance ^NDX |
| Dow Jones | 50,926.60 | +20.50 | +0.04% | yfinance ^DJI |
| Brazil IBOV | 187,197.45 | +857.00 | +0.46% | yfinance ^BVSP |
Americas data reflects the 1 Oct close. The S&P 500 is 1.92% below its 52-week high and 0.24% above its 50-day average (7,648); the Nasdaq 100 is 0.85% below its record of 30,762.20 and 3.81% above its 50-day average. The Dow is 3.45% below its 50-day average (52,747). The Ibovespa is 4.99% above its 50-day average (178,293).
Europe
| Index | Level | Day Chg | Day Chg % | Source |
|---|---|---|---|---|
| Euro STOXX 600 | 626.65 | −8.24 | −1.30% | yfinance ^STOXX |
| CAC 40 | 7,835.31 | −129.20 | −1.62% | yfinance ^FCHI |
| DAX | 24,939.35 | −259.84 | −1.03% | yfinance ^GDAXI |
| FTSE 100 | 10,428.27 | −177.73 | −1.68% | yfinance ^FTSE |
| SMI (Swiss) | 13,622.85 | −207.49 | −1.50% | yfinance ^SSMI |
European data reflects today's close (1 Oct). All five indices are below their 50-day averages: the STOXX 600 by 3.28%, the FTSE by 3.19%, the DAX by 3.45%, the SMI by 4.33% and the CAC 40 by 6.30%. Against their 200-day averages the CAC is 4.92% below (8,241) and the FTSE 0.19% below (10,448), while the STOXX 600, DAX and SMI are within 0.5% above theirs. The Euro STOXX 50 closed 1.49% lower at 6,175.45. In Paris Capgemini was the strongest CAC stock (+7.4%) and Société Générale among the weakest (−5.0%) (BFM Bourse); Sanofi rose 2.6% after expanding its partnership with Regeneron, which pays $1 billion upfront and up to $7 billion more (Investing.com).
Asia-Pacific
| Index | Level | Day Chg | Day Chg % | Source |
|---|---|---|---|---|
| Nikkei 225 | 68,956.72 | +2,203.00 | +3.30% | yfinance ^N225 |
| Hang Seng | 24,613.27 ‡ | — | — | yfinance ^HSI |
| Shanghai Comp | 3,842.19 ‡ | — | — | yfinance 000001.SS |
| ASX 200 | 8,614.40 | −174.90 | −1.99% | yfinance ^AXJO |
| Kospi (Korea) | 6,971.35 | +133.31 | +1.95% | yfinance ^KS11 |
Asia-Pacific data reflects today's close (1 Oct) for the Nikkei, ASX 200 and Kospi.
‡ Hang Seng: data reflects the 30 Sep close; Hong Kong was closed for National Day and reopens on 2 October (HKEX schedule).
‡ Shanghai Comp: data reflects the 30 Sep close; mainland China's National Day holiday runs to 7 October (Quartz, citing Reuters).
The Nikkei's 3.30% gain came from semiconductor and AI-related shares after Micron, the US memory-chip maker, reported record quarterly revenue and forecast more for the current quarter than analysts expected; financials and trading houses fell (newsonjapan, Rallies). In Seoul Samsung Electronics rose 2.79% and SK hynix 3.21% (Korea JoongAng Daily). Australia's fall was broad, every sector lower; ABC News put it down to higher bond yields and gloom about the Australian economy, and a manufacturing survey released the same day showed contraction (investinglive).
Emerging Markets
| Index | Level | Day Chg % | Source |
|---|---|---|---|
| MSCI EM (EEM) | 66.81 | +0.03% | yfinance EEM |
| India Nifty 50 | 22,421.95 | −0.88% | yfinance ^NSEI |
| South Africa | 62.86 | −1.75% | yfinance EZA |
The Nifty, EEM and EZA reflect the 1 Oct close. EEM closed 0.03% higher, essentially unchanged, after Korea rose 1.95% and India fell 0.88% before New York opened, with Hong Kong and mainland China shut. A US-listed fund trades through New York hours, so its price includes the dollar's 0.57% rise and the US session; China's markets do not reopen until 8 October, so they will not confirm or reverse today's move for a week.
Index Valuations & Investment Risk
Valuation Table
| Index | Trailing P/E (live) | 50-day avg | 100-day avg | 200-day avg |
|---|---|---|---|---|
| S&P 500 | 24.7x | 25.6x | 26.4x | — |
| Nasdaq 100 | 30.2x | 30.2x | 31.9x | — |
| Euro STOXX 600 | 17.3x | 18.1x | 18.2x | — |
| CAC 40 | 16.0x | 17.2x | 17.3x | — |
| DAX | 17.6x | 18.6x | 18.5x | — |
| FTSE 100 | 14.9x | 17.3x | 17.5x | — |
| Nikkei 225 | 23.0x | 21.8x | 22.8x | — |
| MSCI EM | 14.2x | 16.0x | 16.9x | — |
Averages of the daily trailing P/E readings recorded since 1 May 2026 (n = 101); shown for reference only.
Investment Risk Assessment for ETF Investors
United States (S&P 500 / Nasdaq ETFs)
The S&P 500's trailing P/E of 24.7x gives an earnings yield of 4.05% (1÷24.68). Against the 10-year Treasury at 5.24% (US Treasury par curve, 1 Oct) the earnings yield gap is −1.19 pp: a 10-year government bond pays more in income today than the index's earnings amount to per dollar invested. Against the real 10-year yield of 2.88% (US Treasury real curve, 1 Oct) the gap is +1.17 pp; the 2.36 pp between the two is the correction for company earnings growing with inflation while a bond coupon is fixed. Only the part of earnings paid out as dividends and buybacks reaches a holder as cash. The index is 1.92% below its 52-week high and 6.23% above its 200-day average (7,217), so its price has adjusted little to 10-year yields that reached a 24-year high this morning. The Nasdaq 100 at 30.2x has an earnings yield of 3.31%, 1.93 pp below the 10-year Treasury, and is 0.85% below its record. Today's US factory survey adds to the inflation pressure: firms paying more for materials raises the risk of a further Fed rise, which would hurt most the shares whose value rests on profits far in the future.
Europe (STOXX 600 / CAC 40 / DAX ETFs)
The STOXX 600 at 17.3x gives an earnings yield of 5.79% (1÷17.27); against the 10-year Bund at 3.49% (Trading Economics, 1 Oct, late afternoon) the euro earnings yield gap is +2.30 pp, and against the euro-area real 10-year yield of 1.54% (see Real Yields below) it is +4.25 pp. The Bund quote moved more than usual today, from 3.65% in the morning to 3.49%; against the 30 September AAA euro curve's 3.58% the gap is +2.21 pp. The S&P 500 trades at a 43.0% P/E premium to the STOXX 600 (24.7x against 17.3x). Part of the difference between the US and euro gaps reflects different inflation and policy paths rather than different compensation for risk, which is why the real-yield versions are shown alongside. The CAC 40 at 16.0x has an earnings yield of 6.25%, but the French government's own 10-year bond now pays 4.90%, so a French saver gives up only 1.35 pp of current yield by holding French bonds rather than French shares, against 2.30 pp for the STOXX 600 measured on the Bund. The index is 6.30% below its 50-day and 4.92% below its 200-day average, and its banks fell hardest today, which BFM Bourse linked to the French 10-year yield nearing 5%. A euro investor in euro-quoted funds has no exchange-rate effect on the quoted value, but the constituents earn much of their profit abroad, so the euro's 0.82% fall against the dollar today raises the euro value of their foreign earnings.
Japan (Nikkei / TOPIX ETFs)
The Nikkei ETF proxy trades at 23.0x after the index rose 3.30% today. The gains came from chipmakers, not the whole market: financials and trading houses fell (Rallies). The Bank of Japan's quarterly Tankan survey showed large manufacturers' confidence at +24, up from +22 in June but below the +25 forecast (investinglive). The Bank of Japan raised its policy rate to 1.25% on 18 September, its second rise this year after the 16 June move to 1.00%, and a summary of its September meeting showed some members saw a need to raise rates faster (Trading Economics). The 10-year JGB yield rose 4 bp to 3.10%, near its highest in about 30 years (Trading Economics). The yen weakened 0.21% to 157.65 per dollar. For a euro investor an unhedged Japan fund carries the yen's moves in full, so the choice between hedged and unhedged matters as much as the view on Japanese shares.
Emerging Markets (MSCI EM ETFs)
EEM trades at 14.2x, the cheapest of the eight indices in the table and a 42.4% discount to the S&P 500. It closed essentially unchanged, up 0.03%, in New York's pricing of emerging markets, with China and Hong Kong closed and Korea up 1.95%. The dollar's 0.57% rise against major currencies and oil above $100 both weigh on emerging markets through their economies: companies and governments with dollar debt pay more to service it, foreign money tends to leave, and oil importers such as India and Korea pay more for energy, which pushes their central banks towards higher rates. Those effects lower local share prices whatever currency the investor spends. For a euro holder the currency conversion matters less, since the euro also fell against the dollar today.
Overall Risk Score: - United States: High valuation risk / low margin of safety. A negative nominal earnings yield gap, an index about 2% from its 52-week high, and a 10-year yield that touched a 24-year high today. - Europe: Moderate. Positive earnings yield gaps on both measures, but oil above $100, French borrowing costs at a 24-year high and the STOXX 600 touching its lowest in more than three months. - Japan: Moderate. A P/E of 23.0x, close to the US level, carried by chipmakers; BOJ rate rises and the yen are the main risks. - Emerging Markets: Attractive relative valuation, with a stronger dollar, higher US yields and oil above $100 as the near-term headwinds.
US Economic Indicators (FRED - authoritative)
| Indicator | Current | Prior | Delta | Reference Date | FRED Series |
|---|---|---|---|---|---|
| CPI YoY % | 3.35% | 3.30% | +0.05 pp | Aug 2026 (prior Jul) | CPIAUCSL |
| Core CPI YoY % | 2.45% | 2.47% | −0.02 pp | Aug 2026 (prior Jul) | CPILFESL |
| Unemployment Rate | 4.1% | 4.1% | 0.0 pp | Aug 2026 (prior Jul) | UNRATE |
| Nonfarm Payrolls | +162k | +21k | +141k | Aug 2026 (prior Jul), monthly chg | PAYEMS |
| 10Y TIPS Real Yield | 2.88% | 2.93% | −5 bp | 1 Oct 2026 (prior 30 Sep) | DFII10 (US Treasury real curve) |
Headline consumer price inflation at 3.35% runs almost a point above core at 2.45%, the gap opened by energy prices. September's employment report is due on Friday 2 October; today's weekly jobless claims, 197,000 against 200,000 expected, showed few layoffs going into it.
Other economic releases today (investinglive, Yahoo Finance, FXStreet, Investing.com):
| Release | Actual | Consensus | Prior |
|---|---|---|---|
| US ISM manufacturing (Sep) | 54.5 | 55.0 | 54.6 |
| US ISM prices paid (Sep) | 77.9 | 72.0 | 71.1 |
| US initial jobless claims (week) | 197k | 200k | 198k |
| Euro area HCOB manufacturing PMI, final (Sep) | 52.9 | 52.7 | 52.7 |
| UK manufacturing PMI, final (Sep) | 51.9 | 52.0 | 51.7 |
| Japan Tankan, large manufacturers (Q3) | +24 | +25 | +22 |
| Japan Tankan, large non-manufacturers (Q3) | +35 | +36 | +37 |
| Australia manufacturing PMI (Sep) | 49.6 | — | 52.0 |
Euro area and UK consensus figures are the flash estimates published in September; the euro area prior is August's final reading. Tankan priors are the June survey.
The US and European factory surveys showed growth with rising costs. An ISM reading counts how many purchasing managers report improvement, not by how much: 54.5 means more firms reported better conditions than worse, for a ninth month in a row (Yahoo Finance). The prices-paid question sits outside that headline, and at 77.9 the large majority of firms reported paying more for materials, the reading that matters most for bonds since it feeds into future consumer prices. In the euro area the final reading was revised up to 52.9 from the 52.7 flash, with new orders rising at their fastest pace in more than four years and Germany at 53.9 (FXStreet). Australia's survey fell below 50, the line between expansion and contraction, as output fell at its sharpest pace in 21 months (investinglive). In Japan, firms in the Tankan expect consumer prices to rise 2.6% a year, down from 2.7% (investinglive).
Fixed Income & Bond Analysis
US Treasury yields in the tables come from the US Treasury's own daily feed and are the 1 October close. European, UK and Japanese yields are from Trading Economics, 1 October, late-afternoon quotes.
Policy Rates
| Central Bank | Rate | Source |
|---|---|---|
| Fed Funds (upper) | 4.00% | FRED DFEDTARU (1 Oct) |
| Fed Funds (lower) | 3.75% | FRED DFEDTARL (1 Oct) |
| Effective FFR | 3.88% | FRED DFF (30 Sep) |
| ECB Deposit Rate | 2.50% | FRED ECBDFR (1 Oct) |
| BOJ Policy Rate | 1.25% | Bank of Japan (raised 18 Sep 2026; next meeting 28 Oct) |
| BOE Bank Rate | ~3.73% | SONIA/FRED IUDSOIA (29 Sep) |
The Fed raised its target range to 3.75–4.00% on 16 September, its first hike since 2023. The ECB deposit rate has been 2.50% since 10 September, its second hike this year after 17 June's move to 2.25%; on 1 October money markets priced it near 2.8% by the end of the year, one more quarter-point rise, with a 24% chance of a second (Trading Economics). UK markets expect the Bank of England to begin raising rates as early as November and price four rises by mid-2027 (Trading Economics).
Government Bond Yields
| Country | 2Y Yield | 10Y Yield | 30Y Yield | Day Chg (10Y) | Source |
|---|---|---|---|---|---|
| USA | 4.78% | 5.24% | 5.61% | −5 bp | US Treasury par curve (1 Oct) |
| Germany | 3.05% | 3.49% | 3.89% | −9 bp | web (Trading Economics, 1 Oct) |
| France | 3.68% | 4.90% | 5.54% | +6 bp | web (Trading Economics, 1 Oct) |
| UK | 4.64% | 5.39% | 5.94% | −3 bp | web (Trading Economics, 1 Oct) |
| Japan | 1.94% | 3.10% | 4.18% | +4 bp | web (Trading Economics, 1 Oct) |
| Italy | — | 4.70% | — | +6 bp | web (Trading Economics, 1 Oct) |
US day change is 1 Oct vs 30 Sep. The European, UK and Japanese rows are 1 Oct late-afternoon quotes, with the day changes Trading Economics gives.
Yield Curve Spreads (US Treasury par curve, 1 Oct): - 10Y-2Y spread: +46 bp. Positive and moderately sloped, neither inverted nor steep: investors ask a modest extra yield to lend for ten years rather than two. - 10Y-3M spread: +107 bp. Firmly positive, not a recession signal. The 3-month bill at 4.17% is about 30 bp above the Fed funds midpoint of 3.875%, consistent with markets expecting at least one more Fed rise.
Yields fell at every maturity on 1 October after the morning's highs, most at 1 to 3 years, so the curve steepened between 2 and 10 years: the 2-year fell 10 bp to 4.78%, the 5-year 8 bp, the 10-year 5 bp and the 30-year 3 bp, widening the 10Y-2Y spread to 46 bp from 41 bp. In Germany the 2-year fell 15 bp to 3.05%, more than the 10-year, while French yields rose; Trading Economics cites demand for safe assets. In the UK the 2-year fell 11 bp while the 30-year ended about where it started, after crossing 6% in the morning.
OAT-Bund Spread: Trading Economics' late-afternoon quotes, the French 10-year at 4.90% against the Bund at 3.49%, put the spread at 141 bp, 15 bp wider than its 30 September quotes. Earlier quotes put the level lower: 137 bp at the close of European markets with the OAT at 4.942% (BFM Bourse) and 130 bp at 17:35 CET, up 13 bp on the day (ideal-investisseur). The Bund moved more than the OAT through the afternoon, so the level depends on when it was measured; all three sources agree on a widening of about 13–15 bp and a spread at its widest since the early 2010s, on the day France presented its 2027 budget. France now pays 20 bp more than Italy to borrow for ten years (4.90% against 4.70%).
Yield Curve Charts
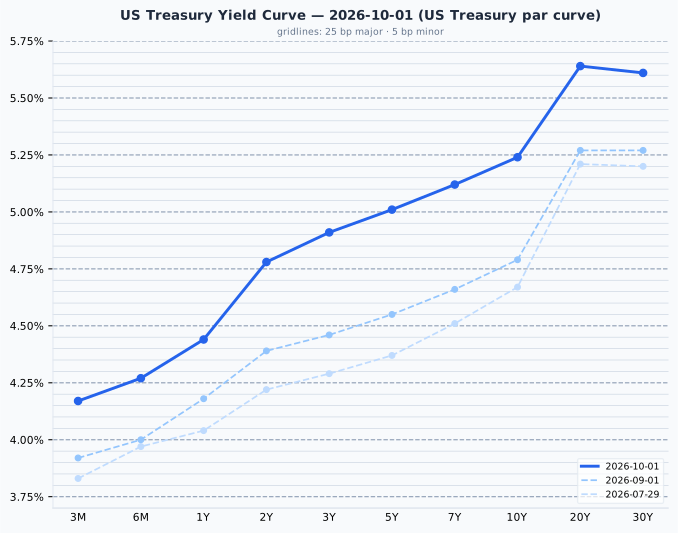
The US curve on 1 October rises from 4.17% at 3 months to 5.64% at 20 years, dipping slightly to 5.61% at 30 years. Since 1 September it has risen most at maturities from 2 to 10 years (2-year from 4.39% to 4.78%, 10-year from 4.79% to 5.24%) and less at both ends (3-month from 3.92% to 4.17%, 30-year from 5.27% to 5.61%), the pattern of a market pricing further Fed rises.
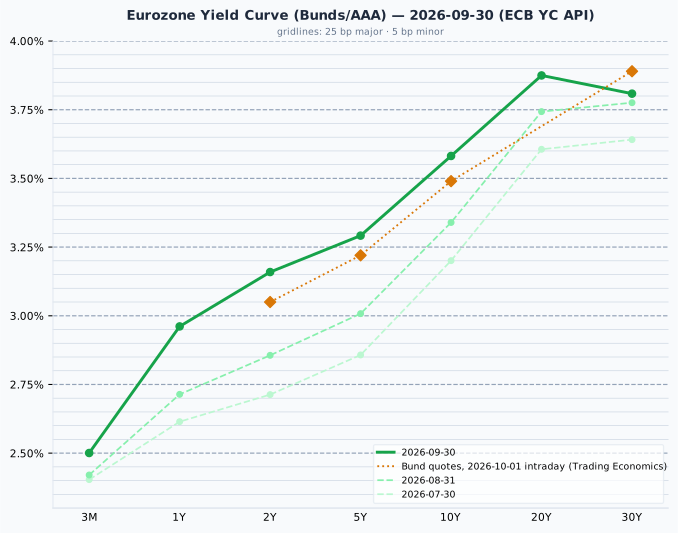
The euro AAA curve on 30 September slopes upward from 2.50% at 3 months to 3.87% at 20 years, dipping to 3.81% at 30 years. Since 31 August it has risen 30 bp at the 2-year (2.86% to 3.16%) and 24 bp at the 10-year (3.34% to 3.58%) but only 3 bp at the 30-year, led by the 2- to 5-year maturities after the ECB's 10 September hike. Today's Bund quotes (amber) sit 11 bp below the plotted curve at 2 years (3.05% against 3.16%) and 9 bp below at 10 years; at 30 years they sit 8 bp above, after 11 bp on 29 September and 10 bp on 30 September. The curve is the ECB's fitted AAA euro-area curve and the quotes are individual German bonds, which normally sit a few bp apart, so the long-end gap is a difference in construction while the 9–11 bp gaps at 2 and 10 years match today's fall in German yields.
Credit Markets (from FRED, authoritative)
| Market | OAS | Obs. date | vs prior obs | Series ID |
|---|---|---|---|---|
| US Investment Grade | 84 bp | 30 Sep | 0 bp | BAMLC0A0CM |
| US High Yield | 312 bp | 30 Sep | +4 bp | BAMLH0A0HYM2 |
| Euro High Yield | 300 bp | 30 Sep | +6 bp | BAMLHE00EHYIOAS |
Change is 30 Sep vs 29 Sep.
Credit spreads are the 30 September close; today's session is not in them yet. The extra yield lenders demand from riskier US companies widened 4 bp to 312 bp on 30 September, inside the 300–500 bp range that is normal for it and near its bottom edge; euro high yield widened 6 bp to 300 bp. Investment grade held at 84 bp, at the low end of its 80–150 bp normal range. The VIX was 16.34 on 30 September (FRED VIXCLS), a moderate reading.
Real Yields (US and Euro Area)
| Region | Nominal 10Y | Expected inflation | Real 10Y | How the real yield is obtained |
|---|---|---|---|---|
| United States | 5.24% (1 Oct) | 2.36% (nominal − real, residual) | 2.88% (1 Oct) | Measured. Inflation-protected Treasuries (TIPS) trade, so the market quotes a real yield directly; expected inflation is the residual |
| Euro area | 3.58% (ECB AAA, 30 Sep) | 2.04% (ECB SPF, 2026 Q3, measured) | 1.54% (nominal − expected, residual) | Constructed. No euro inflation-linked benchmark is published, so a survey expectation is subtracted from the nominal yield |
Only the US real yield is a market price; the euro figure is derived from a survey and is the softer of the two. The US figure also contains a premium investors demand for bearing inflation risk, which a survey does not, and the survey looks five years ahead against the bond's ten. With the US leg dated 1 October and the euro leg 30 September, the 166 bp gap between US and euro nominal 10-year yields splits into 32 bp of expected-inflation difference (2.36% against 2.04%) and 134 bp of real-rate difference (2.88% against 1.54%): nearly all of it is a difference in real rates. The US real yield fell 5 bp on 1 October, from 2.93% on 30 September, matching the 5 bp fall in the nominal yield, so expected inflation was unchanged at 2.36%.
Why the US real-yield advantage is not a return a euro investor can capture
A real yield is real in its own currency: 2.88% is 2.88% above US inflation, not euro-area inflation. Hedging a Treasury back into euros removes the interest-rate difference through the forward exchange rate, so the hedged return ends up close to the euro bond's; left unhedged, the extra yield becomes a bet on the dollar rather than a bond decision, and today's 0.82% move in the euro is larger than a month of the Treasury's extra yield. The gap reflects the two economies' different growth and policy settings, which is why it has persisted in every quarter since 2014.
Bond Portfolio Implications
- S&P 500 earnings yield gap: 4.05% (1÷24.68) − 5.24% = −1.19 pp nominal; +1.17 pp against the 2.88% real yield.
- Euro earnings yield gap: 5.79% (1÷17.27) − 3.49% (Bund) = +2.30 pp nominal; +4.25 pp against the 1.54% euro real yield.
These compare the income on offer today: a US investor can lock in 5.24% for ten years in Treasuries, against an earnings yield of about 4% on the S&P 500 that grows with profits but is only partly paid out. They say nothing about which asset will return more over the coming years.
A 10 bp rise in yields is an ordinary day's move. At the 1 October settled par yields it costs:
| Maturity | Yield | Modified duration | Loss for a 10 bp rise | Months of coupon lost |
|---|---|---|---|---|
| 2-year | 4.78% | 1.89 | 0.19% | 0.5 |
| 10-year | 5.24% | 7.71 | 0.77% | 1.8 |
| 30-year | 5.61% | 14.44 | 1.43% | 3.1 |
Par-bond figures at the 1 Oct settled yields.
The 5 bp fall at the 10-year on 1 October gained a holder about 0.39%, almost a month's coupon. The session showed how wide a single day can swing: the 10-year moved about 10 bp between its morning high of about 5.34% and its 5.24% settlement, a full ordinary day's move within one session. The 2-year pays 4.78% with about a quarter of the 10-year's price sensitivity, so short maturities still offer most of the income for far less exposure while long yields swing this much.
Currencies & Commodities
Currencies
| Pair | Rate | Day chg % | Source |
|---|---|---|---|
| EUR/USD | 1.1241 | −0.82% | yfinance (18:30 CEST) |
| USD Index (DXY, ICE) | 102.03 | +0.57% | yfinance (18:20 CEST) |
| USD/JPY | 157.65 | +0.21% | yfinance (18:30 CEST) |
| GBP/USD | 1.3199 | −0.50% | yfinance (18:30 CEST) |
| USD/CHF | 0.8309 | −0.50% | yfinance (18:30 CEST) |
FX quotes as of 18:20–18:30 CEST; day change vs the previous 17:00 ET close.
The dollar rose 0.57% on the ICE index and the euro fell most, 0.82% to 1.1241, below the 1.1265 low FXStreet reported earlier in the day and its weakest since May 2025. The pound lost 0.50%, in line with the dollar's broad rise. The Swiss franc went the other way, gaining 0.50% against the dollar, which means it rose about 1.3% against the euro (from 0.9465 to 0.9340 francs per euro, from the two dollar rates): the franc gained on the euro on the day French 10-year yields reached their highest since 2002. The yen weakened 0.21% to 157.65.
Commodities
| Commodity | Price | Day Chg % | Ticker | Source |
|---|---|---|---|---|
| Brent Crude | 102.31 | +4.37% | BZ=F | yfinance |
| WTI Crude | 92.87 | +2.71% | CL=F | yfinance |
| Gold ($/oz) | 4,202.30 | +0.37% | GC=F | yfinance |
| Silver ($/oz) | 61.175 | +1.01% | SI=F | yfinance |
| Copper ($/lb) | 6.538 | −1.26% | HG=F | yfinance |
| Nat Gas ($/MMBtu) | 2.967 | −1.95% | NG=F | yfinance |
Day changes are settlement-to-settlement: 1 Oct settlement vs 30 Sep settlement.
The table shows the December Brent contract (BZZ26), November WTI (CLX26), December gold, silver and copper, and November natural gas, the same contracts as on 30 September; none expires in the next three days. Brent, the international benchmark, rose more than WTI, and the gap between them widened to $9.44 at Thursday's settlements from $7.61 on Wednesday. Brent and WTI remain well below their 52-week highs ($126.10 and $119.48) and far above their 52-week lows ($58.72 and $54.98).
Gold at $4,202.30 is 24.8% below its all-time high of $5,586.20 (29 January 2026) and 8.8% above its 52-week low of $3,861.10. Silver at $61.18 is 49.6% below its all-time high of $121.30, set the same day. Copper at $6.54 fell 1.26% and is slightly below its all-time high of $6.83, set on 22 September, 4.3% away. Natural gas at $2.97 sits in the lower part of its 52-week range ($2.48 to $7.83).
Sector & Theme Highlights
US sector funds (Select Sector SPDRs, 1 Oct close): energy (XLE) +1.95% led, followed by technology (XLK) +1.05%, industrials (XLI) +0.99%, utilities (XLU) +0.61% and financials (XLF) +0.11%. Consumer discretionary (XLY) −0.03% was flat; consumer staples (XLP) −0.33%, materials (XLB) −0.33%, real estate (XLRE) −0.56%, communication services (XLC) −0.93% and health care (XLV) −1.32% fell.
- Oil above $100: the December Brent contract crossed $100 after Chinese refiners stopped October fuel exports, and the US energy fund was the best-performing sector, up 1.95%.
- Chips after Micron: Micron's record quarter and above-forecast outlook lifted the Nikkei 3.30% and Samsung Electronics and SK hynix about 3% each; the US technology fund rose a more modest 1.05%.
- French banks and the budget: Société Générale, Crédit Agricole and BNP Paribas fell 3.6–5.0% as the French 10-year yield rose to its highest since 2002 on the day the 2027 budget was presented.
- Long-dated bonds: UK 30-year borrowing costs crossed 6% for the first time since 1998 and the US 10-year touched a 24-year high before both eased; the morning rise came with higher oil prices (Bloomberg, ABC News).
- Australia under pressure: the ASX 200 fell to its lowest since mid-June, with every sector down and the manufacturing survey back in contraction at 49.6.
Top Stories (Global)
- Bond yields hit multi-decade highs, then eased. The 30-year gilt touched 6.07%, the first time above 6% since 1998, and the US 10-year about 5.34%, its highest since 2002, before both fell back; the 10-year settled 5 bp lower on the day at 5.24% (Investing.com, Yahoo Finance UK, Yahoo Finance).
- China halts fuel exports for October; Brent above $100. Beijing issued no export permits to major refiners for the National Day week, except for Hong Kong and Macau, and PetroChina cancelled gasoline and jet fuel cargoes; the December Brent contract settled at $102.31, up 4.4% (Quartz, citing Reuters).
- France presents its 2027 budget. A €54 billion correction aims to cut the deficit to 5% of GDP from 5.4% expected this year, with debt at a record 121.7% of GDP; the 10-year OAT rose above 4.9%, its highest since 2002, and the CAC 40 fell 1.62% (Journal du Net, Trading Economics, BFM Bourse).
- Euro below $1.13 for the first time since May 2025, down 0.82% to 1.1241, on oil and France's debt (FXStreet).
- US factory costs jump. The ISM index slipped to 54.5, below the 55.0 forecast, but prices paid rose to 77.9 from 71.1, the highest since May; jobless claims fell to 197,000 (investinglive, Yahoo Finance).
- Micron lifts Asian chipmakers. Record quarterly revenue and an above-forecast outlook sent the Nikkei up 3.30% to its highest close in more than six weeks (Investing.com, investinglive).
- Nike beats on profit, misses on sales. After the US close Nike reported first-quarter earnings of $0.48 a share against $0.44 expected, on revenue of $11.21 billion, 4% lower than a year earlier and below the $11.35 billion forecast; sales in Greater China fell 26% (Nike, SEC filing).
- Japan's Tankan improves but misses. Large manufacturers' confidence rose to +24 from +22, short of the +25 forecast, and a summary of the BOJ's September meeting showed members discussing faster rate rises (investinglive, Trading Economics).
Looking Ahead
- Friday 2 October: US September employment report, the last major labour data before the Fed's October meeting; flash euro-area inflation for September, which the German, French and Spanish figures of 30 September, all above forecast, suggest will rise.
- France: the 2027 budget goes to Parliament this autumn, and the OAT-Bund spread, at its widest since the early 2010s, is the measure of how markets receive it.
- China: mainland markets stay closed through 7 October, reopening on 8 October; whether refiners receive export permits after the holiday decides whether the fuel export halt lasts beyond October (Quartz, citing Reuters).
- Middle East: whether the US and Iran resume talks; oil and, through it, European inflation depend on it.
- Japan: the next BOJ meeting is on 28 October; the yen near 158 per dollar keeps the question of intervention open.
Market closures - Saturday 3 October: Germany, German Unity Day (falls on a weekend; no trading-day closure). - Monday 5 October: South Korea, National Foundation Day.
Mainland China's markets are closed for National Day through 7 October, reopening on 8 October (Quartz, citing Reuters); the list above does not cover China or Hong Kong. The list does not cover India.
Data sources: US Treasury par and real curves (1 Oct 2026) and FRED (policy rates, VIX, credit spreads, macro); ECB YC API (AAA curve, 30 Sep 2026) and ECB SPF (2026 Q3); equity indices, ETF P/E proxies, commodity futures, live yields and FX via Yahoo Finance (US-listed instruments at the 1 Oct close, FX as of 18:30 CEST); European, UK and Japanese bond yields, economic releases and news via web search (Trading Economics, Investing.com, Yahoo Finance, BFM Bourse, FXStreet, investinglive, Quartz, ABC News, Journal du Net, ideal-investisseur, Korea JoongAng Daily).