2026 07 13
Global Financial Briefing — Monday, 13 July 2026
Market Overview
Global markets turned risk-off today as two shocks landed simultaneously. First, the fragile US-Iran ceasefire collapsed over the weekend: Washington and Tehran exchanged fresh strikes over the Strait of Hormuz, Iran declared the strait "closed until further notice," and US Central Command pushed back with additional strikes to keep it open. Oil spiked hard — WTI and Brent both jumped roughly 8% intraday (yfinance CL=F, BZ=F) — feeding straight into inflation-expectations trades: the US 2-year Treasury yield reportedly touched its highest level since February 2025 intraday, well above the FRED official print used below. Second, and unrelated to the Middle East, South Korea's Kospi suffered a "Black Monday" collapse of 8.95%, triggering a market-wide trading halt, as SK Hynix (-15.4%) and Samsung Electronics (-10.7%) cracked on fears that the region's AI/semiconductor rally had run too far — ironically overshadowing SK Hynix's own blockbuster US ADR debut the same day.
The two stories are already visible across regional index performance below: Asian markets that closed before/during the Kospi rout show the damage directly (Kospi -8.95%, Shanghai -2.06%, Nikkei -1.92%), while Europe — which closed largely before the worst of the Kospi selling and before the weekend's oil news fully digested — finished mixed-to-slightly-higher. US markets, still in regular session, are trading lower, led by the Nasdaq 100 (-1.76%) as the semiconductor-overheating narrative spills into US chip and AI-adjacent names. Credit spreads, notably, have not moved with equities — US IG and HY OAS remain historically tight, suggesting bond markets are not yet pricing a broader growth scare.
The VIX (FRED VIXCLS) last printed 15.03 at Friday's close (2026-07-10) — right at the low/complacent-to-moderate boundary, and importantly a reading that predates both the weekend's Iran escalation and today's Kospi rout, so it likely understates current market anxiety; FRED had not yet published an updated print at fetch time.
Adding to the policy backdrop, new Fed Chair Kevin Warsh is set to testify before Congress on Tuesday — his first appearance in the role — with markets watching closely for signals on how an oil-driven inflation impulse might affect the rate path. US CPI (Tuesday) and PPI (Wednesday) land into that same window, alongside the start of Q2 bank earnings (JPMorgan, Goldman Sachs, Citigroup, Wells Fargo) and healthcare majors (J&J, UnitedHealth).
Global Indices Snapshot
Americas
US and Brazilian markets are in regular session (intraday, not close) as of 14:04 ET / 14:49 BRT on 13 Jul — figures below are live, not final closes.
| Index | Level | Day Chg | Day Chg % | Source |
|---|---|---|---|---|
| S&P 500 | 7,523.39 | -52.00 | -0.69% | yfinance ^GSPC |
| Nasdaq 100 | 29,300.26 | -524.85 | -1.76% | yfinance ^NDX |
| Dow Jones | 52,510.88 | -126.13 | -0.24% | yfinance ^DJI |
| Brazil IBOV | 175,811.27 | -2,055.11 | -1.16% | yfinance ^BVSP |
Nasdaq 100's underperformance tracks the Asian semiconductor selloff directly; the Dow is cushioned by energy-linked components benefiting from the oil spike.
Europe
European data reflects today's close (13 Jul, ~18:00 CEST).
| Index | Level | Day Chg | Day Chg % | Source |
|---|---|---|---|---|
| Euro STOXX 600 | 641.01 | -0.09 | -0.01% | yfinance ^STOXX |
| CAC 40 | 8,364.65 | +25.69 | +0.31% | yfinance ^FCHI |
| DAX | 25,114.25 | +47.16 | +0.19% | yfinance ^GDAXI |
| FTSE 100 | 10,498.29 | +1.00 | +0.01% | yfinance ^FTSE |
| SMI (Swiss) | 14,266.18 | +31.09 | +0.22% | yfinance ^SSMI |
Europe closed essentially flat, largely untouched so far by the Kospi shock and only partially reflecting the weekend oil news — a divergence worth watching into tomorrow's session.
Asia-Pacific
Asia-Pacific data reflects today's close (13 Jul, local time).
| Index | Level | Day Chg | Day Chg % | Source |
|---|---|---|---|---|
| Nikkei 225 | 67,242.73 | -1,315.00 | -1.92% | yfinance ^N225 |
| Hang Seng | 24,213.72 | +38.60 | +0.16% | yfinance ^HSI |
| Shanghai Comp | 3,913.79 | -82.37 | -2.06% | yfinance 000001.SS |
| ASX 200 | 8,808.50 | +2.50 | +0.03% | yfinance ^AXJO |
| Kospi (Korea) | 6,806.93 | -669.01 | -8.95% | yfinance ^KS11 |
Kospi's collapse triggered a market-wide circuit-breaker halt; SK Hynix and Samsung Electronics — the two largest index constituents — led the rout on AI/memory-chip overheating concerns. Shanghai and Nikkei also fell on spillover semiconductor weakness, while Hang Seng and ASX 200 were comparatively insulated.
Emerging Markets
| Index | Level | Day Chg % | Source |
|---|---|---|---|
| MSCI EM (EEM) | 64.57 | -3.49% | yfinance EEM |
| India Nifty 50 | 24,211.00 | +0.02% | yfinance ^NSEI |
| South Africa | 62.64 | -1.86% | yfinance EZA |
MSCI EM's ETF-level decline (-3.49%) is disproportionate to India's flat session — a reminder the EEM basket has heavy Korea/Taiwan semiconductor exposure that is absorbing today's shock directly.
Index Valuations & Investment Risk
Valuation Table
| Index | Trailing P/E (live) | Hist avg trailing P/E (†) |
|---|---|---|
| S&P 500 | 26.97x | ~16-18x |
| Nasdaq 100 | 31.63x | ~25-30x |
| Euro STOXX 600 | 18.56x | ~15-17x |
| CAC 40 | 17.59x | ~14-16x |
| DAX | 18.35x | ~15-17x |
| FTSE 100 | 17.54x | ~13-15x |
| Nikkei 225 | 21.81x | ~20-22x |
| MSCI EM | 16.64x | ~13-15x |
(†) Hist avg trailing P/E: static long-run reference constants.
Trailing P/E (live): sourced from yfinance trailingPE on ETF proxies (SPY, QQQ, EXSA.DE, CAC.PA, EXS1.DE, ISF.L, 1321.T, EEM), fetched 13 Jul 2026.
Premium/discount to historical avg midpoint: - S&P 500: +58.6% — historically stretched - Nasdaq 100: +15.0% - Euro STOXX 600: +16.0% - CAC 40: +17.2% - DAX: +14.7% - FTSE 100: +25.3% — elevated - Nikkei 225: +3.9% — near fair value - MSCI EM: +18.9%
Investment Risk Assessment for ETF Investors
United States (S&P 500 / Nasdaq ETFs) SPY's trailing P/E of 26.97x sits 58.6% above its ~17x historical average — historically stretched by a wide margin, and QQQ at 31.63x is a more modest 15% above its own higher-multiple norm. Earnings yield on SPY is (1÷26.97) ≈ 3.71%; against the FRED 10Y Treasury yield of 4.54% (FRED DGS10, 2026-07-09), the Equity Risk Premium is -0.83% — negative, meaning Treasuries currently out-yield S&P 500 earnings, a historically unfavorable signal for forward equity returns. The 10Y TIPS real yield of 2.31% (FRED DFII10, 2026-07-09) is elevated by recent standards and works against high multiples via a higher discount rate. On the technical side, the S&P 500 (7,523, intraday) sits roughly 93% of the way up its 52-week range (6,201.59–7,620.90) and above both its 50-day (7,433) and 200-day (6,965) moving averages — the pullback has not broken trend. Concentration and AI-capex risk are front-and-center given today's direct read-through from Korea's semiconductor unwind into the Nasdaq.
Europe (STOXX 600 / CAC 40 / DAX ETFs) EXSA.DE trailing P/E of 18.56x is a more moderate 16% above its historical range. Earnings yield ≈ (1÷18.56) ≈ 5.39%; against Germany's 10Y Bund yield of 3.09% (web search, 2026-07-09), the Euro ERP is +2.30% — comfortably positive and notably more attractive than the US on a relative-value basis. Currency risk cuts both ways for non-EUR investors given EUR/USD's recent range (FRED DEXUSEU 1.1448, 2026-07-02). Geopolitically, Europe's heavier reliance on Middle East energy imports leaves it directly exposed to a prolonged Strait of Hormuz disruption.
Japan (Nikkei / TOPIX ETFs) Nikkei trailing P/E of 21.81x is close to its historical norm (+3.9%) — the most fairly valued of the major indices covered here. The bigger story is currency: USD/JPY has pushed to ¥162.41 (web search, 2026-07-13), extending yen weakness, even as the BOJ raised its policy rate to 1.00% in June — the highest since 1995 — with commentary suggesting a further move toward a ~2% "neutral" rate is possible. That combination (weak yen, rising policy rate) creates two-sided risk for unhedged holders: currency losses now, tightening-driven valuation pressure ahead.
Emerging Markets (MSCI EM ETFs) EEM's trailing P/E of 16.64x is 18.9% above its historical range — the valuation discount to developed markets has compressed. Today's -3.49% EEM move illustrates EM's concentrated exposure to the Korea/Taiwan semiconductor complex; a China-only view (Shanghai -2.06%, Hang Seng +0.16%) understates the basket's actual volatility today. Currency and political risk are elevated across EM oil-importing economies (India, Korea) given the Strait of Hormuz standoff.
Overall Risk Score (qualitative, not financial advice): - US: High valuation risk / low margin of safety — negative ERP, stretched multiple, direct exposure to today's AI-overheating narrative. - Europe: Moderate — fair-to-moderately-elevated valuation, but a meaningfully positive ERP versus the US. - Japan: Moderate — valuation close to fair value, but currency and BOJ tightening risk offset that. - Emerging Markets: Moderate-to-high — valuation discount has narrowed and today's volatility shows concentration risk in the EM ETF basket.
Disclaimer: This is financial information, not personalised investment advice. Past valuations do not guarantee future returns. Consult a financial advisor before investing.
US Economic Indicators (FRED - authoritative)
| Indicator | Current | Prior | Delta | Reference Date | FRED Series |
|---|---|---|---|---|---|
| CPI YoY % | 4.17% | 3.78% | +0.39pp | May 2026 | CPIAUCSL |
| Core CPI YoY % | 2.82% | 2.74% | +0.08pp | May 2026 | CPILFESL |
| Unemployment Rate | 4.2% | 4.3% | -0.1pp | June 2026 | UNRATE |
| Nonfarm Payrolls | 158,984k | 158,927k | +57k | June 2026 | PAYEMS |
| 10Y TIPS Real Yield | 2.31% | — | — | 2026-07-09 | DFII10 |
Headline CPI YoY has accelerated for two consecutive months (3.29% → 3.78% → 4.17%) and now sits well above the Fed's 2% goal, while core CPI is rising more gently. That backdrop — combined with today's oil shock — raises the stakes for Tuesday's CPI print and new Fed Chair Warsh's first Congressional testimony.
Other economic releases this week (from web search): US CPI is scheduled for Tuesday 14 July, PPI for Wednesday 15 July (both 8:30am ET). No major same-day (13 Jul) US releases were found; the CPI/PPI prints, not today's data, are this week's key US catalysts.
Fixed Income & Bond Analysis
Policy Rates
| Central Bank | Rate | Source |
|---|---|---|
| Fed Funds (upper) | 3.75% | FRED DFEDTARU |
| Fed Funds (lower) | 3.50% | FRED DFEDTARL |
| Effective FFR | 3.62% | FRED DFF |
| ECB Deposit Rate | 2.25% | FRED ECBDFR |
| BOJ Policy Rate | 1.00% | web search — raised 25bps on 2026-06-16, highest since 1995 |
| BOE Bank Rate | ~3.73% (SONIA/FRED) | FRED IUDSOIA (2026-07-09) |
Government Bond Yields
| Country | 2Y Yield | 10Y Yield | 30Y Yield | Source |
|---|---|---|---|---|
| USA | 4.16% | 4.54% | 5.05% | FRED (2026-07-09) |
| Germany | (not retrieved) | 3.09% | 3.62% | web (2026-07-09/13) |
| France | — | 3.75% | — | web |
| UK | 4.18% (2026-06-18) | 4.89% | — | web |
| Japan | — | 2.88% (2026-07-10) | — | web |
| Italy | — | 3.87% | — | web |
Yield Curve Spreads (FRED pre-computed): - 10Y-2Y spread: 35 bps (FRED T10Y2Y, 2026-07-10) — positive and above the ±25bps "flat" band but well short of a historically "steep" curve (~75bps+); the market is pricing continued growth without urgency around cuts. - 10Y-3M spread: 71 bps (FRED T10Y3M, 2026-07-10) — positive, not signaling recession risk currently.
OAT-Bund spread: ~66 bps (France 10Y 3.75% − Germany 10Y 3.09%, both web search). BTP-Bund spread: ~78 bps (Italy 10Y 3.87% − Germany 10Y 3.09%). Both remain contained, not flashing fiscal-stress signals.
Yield Curve Chart
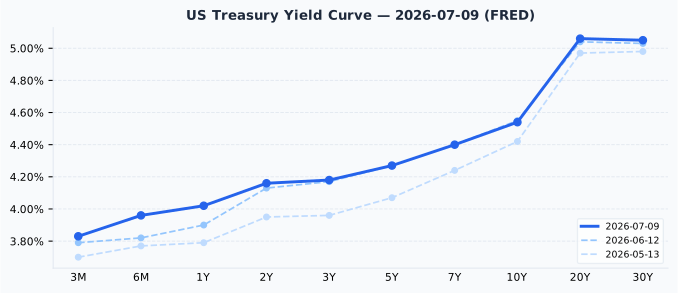
The curve remains normal/upward-sloping across the full 3M-30Y span, running from 3.83% at the front to 5.05-5.06% at the long end. Versus one month ago (12 June), the front end has risen the most — 6M and 1Y yields are up 12-14bps — while the 10Y-30Y segment is essentially unchanged (within 2bps), a modest bear-flattening that suggests the market has pared back near-term rate-cut expectations without revising its long-run inflation/term-premium view.
Eurozone curve chart omitted today: the ECB Yield Curve API was unavailable and no full current AAA curve could be sourced; a single Bund 10Y/30Y point came from web search instead (see table above).
Credit Markets (from FRED — authoritative)
| Market | OAS Spread | Series ID |
|---|---|---|
| US Investment Grade | 76 bps | BAMLC0A0CM |
| US High Yield | 269 bps | BAMLH0A0HYM2 |
| Euro High Yield | 255 bps | BAMLHE00EHYIOAS |
All three spreads sit below their respective "normal" ranges (IG 80-150bps, HY 300-500bps) — credit markets are historically tight and, notably, have not repriced alongside today's equity/FX volatility, suggesting bond investors are not (yet) treating the Kospi/oil shock as a credit event.
Bond Portfolio Implications
The US Equity Risk Premium is negative (-0.83%) — Treasuries currently out-yield S&P 500 earnings on a trailing basis, a historically cautionary signal for forward US equity returns and an argument for bonds on a relative-value basis. The Euro ERP, by contrast, is a comfortably positive +2.30%, making European equities relatively more attractive versus European sovereign debt than US equities are versus Treasuries.
⚠️ Markdown notation note applied: reciprocal calculations above use (1÷26.97) notation, not square brackets.
Duration risk: a 100bps rise in yields would produce roughly an 8-9% price loss on a 10Y bond. With the front end of the curve having moved up 12-14bps in the past month while the long end held steady, short-duration instruments have absorbed most of the recent repricing — a relevant consideration for anyone reallocating into fixed income given the negative US ERP above.
Currencies & Commodities
Currencies:
| Pair | Rate | Source |
|---|---|---|
| EUR/USD | 1.1448 (2026-07-02) | FRED DEXUSEU |
| USD Index | 120.69 (2026-07-02) | FRED DTWEXBGS |
| USD/JPY | 162.41 | web search (2026-07-13) |
| GBP/USD | 1.3410 (2026-07-09) | web search |
| USD/CHF | 0.8086 (2026-07-08) | web search |
Note: FRED's DEXUSEU/DTWEXBGS series had not yet published observations past 2 July at fetch time; USD/JPY is the freshest FX data point (today) and shows clear yen weakness tied to the oil-driven risk-off move, consistent with Japan's heavy Middle East crude dependence.
Commodities (all from yfinance front-month futures):
| Commodity | Price | Day Chg % | Ticker | Source |
|---|---|---|---|---|
| Brent Crude | $82.18 | +8.12% | BZ=F | yfinance |
| WTI Crude | $77.20 | +8.11% | CL=F | yfinance |
| Gold ($/oz) | $4,002.70 | -2.70% | GC=F | yfinance |
| Silver ($/oz) | $57.68 | -4.14% | SI=F | yfinance |
| Copper ($/lb) | $6.28 | -0.11% | HG=F | yfinance |
| Nat Gas ($/MMBtu) | $2.90 | -1.46% | NG=F | yfinance |
Oil's ~8% jump is the day's clearest cross-asset move, driven directly by the Strait of Hormuz standoff. Gold, at $4,002.70/oz, is 28.4% below its all-time high of $5,586.20 — despite the risk-off backdrop, gold fell 2.7% today, a notable divergence from its traditional safe-haven role that likely reflects profit-taking after recent strength or a stronger-dollar effect from rising short-term yields. Silver at $57.68/oz is 52.5% below its all-time high of $121.30. Copper, at $6.28/lb, is a more modest 5.7% below its all-time high of $6.65/lb — not "near" that high, but closer than the precious metals.
Crypto: No notable (>3%) moves surfaced in today's search results; omitted.
Sector & Theme Highlights
The dominant cross-market theme today is a collision of two narratives: an energy-security shock (Strait of Hormuz) and an AI/semiconductor-valuation unwind (Kospi). Energy and energy-adjacent equities are the day's best performers, cushioning the Dow specifically. Semiconductors and AI-infrastructure names are the clear laggards, with the damage concentrated in Korea (SK Hynix, Samsung) but visibly spilling into the Nasdaq 100. Defensive/value-tilted markets — UK, Switzerland, Australia — were comparatively insulated today, largely because their indices closed before the worst of the news flow. Credit markets, still historically tight, have not (yet) confirmed the equity-market's risk-off signal — a divergence worth monitoring into the rest of the week.
Top Stories (Global)
- US-Iran ceasefire collapses: fresh strikes exchanged over the weekend around the Strait of Hormuz; Iran claims the strait is closed "until further notice," a claim contested by US Central Command. (CNN, CNBC)
- Kospi's "Black Monday": the index fell 8.95% and triggered a market-wide trading halt, led by a 15.4% plunge in SK Hynix and a 10.7% drop in Samsung Electronics, on fears the AI/memory-chip rally overheated. (Korea Times, Asia Business Daily)
- SK Hynix's US ADR debut overshadowed: the company's blockbuster American depositary receipt listing landed the same day its home-market shares cratered.
- Oil surges ~8% on the Strait of Hormuz standoff, its sharpest one-day move in recent memory, per yfinance front-month futures.
- New Fed Chair Kevin Warsh testifies before Congress Tuesday for the first time in the role, with markets watching for signals on how an oil-driven inflation impulse affects the policy path.
- Q2 earnings season opens this week with major US banks (JPMorgan, Goldman Sachs, Citigroup, Wells Fargo) and healthcare majors (Johnson & Johnson, UnitedHealth) reporting.
- Gold fell despite the risk-off backdrop (-2.7%), a cross-asset divergence from its usual safe-haven behavior worth watching in the days ahead.
Sources: Yahoo Finance, TheStreet, Al Jazeera
Looking Ahead
Key events, next 1-5 trading days: - Tue 14 Jul: US CPI (8:30am ET); new Fed Chair Kevin Warsh's first Congressional testimony - Wed 15 Jul: US PPI (8:30am ET) - This week: Q2 earnings begin — JPMorgan, Goldman Sachs, Citigroup, Wells Fargo, Johnson & Johnson, UnitedHealth - Ongoing: Strait of Hormuz standoff — any de-escalation or further escalation is likely to dominate oil and broader risk sentiment through the week
Market closures (next 5 calendar days, from the Nager.Date holiday calendar): - Tuesday 14 July — France: Bastille Day (Fête nationale) — French markets closed - Friday 17 July — South Korea: Constitution Day — Korean markets closed, just days after today's Kospi rout
No closures found for US, GB, DE, JP, AU, CH, CA, BR in this window (India holiday data unavailable).