2026 09 22
Global Financial Briefing — Tuesday, 22 September 2026
Americas index levels, commodities and day changes reflect the 22 Sep 2026 closing print. The US Treasury par and real curves, the curve spreads and the US curve chart are the 22 Sep 2026 close. The euro AAA curve is the 21 Sep 2026 observation, the latest the ECB had published. FX is the evening quote; credit and macro figures are dated inline.
Market Overview
Monday's oil-led rally did not continue so much as reverse, and the settlements say so more plainly than the intraday tape did. The proximate reason was a single sentence at the UN General Assembly: Trump said a deal with Iran would probably come only after the November midterms, "because it doesn't make sense for them not to" (Yahoo Finance live blog, Bloomberg). Crude had fallen hard in the European morning on reports that Iran might reopen the Strait of Hormuz within seven days if the US eased military pressure, and it recovered part of that once the speech put any agreement on the far side of an election, but only part: November WTI settled at $90.52, 2.00% below Monday's $92.37, and November Brent at $99.25, 1.09% below $100.34, a fifth consecutive decline for crude. Saudi Arabia's progress in restoring the East-West pipeline ran alongside the diplomacy all session. Treasuries did move with it, and in the direction the midday quotes had not shown: the settled par curve for 22 September has the 2-year at 4.71%, 5 bp below Monday, with the 10-year unchanged at 4.96% and the 30-year unchanged at 5.29%, so the session's rally was confined to the front of the curve, where oil and the near-term inflation path are priced, and nothing at all reached the long end. Equities split along the line that has organised the whole month: the Nasdaq 100 closed up 0.82% at 30,732.40 on mega-cap technology, Meta holding most of Monday's roughly 11% surge and trading as high as $757.27, while the Dow closed down 0.36% at 51,863.70 with financials the drag, and the S&P 500 finished between them at 7,764.64, all but unchanged at six hundredths of a point below Monday's close. The Russell 2000 closed up 0.55%, so breadth was better than the Dow suggests. The one US release of substance was poor and ignored: the Richmond Fed manufacturing index for September at −2 against +5 expected and +4 prior, back into contraction. Ten Federal Reserve speakers were scheduled, the heaviest day of the week and the first full week of commentary since the 16 September increase in the target range to 3.75 to 4.00%, the first hike since 2023. The VIX closed Monday at 14.87 (FRED VIXCLS, 21 September), which is low.
Europe closed almost exactly where it opened, and the interesting move was in its bond market rather than its equities, as on Monday. The STOXX 600 finished at 642.78 (+0.13%), the CAC 40 at 8,154.91 (+0.20%), the DAX at 25,578.85 (+0.02%), the Euro STOXX 50 at 6,324.72 (+0.10%), the SMI at 13,953.39 (−0.02%) and the FTSE 100 at 10,708.33 (−0.29%), a set of numbers that amounts to a pause after Monday's 1% advance. Underneath, euro-area yields gave back a fraction of Monday's rally and France gave back more than its neighbours: the 10-year Bund rose 1.7 bp to 3.47%, the 2-year Bund 2.5 bp to 3.23%, the 10-year BTP 2.7 bp to 4.36% and the 10-year OAT 3.6 bp to 4.51% (Trading Economics, 22 September). That puts the OAT-Bund spread at 104 bp against about 101 bp on Monday, so the compression that followed Friday evening's Scope downgrade of France to A+ has partly unwound within a session, and the OAT now stands 15 bp above the BTP. The day's euro-area data did not help sentiment: flash consumer confidence for September came in at −16.5 against −16.0 expected and −15.5 in August, a further deterioration on the month. Gilts were the weakest major market, the 10-year up 3.0 bp to 5.25% and the 30-year up 4.9 bp to 5.75%, on public sector net borrowing for August of £18.3bn against £15.7bn expected; the market still prices roughly an 80% chance of a Bank of England hike in November and about 56% odds of a second by year-end (Trading Economics). In single names, Bureau Veritas was indicated about 2.8% higher on raised 2027-28 revenue growth guidance and a EUR 1bn AI-driven revenue target for 2030, Roche about 1.2% higher on positive Phase II data for its dual GLP-1/GIP agonist enicepatide, while LVMH and Burberry were both cut to Sector Perform at RBC, LVMH's price target going to EUR 475 from EUR 575 (Newsquawk).
Asia traded without Tokyo for a second session: Japanese markets are shut from 21 to 23 September for national holidays, so the Nikkei row below is still Friday's 65,018.95 and the JGB quotes are OTC interbank prints at Friday's levels (10-year 2.99%, 2-year 1.85%, 30-year 4.08%). The yen continued to slip through the closure, USD/JPY at 157.583 (+0.17%), two days before the Bank of Japan's 18 September increase to 1.25% from 1.00%, three months after its previous move, takes effect on 24 September. The rest of the region was quietly positive on the trade file. US and Chinese officials completed preliminary talks ahead of Thursday's Trump-Xi meeting, with Treasury Secretary Bessent describing them as very successful, and the region's AI complex did the rest: the Hang Seng rose 0.18% to 25,087.75 with Tencent up 5.0% on its Hy Image 3.5 preview model and Alibaba up 2.1% on its Zhenwu V900 accelerator and a 20 GW data centre target for 2032, Shanghai added 0.06% to 3,952.13, the ASX 200 gained 0.30% to 8,757.80 and the Kospi 0.15% to 7,017.91. India was the regional laggard, the Nifty 50 closing 0.36% lower at 23,329.00. The dollar firmed generally, EUR/USD at 1.1436 (−0.29%) and the ICE dollar index at 100.69 (+0.26%), both dated evening quotes, yet EEM closed up 0.39% at 69.10, so the better Asian tone won out over the currency.
Global Indices Snapshot
Americas
| Index | Level | Day Chg | Day Chg % | Source |
|---|---|---|---|---|
| S&P 500 | 7,764.64 | −0.06 | 0.00% | yfinance ^GSPC |
| Nasdaq 100 | 30,732.40 | +250.04 | +0.82% | yfinance ^NDX |
| Dow Jones | 51,863.70 | −185.10 | −0.36% | yfinance ^DJI |
| Brazil IBOV | 187,422.92 | +827.32 | +0.44% | yfinance ^BVSP |
Americas data reflects the 22 Sep 2026 close; the S&P 500 close matches the FRED SP500 observation for 22 Sep 2026 to the cent.
The Nasdaq 100 closed at 30,732.40, at the top of its 52-week range (22,841.42 to 30,770.63, the high set in this session) and 0.1% under it, 5.3% above its 50-day average (29,189.13) and 12.8% above its 200-day (27,254.91). The S&P 500 at 7,764.64 is also close to the top of its 52-week range (6,316.91 to 7,816.70), 1.9% above its 50-day (7,621.02) and 8.0% above its 200-day (7,187.73). The Dow tells a different tale: at 51,863.70 it is 1.9% below its 50-day (52,869.84) and only 3.5% above its 200-day (50,125.79), with a 52-week range of 45,057.28 to 54,744.33, the rate-sensitive index the one that has not recovered. The Bovespa at 187,422.92 is 6.0% above both its 50-day and its 200-day, which sit almost on top of each other at about 176,850.
Europe
| Index | Level | Day Chg | Day Chg % | Source |
|---|---|---|---|---|
| Euro STOXX 600 | 642.78 | +0.85 | +0.13% | yfinance ^STOXX |
| CAC 40 | 8,154.91 | +15.97 | +0.20% | yfinance ^FCHI |
| DAX | 25,578.85 | +3.84 | +0.02% | yfinance ^GDAXI |
| FTSE 100 | 10,708.33 | −30.68 | −0.29% | yfinance ^FTSE |
| SMI (Swiss) | 13,953.39 | −3.19 | −0.02% | yfinance ^SSMI |
European data reflects the 22 Sep 2026 close.
The STOXX 600 at 642.78 is 0.9% below its 50-day average (648.50) and 3.4% above its 200-day (621.69), within a 52-week range of 549.24 to 663.41. The DAX at 25,578.85 is 0.8% below its 50-day (25,775.19) and 3.2% above its 200-day. The CAC 40 remains the weak one: at 8,154.91 it is 3.0% below its 50-day (8,404.35) and 1.0% below its 200-day (8,240.96), the only major European index trading under both, and the OAT spread is the reason. The FTSE 100 at 10,708.33 is fractionally under its 50-day (10,754.50) and the SMI at 13,953.39 is 2.4% under its own (14,291.53).
Asia-Pacific
| Index | Level | Day Chg | Day Chg % | Source |
|---|---|---|---|---|
| Nikkei 225 | 65,018.95 ‡ | — | — | yfinance ^N225 |
| Hang Seng | 25,087.75 | +45.04 | +0.18% | yfinance ^HSI |
| Shanghai Comp | 3,952.13 | +2.22 | +0.06% | yfinance 000001.SS |
| ASX 200 | 8,757.80 | +25.90 | +0.30% | yfinance ^AXJO |
| Kospi (Korea) | 7,017.91 | +10.19 | +0.15% | yfinance ^KS11 |
Asia-Pacific data reflects the 22 Sep 2026 close.
‡ Nikkei 225: data reflects the 18 Sep 2026 close.
Tokyo has been shut since 18 September. Respect for the Aged Day falls on 21 September and Autumnal Equinox Day on 23 September, with 22 September observed as a citizens' holiday between the two; the exchange's own record of no trading since 18 September is the confirmation.
The Hang Seng at 25,087.75 is 2.0% below its 200-day average (25,597.32) and near the middle of a wide 52-week range (22,518.00 to 28,056.10). Shanghai at 3,952.13 is 1.3% above its 50-day (3,901.04) but 1.4% below its 200-day (4,009.77). The ASX 200 at 8,757.80 is 2.4% under its 50-day (8,975.72). The Kospi needs its range stated to be read properly: at 7,017.91 it is well above its 50-day (6,692.89) and its 200-day (6,221.64), yet its 52-week range runs from 3,365.73 to 9,385.59, the high set on 19 June, so the index has roughly doubled off last autumn's low and still sits a quarter below where it traded in midsummer. The Nikkei's stale level is 1.0% under its 50-day (65,656.79).
Emerging Markets
| Index | Level | Day Chg % | Source |
|---|---|---|---|
| MSCI EM (EEM) | 69.10 | +0.39% | yfinance EEM |
| India Nifty 50 | 23,329.00 | −0.36% | yfinance ^NSEI |
| South Africa | 69.15 | +1.35% | yfinance EZA |
Emerging-market data reflects the 22 Sep 2026 close.
EEM closed at 69.10, 3.5% under the top of its 52-week range (51.82 to 71.57) and 4.9% above its 50-day average (65.88). The Nifty 50 at 23,329.00 is the outlier in the emerging complex, 3.1% below its 50-day (24,063.15) and 4.7% below its 200-day (24,473.37). EZA closed up 1.35% at 69.15, which leaves it essentially on its 200-day (69.26), 0.2% under it.
Index Valuations & Investment Risk
Valuation Table
| Index | Trailing P/E (live) | 50-day avg | 100-day avg | 200-day avg |
|---|---|---|---|---|
| S&P 500 | 25.0x | 25.9x | — | — |
| Nasdaq 100 | 30.3x | 30.4x | — | — |
| Euro STOXX 600 | 17.7x | 18.2x | — | — |
| CAC 40 | 16.6x | 17.4x | — | — |
| DAX | 18.1x | 18.7x | — | — |
| FTSE 100 | 15.2x | 17.6x | — | — |
| Nikkei 225 | 21.6x | 21.7x | — | — |
| MSCI EM | 14.6x | 16.3x | — | — |
Averages of the daily trailing P/E readings recorded since 1 May 2026 (n = 94); shown for reference only.
Trailing P/E is yfinance trailingPE on the ETF proxies (SPY, QQQ, EXSA.DE, CAC.PA, EXS1.DE, ISF.L, 1321.T, EEM); the US-listed proxies are quoted at 12:25 ET.
On the closing print SPY's multiple is 24.99x against the 24.97x in the table, QQQ's 30.47x against 30.34x and EEM's 14.70x against 14.61x, each a difference of less than 1%, so no earnings yield in the section below changes. The European and Japanese proxies had already closed and are unaffected.
Investment Risk Assessment for ETF Investors
United States (S&P 500 / Nasdaq ETFs). SPY's trailing P/E of 25.0x gives an earnings yield of 4.00% (1÷25.0). Against a settled 10-year Treasury at 4.96% (US Treasury par curve, 22 September) that is an earnings yield gap of −0.96 pp: the bond currently offers close to a percentage point more income than the index, before any growth in those earnings. QQQ at 30.3x is starker, an earnings yield of 3.30% and a gap of −1.66 pp. Corrected onto a real basis against the 10-year TIPS yield of 2.63% (US Treasury real curve, 22 September), the S&P gap turns positive at +1.37 pp, and the size of that correction, 2.33 pp, is the point: the sign of this measure depends entirely on whether you compare a nominal bond coupon with a nominal earnings yield or strip inflation from both. Note also that a holder receives only the dividend and buyback portion of that 4.00% as cash; the remainder is retained by the companies. The level picture is the mirror of the valuation picture: the Nasdaq 100 closed 0.1% under the 52-week high it set in the same session and 12.8% above its 200-day average, which is where concentration risk lives, since the index's advance this month has come from a handful of mega-cap technology names while the Dow has fallen. Real yields are the thing to watch, and at 2.63% they are high enough to keep discounting future earnings hard.
Europe (STOXX 600 / CAC 40 / DAX ETFs). EXSA.DE at 17.7x gives an earnings yield of 5.65% (1÷17.7) against a 10-year Bund at 3.47%, a euro earnings yield gap of +2.18 pp. On a real basis, against a constructed euro real 10-year of 1.44%, the gap is +4.21 pp. The DAX proxy at 18.1x yields 5.52% for a gap of +2.05 pp, and CAC.PA at 16.6x yields 6.03% against a 10-year OAT at 4.51%, a gap of +1.52 pp, the narrowest in Europe because France pays the most for its debt. Europe therefore looks materially better compensated than the US on this measure, roughly 3 pp better on the STOXX 600 comparison, but a good part of that difference is the gap between US and euro-area inflation and policy paths rather than a difference in risk compensation. The real-yield versions narrow the advantage from about 3.1 pp to about 2.8 pp, so the bulk of it survives the correction. The risks on the European side are political and fiscal rather than valuation: the OAT-Bund spread at 104 bp, a consumer confidence reading that fell again in September, and a German coalition that took a poor result in Sunday's state elections.
A euro-based investor holding EUR-quoted European funds has no FX effect on the quoted value of the holding, but real currency exposure remains inside the earnings, since CAC 40 and STOXX 600 constituents are multinationals earning abroad. That exposure is smaller, slower and partly hedged by foreign cost bases, not absent.
Japan (Nikkei / TOPIX ETFs). 1321.T at 21.6x is between the US and Europe, and a JGB 10-year at 2.99% gives a gap of +1.65 pp. The dominant variable is not the multiple but the currency and the policy path behind it: the BOJ took its rate to 1.25% on 18 September and the increase takes effect on 24 September, yet USD/JPY has weakened to 157.58 through the holiday. An unhedged euro or dollar holder of Japanese equities has been paid in an index that rose and a currency that fell; a hedged position separates those two bets, and with the BOJ tightening the hedge cost has been moving in the hedger's favour. Corporate governance reform remains the structural support.
Emerging Markets (MSCI EM ETFs). EEM at 14.6x is the cheapest line in the table, an earnings yield of 6.85%, and it trades at a 42% discount to the S&P 500 multiple. The near-term drivers are all external: a 10-year Treasury near 5%, a firmer dollar on the evening quotes, and Thursday's Trump-Xi meeting, with the trade truce expiring on 10 November. China's weight in the index means the trade file matters more than the multiple.
Overall Risk Score: Moderate, with a clear regional split. US large-cap is high valuation risk and low margin of safety, with a negative nominal earnings yield gap and an index near records on narrow leadership. Europe is closer to fair value on a relative basis, with the caveat that its discount is partly a fiscal and political one, not a free lunch. Emerging markets are attractive on valuation and exposed on rates and trade.
US Economic Indicators (FRED - authoritative)
| Indicator | Current | Prior | Delta | Reference Date | FRED Series |
|---|---|---|---|---|---|
| CPI YoY % | 3.35% | 3.30% | +0.05pp | Aug 2026 | CPIAUCSL |
| Core CPI YoY % | 2.45% | 2.47% | −0.02pp | Aug 2026 | CPILFESL |
| Unemployment Rate | 4.1% | 4.1% | 0.0pp | Aug 2026 | UNRATE |
| Nonfarm Payrolls | +162k | +21k | +141k | Aug 2026 (mom) | PAYEMS |
| 10Y TIPS Real Yield | 2.63% | 2.62% | +0.01pp | 22 Sep 2026 | DFII10 |
FRED macro data is monthly and lags four to six weeks, so the CPI and labour figures describe August. The shape is the one the Fed cited when it hiked: headline inflation edging up to 3.35% on energy while core eases to 2.45%, and a labour market that rebounded sharply in August after a near-stall in July. The real yield is from the US Treasury real curve dated 22 September, not from FRED's own DFII10 print, which runs a business day behind.
Other economic releases today (from web search):
| Release | Actual | Consensus | Prior | Reaction |
|---|---|---|---|---|
| Euro Area consumer confidence, flash (Sep) | −16.5 | −16.0 | −15.5 | Miss, and weaker than August; no visible market reaction |
| US Richmond Fed manufacturing (Sep) | −2 | +5 | +4 | Clear miss, back into contraction; ignored on the day |
| UK public sector net borrowing ex-banks (Aug) | £18.3bn | £15.7bn | £2.0bn | Wider deficit; gilts the weakest major market today |
| Spain balance of trade (Jul) | −€5.22bn | −€8.1bn | −€7.69bn | Narrower deficit than expected |
| Mexico retail sales YoY (Jul) | 1.8% | 2.1% | 2.9% | Miss |
| Turkey consumer confidence (Sep) | 91.9 | 90.0 | 90.8 | Beat |
Fixed Income & Bond Analysis
Policy Rates
| Central Bank | Rate | Source |
|---|---|---|
| Fed Funds (upper) | 4.00% | FRED DFEDTARU (22 Sep) |
| Fed Funds (lower) | 3.75% | FRED DFEDTARL (22 Sep) |
| Effective FFR | 3.88% | FRED DFF (18 Sep) |
| ECB Deposit Rate | 2.50% | FRED ECBDFR (22 Sep) |
| BOJ Policy Rate | 1.25% | web search (effective 24 Sep) |
| BOE Bank Rate | ~3.73% | FRED IUDSOIA (SONIA proxy, 18 Sep) |
The Fed raised its target range to 3.75 to 4.00% on 16 September, its first increase since 2023, and sixteen of eighteen officials projected at least one further 25 bp move this year. The ECB is at 2.50% after raising on 10 September, its second hike this year following June's move to 2.25%. The BOJ took its rate to 1.25% from 1.00% on 18 September, three months after its previous increase, effective 24 September. The Bank of England has not moved, and the market prices roughly 80% odds of a November hike.
Government Bond Yields
| Country | 2Y Yield | 10Y Yield | 30Y Yield | Day Chg (10Y) | Source |
|---|---|---|---|---|---|
| USA | 4.71% | 4.96% | 5.29% | 0 bp | US Treasury par curve (22 Sep 2026) |
| Germany | 3.23% | 3.47% | 3.81% | +1.7 bp | web (Trading Economics, 22 Sep) |
| France | 3.50% | 4.51% | 5.14% | +3.6 bp | web (Trading Economics, 22 Sep) |
| UK | 4.68% | 5.25% | 5.75% | +3.0 bp | web (Trading Economics, 22 Sep) |
| Japan | 1.85% | 2.99% | 4.08% | ~0 bp | web (Trading Economics, 22 Sep) |
| Italy | 3.48% | 4.36% | 4.98% | +2.7 bp | web (Trading Economics, 22 Sep) |
The USA row is the settled par curve for 22 September, with the day change measured against 21 September. The 10-year settled unchanged while the 2-year fell 5 bp, so the day's move was a front-end one. The Japanese row is OTC interbank pricing, since the cash market has been shut since 18 September.
The UK is the outlier in the table: a 10-year gilt at 5.25% is 29 bp above the equivalent Treasury and 178 bp above the Bund, and the 30-year at 5.75% is the highest long yield of any major market here. France is the other: its 10-year sits 15 bp above Italy's, an inversion of the historical order that has now persisted for weeks.
Yield Curve Spreads:
- 10Y-2Y spread: +25 bps (US Treasury par curve, 22 September), 5 bp wider than Monday because the 2-year rallied and the 10-year did not. Right at the edge of what the ±25 bp convention calls flat. The curve is positively sloped but barely so through the belly.
- 10Y-3M spread: +80 bps (US Treasury par curve, 22 September). Positive and comfortably clear of the inversion that preceded past recessions.
What the pair says is that the market accepts the Fed's hiking path without believing it extends far. The front end has repriced up sharply on the September hike and the projections behind it, while the long end has barely moved, so the compensation for lending for ten years rather than two has been squeezed to almost nothing. That is a market pricing a short tightening cycle against an energy shock, not a durable rise in the real cost of long money.
OAT-Bund Spread: 104 bp (4.51% versus 3.47%, Trading Economics, 22 September), up from about 101 bp on Monday. Friday evening's Scope downgrade of France to A+ from AA−, level with Fitch and S&P, was absorbed in Monday's rally; today gave part of that back. The spread remains the single clearest price of French fiscal risk and the reason the CAC 40 trades below both its 50-day and 200-day averages while the DAX trades above one of them.
Yield Curve Charts
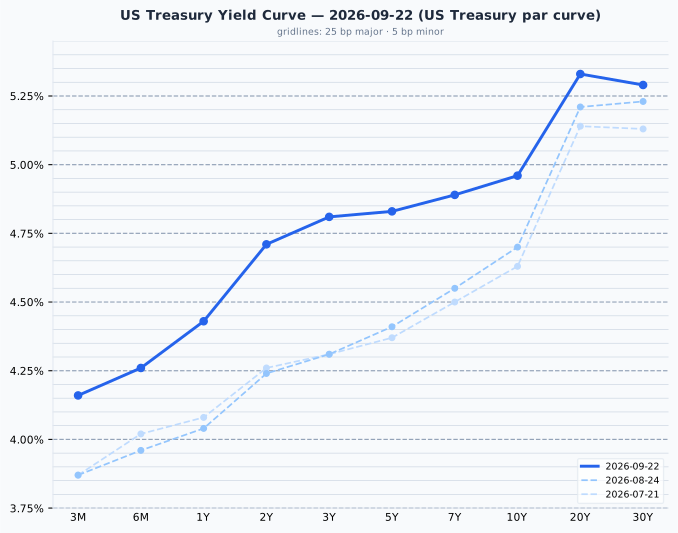
The US curve is positively sloped throughout but unusually shallow from two years out, rising only 25 bp between the 2-year and the 10-year before a 37 bp step up to the 20-year and then a slight dip at the 30-year, which at 5.29% yields 4 bp less than the 20-year. Against the 24 August curve the shift is emphatically a bear flattening: the 2-year is up 47 bp, the 3-year 50 bp and the 5-year 42 bp, while the 10-year is up 26 bp, the 20-year 12 bp and the 30-year just 6 bp. The entire month's repricing has been the market absorbing a Fed that is raising rates, with almost none of it reaching the long end. One note on the front: the 3-month at 4.16% sits about 29 bp above the Fed funds target midpoint of 3.875%, which is the bill market pricing a further hike rather than a data anomaly.
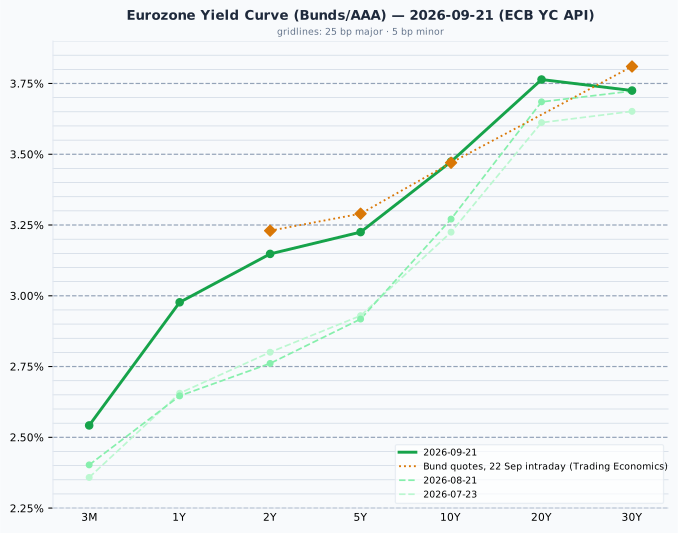
The euro AAA curve is more conventionally shaped than the US one, rising steadily from 2.54% at three months to a 3.76% peak at twenty years before easing to 3.73% at thirty. The shift since 21 August repeats the US pattern in smaller type: the 2-year is up 38.7 bp, the 1-year 33.1 bp and the 5-year 30.7 bp, against 20.3 bp at ten years and 0.2 bp at thirty, an ECB tightening cycle being priced into the front of the curve and nothing at all being priced into the back. Today's Bund quotes are plotted as an overlay because three maturities differ from the 21 September curve by 5 bp or more; the largest gap is 8.5 bp at the 30-year, where the Bund is quoted at 3.81% against a curve value of 3.73%. That is close to what the construction alone would produce: the plotted line is the ECB's fitted AAA euro-area curve and the overlay is on-the-run Bunds, which sit a few basis points apart by design, so only a gap well beyond this would be evidence of a day move.
Credit Markets (from FRED - authoritative)
| Market | OAS | Obs. date | vs prior obs | Series ID |
|---|---|---|---|---|
| US Investment Grade | 77 bp | 18 Sep | −1 bp | BAMLC0A0CM |
| US High Yield | 268 bp | 18 Sep | −2 bp | BAMLH0A0HYM2 |
| Euro High Yield | 267 bp | 18 Sep | −2 bp | BAMLHE00EHYIOAS |
Change is 18 Sep vs 17 Sep.
Credit spreads are the 18 September close; today's session is not in them yet. All three are historically tight: US high yield at 268 bp sits below the 300 to 500 bp band that has been normal over the long run, and US investment grade at 77 bp is below its own 80 to 150 bp band. Euro high yield at 267 bp is a basis point inside its US equivalent, which is unusual and says something about how little extra the euro market is charging for the same credit risk. Tight spreads of this order signal either a genuinely benign default outlook or complacency, and they sit awkwardly beside a 10-year Treasury near 5% and an energy shock working through the inflation data. What they do not do is give any warning: on this measure the credit market is not pricing stress at all.
Real Yields (US and Euro Area)
| Region | Nominal 10Y | Expected inflation | Real 10Y | How the real yield is obtained |
|---|---|---|---|---|
| United States | 4.96% (US Treasury par curve, 22 Sep) | 2.33% (residual) | 2.63% (US Treasury real curve, 22 Sep) | Measured. TIPS trade, so the market quotes a real yield directly; expected inflation is the residual, the breakeven |
| Euro area | 3.47% (ECB YC API, 21 Sep) | 2.04% (ECB SPF, 2026 Q3) | 1.44% (residual) | Constructed. No euro inflation-linked benchmark is published, so a survey expectation is subtracted from the nominal yield |
The two rows are built in opposite directions. The US measures the real yield and infers inflation; the euro area measures inflation and infers the real yield. Only the US figure, 2.63%, is a price anyone actually trades, so treat the euro 1.44% as the softer of the two. Two mismatches follow whenever the pair is compared: the US breakeven carries an inflation risk premium that a survey does not, and the SPF horizon is five calendar years ahead against the bond's ten.
Decomposing the 149 bp nominal gap between the two 10-year yields gives about 29 bp of expected-inflation difference and about 119 bp of real-rate difference, so nearly four fifths of the spread between American and European long money is a real phenomenon rather than an inflation one. The two legs no longer share a date: the US leg is the 22 September settle and the euro leg is the 21 September ECB curve, because the ECB had not yet published the 22 September observation. Neither US yield moved between those two sessions, so the mismatch costs nothing here, but it is a mismatch. The SPF expectation is in any case a quarterly survey. The real component has widened relative to early August, when the same decomposition gave 18 bp inflation and 130 bp real out of a 148 bp gap; the total is almost unchanged while its inflation share has grown, which is what a US energy shock passing into breakevens looks like.
Why the US real-yield advantage is not a return a euro investor can capture
The US real yield has exceeded the euro one in every quarter since 2014, averaging 1.52 pp and never turning negative. It is a structural feature of higher US trend growth, euro-area excess savings, Bund scarcity and US fiscal supply, not a trade a EUR-based reader can capture. Hedging the currency cancels it exactly, because the forward rate is set to remove the interest differential; unhedged, it is a bet on the dollar rather than a bond decision. A real yield is real in its own currency: 2.63% means 2.63% above US inflation, which is not a real return for someone who spends euros. The gap belongs in this briefing as a macro fact about relative policy stance and growth expectations, and nothing follows from it for portfolio construction.
Bond Portfolio Implications
On a nominal comparison bonds currently win in the US and lose in Europe. The S&P 500 earnings yield gap is −0.96 pp (4.00% against a 4.96% Treasury) and the Nasdaq 100's is −1.66 pp, while the euro gap is +2.18 pp (5.65% against a 3.47% Bund). Read that as it is meant: it compares the income the two instruments offer today, using nothing but quoted prices, and says that a US investor can lock a 4.96% coupon for a decade or accept equity risk at a 4.00% earnings yield. It is not a forecast of which will win, and no forward-return conclusion should be drawn from it in either direction.
Two structural biases apply. The gap ignores growth: a bond coupon is fixed for ten years while the earnings behind the equity yield grow roughly with inflation, so the measure understates equities by approximately expected inflation. Stating it against the real yield corrects this, and the correction is large enough to matter: 2.33 pp for the US, which flips the S&P gap from −0.96 pp to +1.37 pp. Second, an equity holder does not receive the full earnings yield in cash, only the dividend and buyback portion. Comparing the US gap with the euro gap partly measures the difference between two currencies rather than relative risk compensation, which is why the real-yield versions are given alongside; on that basis Europe's advantage narrows from about 3.1 pp to about 2.8 pp and so mostly survives. For a forward-looking valuation judgement, the earnings yield against its own history is the measure that carries predictive power, not the gap against bonds.
At today's par yields a further 100 bp rise costs about 7.5% on a 10-year and 13.4% on a 30-year (modified duration 7.81 and 14.96), against about 1.9% on a 2-year. Those numbers are smaller than they were two years ago, because a higher starting yield cushions a given move. The trade-off in the current environment is unusually lopsided: with the 10-year only 25 bp above the 2-year, an investor extending from two years to ten collects almost no extra yield while taking four times the price risk, so the case for duration here rests entirely on a view that policy rates come down sooner than the curve implies, not on the carry.
Currencies & Commodities
Currencies (yfinance live quotes):
| Pair | Rate | Day chg % | Source |
|---|---|---|---|
| EUR/USD | 1.1436 | −0.29% | yfinance (18:25 CEST) |
| USD Index (DXY, ICE) | 100.69 | +0.26% | yfinance (18:15 CEST) |
| USD/JPY | 157.58 | +0.17% | yfinance (18:25 CEST) |
| GBP/USD | 1.3324 | −0.36% | yfinance (18:25 CEST) |
| USD/CHF | 0.8222 | +0.20% | yfinance (18:25 CEST) |
FX quotes as of 18:25 CEST; day change vs the previous 17:00 ET close.
The dollar firmed against everything today, with sterling the weakest of the majors after the borrowing figures. Note that the ICE dollar index quoted here, around 100.7, is a different index from FRED's broad trade-weighted DTWEXBGS, which sits near 119.5; they are not comparable levels.
Commodities (yfinance front-month futures):
| Commodity | Price | Day Chg % | Ticker | Source |
|---|---|---|---|---|
| Brent Crude | 99.25 | −1.09% | BZ=F | yfinance |
| WTI Crude | 90.52 | −2.00% | CL=F | yfinance |
| Gold ($/oz) | 4,376.40 | −0.17% | GC=F | yfinance |
| Silver ($/oz) | 66.53 | +0.17% | SI=F | yfinance |
| Copper ($/lb) | 6.836 | +1.09% | HG=F | yfinance |
| Nat Gas ($/MMBtu) | 3.117 | +4.14% | NG=F | yfinance |
Day changes are settlement (22 Sep) vs settlement (21 Sep), the market convention for a completed session. Both legs of every row are the same contract.
Two contract notes before reading the levels. The Brent generic points at November (BZX26), where the previous briefing's row was December (BZZ26), so the quoted level sits about $4.5 below that table with no market move behind it; both legs of this day change are the November contract, so the percentage is sound even though the level is not comparable day over day. The natural gas generic has likewise already rolled to November (NGX26) while Yahoo's expireDate field still reports the October expiry of 28 September, a known one-contract lag in that field rather than an imminent roll.
Oil is the day's real subject, and the settlements are harsher than the midday tape was. Crude fell sharply in the European morning on reports that Iran might reopen the Strait of Hormuz within a week in exchange for reduced US military pressure, then recovered part of the move once Trump's UN address put any agreement after the November midterms. At midday the two contracts sat within a few tenths of a percent of Monday's settlements; by the settlement itself WTI had given back 2.00% and Brent 1.09%, a fifth consecutive daily decline for crude, with Saudi Arabia's progress in restoring East-West pipeline capacity working in the same direction. The recovery off the morning low was real, but it did not reach the flat line.
Gold settled at $4,376.40, 21.7% below its all-time high of $5,586.20, set on 29 January 2026, and trades in a 52-week range of $3,749.70 to $5,586.20. Silver settled at $66.53, 45.2% below its all-time high of $121.30, set the same day, with a 52-week range of $43.70 to $121.30. Neither metal is anywhere near its record, and the language of a precious metals bull market does not describe where these two currently trade. Copper is the opposite: its $6.836 settlement is a record, 0.45% above the previous record close of $6.8055 set on 9 September 2026 and up 1.09% on the day, with the session's high at $6.8705. Its record is two weeks old, so the distance is meaningful in a way a 2008 benchmark is not. WTI at $90.52 and Brent at $99.25 are best read against their 52-week ranges, $54.98 to $119.48 and $58.72 to $126.10 respectively, both in the upper half after the summer's energy shock; their all-time highs date from July 2008 and describe a market that has since been structurally rebuilt. Natural gas settled at $3.117, up 4.14% on the day and the strongest mover in the table, yet still near the bottom of a 52-week range of $2.483 to $7.827.
Sector & Theme Highlights
US leadership was narrow and technological, though breadth was better than the headline indices suggest: the Russell 2000 closed up 0.55%, ahead of both the S&P 500 and the Dow, while financials were the clear drag and took the Dow down 0.36% even as the Nasdaq 100 rose 0.82%. Meta held most of Monday's roughly 11% surge and traded as high as $757.27, driven by its Muse AI app reaching the top of the App Store, and PayPal rose on a partnership with it. Healthcare produced the day's largest single-stock move, Viking Therapeutics up more than 25% on obesity drug data showing 22% weight loss in trials, and Roche was up about 1.2% in Europe on Phase II results for its own dual GLP-1/GIP agonist, so the obesity-drug theme ran on both sides of the Atlantic in the same session. AutoZone gained about 5% on an earnings beat, one of only two S&P 500 reports on the day alongside KB Home, which reported after the close and beat on both lines. In Europe, luxury was the weak spot with RBC cutting both LVMH and Burberry to Sector Perform, while Bureau Veritas rose on AI-linked revenue targets.
The cross-market themes are three. Energy remains the macro driver: every other market this week has taken its direction from the Hormuz headlines, and the Fed's own September projections cited the energy shock explicitly. The AI complex is now a genuinely global trade rather than a US one, with Tencent up 5.0% and Alibaba up 2.1% on model and silicon announcements in the same session that Meta led New York. And the rates theme is a front-end one: both the US and euro-area curves have bear-flattened over the past month, with two-year yields up 47 bp and 39 bp respectively while thirty-year yields have not moved, which is a market that believes in the tightening but not in its duration.
Top Stories (Global)
- Trump tells the UN General Assembly that a US-Iran deal will probably wait until after the November midterms, saying "I believe we'll make a deal right after the election, because it doesn't make sense for them not to." Crude had dropped in the European morning on reports Iran might reopen the Strait of Hormuz within seven days if US military pressure eased; the speech removed the near-term path and oil recovered part of the fall, but not all of it: WTI settled 2.00% lower and Brent 1.09% lower, a fifth consecutive decline (Yahoo Finance, Bloomberg).
- US and Chinese officials completed preliminary trade talks ahead of Thursday's Trump-Xi meeting, with Treasury Secretary Bessent calling the discussions very successful. The existing truce expires on 10 November, and Asian markets traded the improved tone (Yahoo Finance, Bloomberg).
- The Richmond Fed manufacturing index fell to −2 in September from +4, against +5 expected, the clearest US data miss of the day and one the market ignored entirely on a session dominated by energy headlines (Trading Economics).
- UK borrowing overshot again, with August public sector net borrowing ex-banks at £18.3bn against £15.7bn expected. Gilts were the weakest major bond market, the 10-year up 3.0 bp to 5.25% and the 30-year up 4.9 bp to 5.75% (Trading Economics).
- Euro-area flash consumer confidence fell to −16.5 in September from −15.5, missing the −16.0 consensus, a reading that sits oddly beside equity indices within a few percent of their records (Trading Economics).
- Viking Therapeutics rose about 25% on obesity drug trial data showing 22% weight loss, and Roche gained about 1.2% in Europe on positive Phase II results for enicepatide, its dual GLP-1/GIP receptor agonist (Yahoo Finance, Newsquawk).
- Chinese AI names led Asia, Tencent up 5.0% on its Hy Image 3.5 preview model and Alibaba up 2.1% after unveiling the Zhenwu V900 accelerator with three times the performance of its predecessor and a 20 GW data centre capacity target for 2032 (Newsquawk).
- KB Home beat on both lines after the close, reporting third-quarter revenue of $1.297bn against about $1.294bn expected and earnings of $1.05 a share against 89 cents, while describing a weakening housing market: deliveries fell 19% year on year to 2,732 homes, net orders 12% to 2,604, and the average selling price eased to $473,000. Management credited the return to a predominantly built-to-order model, 74% of deliveries against 60% in the second quarter of its 2026 fiscal year, for a sequential improvement in housing gross margin (company release, Benzinga, StockTitan).
Looking Ahead
Central banks and policy
- Wednesday 23 September: ECB monetary policy statements, and the South African Reserve Bank's rate decision, with the market looking for 7%.
- Thursday 24 September: the Bank of Japan's increase to 1.25% takes effect. Mexico's rate decision is expected at 6.5%. Multiple Federal Reserve speeches are scheduled.
- Federal Reserve commentary runs through the week after the 16 September hike to 3.75 to 4.00%; ten speakers were scheduled today alone.
Economic releases
- Wednesday 23 September: flash PMIs for Germany, France, the UK and the US, the most consequential data of the week for a market trying to judge how much the energy shock has reached activity.
- Thursday 24 September: Australian employment, US initial jobless claims and new home sales, Canadian retail sales.
- Friday 25 September: US durable goods orders and the final University of Michigan consumer sentiment reading, plus Brazilian inflation.
Events
- Thursday 24 September: the Trump-Xi meeting, the week's largest scheduled source of headline risk for Asian and trade-exposed assets, with the trade truce expiring 10 November.
- The UN General Assembly continues in New York, and the Iran file has moved markets on each of the last two sessions.
Market closures
- Japan, Wednesday 23 September: Autumnal Equinox Day. Tokyo has already been shut since Monday and reopens on Thursday 24 September.
- South Korea, Thursday 24 to Saturday 26 September: Chuseok. The Kospi is closed Thursday and Friday.
- No Indian holiday data is available here, so Indian closures are not checked.
- No closures in the next five days for the United States, the United Kingdom, Germany, France, Australia, Switzerland, Canada or Brazil. The next entry beyond that window is Canada's National Day for Truth and Reconciliation on 30 September, followed by German Unity Day on 3 October.