2026 07 14
Global Financial Briefing — Tuesday, 14 July 2026
Market Overview
Global markets leaned risk-on Tuesday, driven by a cooler-than-expected US CPI print that eased inflation worries and a strong start to Q2 bank earnings. US headline CPI came in at 3.46% YoY (FRED CPIAUCSL, June 2026) — down sharply from 4.17% in May — with the monthly figure actually falling 0.4% on a 9.7% drop in gasoline prices. JPMorgan ($6.14 EPS vs. $5.59 expected) and Goldman Sachs ($20.98 EPS vs. $14.48 expected) both posted large beats, sending Goldman up 7.4% and lifting sentiment into the Nasdaq (+1.36%) and S&P 500 (+0.46%). The Dow lagged (-0.11%), dragged down by a 25.1% collapse in IBM after a profit warning — a reminder that the rally is narrower than the headline indices suggest.
Europe closed broadly higher but modestly so (STOXX 600 +0.17%, DAX +0.13%, FTSE 100 +0.30%), with the SMI a lone decliner (-0.17%). Asia-Pacific was mixed-to-positive: Shanghai Composite led with +1.36%, Nikkei 225 gained 0.74% and Kospi 0.73%, while India's Nifty 50 fell 0.66%. Oil markets moved on renewed Middle East tension — WTI rose over 1% after reports that shipping fees and a port blockade were being weighed against Iran, reinforcing crude's status as the day's key geopolitical risk barometer.
One point of caution beneath the rally: the VIX rose to 17.16 from 15.03 just three sessions ago (FRED VIXCLS) — a ~14% jump in implied volatility even as equity indices advanced, hinting that options markets are pricing incremental hedging demand around the Strait of Hormuz situation despite the constructive CPI and earnings backdrop.
Global Indices Snapshot
Americas
| Index | Level | Day Chg | Day Chg % | Source |
|---|---|---|---|---|
| S&P 500 | 7,549.95 | +34.61 | +0.46% | yfinance ^GSPC |
| Nasdaq 100 | 29,662.73 | +398.63 | +1.36% | yfinance ^NDX |
| Dow Jones | 52,442.14 | -56.50 | -0.11% | yfinance ^DJI |
| Brazil IBOV | 176,032.84 | +293.77 | +0.17% | yfinance ^BVSP |
Americas data reflects today's close (14 Jul).
Europe
| Index | Level | Day Chg | Day Chg % | Source |
|---|---|---|---|---|
| Euro STOXX 600 | 642.10 | +1.09 | +0.17% | yfinance ^STOXX |
| CAC 40 | 8,366.85 | +2.20 | +0.03% | yfinance ^FCHI |
| DAX | 25,147.03 | +32.78 | +0.13% | yfinance ^GDAXI |
| FTSE 100 | 10,529.39 | +31.10 | +0.30% | yfinance ^FTSE |
| SMI (Swiss) | 14,241.77 | -24.41 | -0.17% | yfinance ^SSMI |
European data reflects today's close (14 Jul). Note: 14 July is Bastille Day (French national holiday, confirmed via the holiday calendar), but Euronext Paris traded normally today — CAC 40 shows an active session close, not a market closure.
Asia-Pacific
| Index | Level | Day Chg | Day Chg % | Source |
|---|---|---|---|---|
| Nikkei 225 | 67,743.50 | +500.77 | +0.74% | yfinance ^N225 |
| Hang Seng | 24,340.73 | +127.01 | +0.52% | yfinance ^HSI |
| Shanghai Comp | 3,967.13 | +53.33 | +1.36% | yfinance 000001.SS |
| ASX 200 | 8,808.50 | +0.00 | +0.00% | yfinance ^AXJO |
| Kospi (Korea) | 6,856.83 | +49.90 | +0.73% | yfinance ^KS11 |
Asia-Pacific data reflects today's close (14 Jul, local time).
Emerging Markets
| Index | Level | Day Chg % | Source |
|---|---|---|---|
| MSCI EM (EEM) | 65.58 | +1.67% | yfinance EEM |
| India Nifty 50 | 24,052.05 | -0.66% | yfinance ^NSEI |
| South Africa | 63.47 | +1.13% | yfinance EZA |
Index Valuations & Investment Risk
Valuation Table
| Index | Trailing P/E (live) | Hist avg trailing P/E (†) |
|---|---|---|
| S&P 500 | 27.06x | ~16-18x |
| Nasdaq 100 | 32.02x | ~25-30x |
| Euro STOXX 600 | 18.55x | ~15-17x |
| CAC 40 | 17.58x | ~14-16x |
| DAX | 18.37x | ~15-17x |
| FTSE 100 | 17.60x | ~13-15x |
| Nikkei 225 | 21.98x | ~20-22x |
| MSCI EM | 16.90x | ~13-15x |
(†) Hist avg trailing P/E: static long-run reference constants.
Trailing P/E (live): sourced from yfinance trailingPE on ETF proxies (SPY, QQQ, EXSA.DE, CAC.PA,
EXS1.DE, ISF.L, 1321.T, EEM), fetched 2026-07-14.
Premium/discount to historical avg (midpoint): - S&P 500: +59.2% vs. ~17x midpoint — historically stretched - Nasdaq 100: +16.4% vs. ~27.5x midpoint - Euro STOXX 600: +15.9% vs. ~16x midpoint - CAC 40: +17.2% vs. ~15x midpoint - DAX: +14.8% vs. ~16x midpoint - FTSE 100: +25.7% vs. ~14x midpoint — elevated - Nikkei 225: +4.7% vs. ~21x midpoint — near historical norm - MSCI EM: +20.7% vs. ~14x midpoint — elevated
Investment Risk Assessment for ETF Investors
United States (S&P 500 / Nasdaq ETFs) SPY's trailing P/E of 27.06x sits nearly 60% above the ~16-18x long-run historical average — the most stretched valuation among major developed markets in this briefing. Earnings yield is (1÷27.06) = 3.70%, versus the 10-Year Treasury yield of 4.56% (FRED DGS10, 2026-07-10) — an Equity Risk Premium of -0.86%. A negative ERP means the 10-Year Treasury currently pays more than S&P 500 earnings yield, a historically unfavorable setup for forward equity returns relative to bonds. The S&P 500 sits above both its 50-day (7,440.71) and 200-day (6,969.43) moving averages, within its 52-week range of 6,201.59–7,620.90 — trend remains constructive even as valuation risk builds. The 10Y TIPS real yield of 2.32% (FRED DFII10) is historically elevated, adding further pressure on the discount rate applied to future earnings. Concentration in mega-cap tech (reflected in the Nasdaq 100's 32.02x trailing P/E) remains a key risk if AI-related earnings expectations disappoint.
Europe (STOXX 600 / CAC 40 / DAX ETFs) European equities screen considerably cheaper than the US on both an absolute and relative basis. STOXX 600 earnings yield is (1÷18.55) = 5.39%, versus the German Bund 10Y yield of 3.12% (ECB YC API, 2026-07-13) — a Euro ERP of +2.27%, meaingfully more attractive than the US figure. STOXX 600 trades at roughly a 31% discount to the S&P 500 on trailing P/E (18.55x vs. 27.06x). CAC 40 and DAX show similar modest premiums to their own historical averages (17% and 15% respectively) but nothing approaching US stretch levels. Currency risk remains a live consideration for non-EUR investors given EUR/USD volatility, and France's fiscal position keeps the OAT-Bund spread (63 bps, see Fixed Income section) on watch, though it remains within a historically contained range.
Japan (Nikkei / TOPIX ETFs) Nikkei trailing P/E of 21.98x is only 4.7% above its ~20-22x historical range — among the most fairly valued major indices covered here. The key risk is BOJ policy: the Bank hiked its policy rate to 1.00% on 16 June 2026 (effective 17 June), the highest since 1995, and officials have floated a longer-run neutral rate near 2%. Further hikes would strengthen the yen and could pressure exporter earnings, while unhedged JPY exposure remains a two-way risk for foreign ETF holders.
Emerging Markets (MSCI EM ETFs) MSCI EM's 16.90x trailing P/E is 20.7% above its own ~13-15x historical range — elevated relative to its own history, though still a meaningful discount to developed-market multiples (S&P 500 27.06x, STOXX 600 18.55x). China's weight in the index remains a structural swing factor; Shanghai Composite's own 35% discount to its all-time high underscores how far domestic Chinese equities remain from prior peaks even as EM ETF proxies trade near cycle-high multiples.
Overall Risk Score (qualitative, not financial advice): - United States: High valuation risk / low margin of safety — stretched P/E, negative ERP - Europe: Moderate — fair-to-full valuation, positive ERP, more attractive on a relative basis - Japan: Moderate — valuation near historical norm, but policy-rate and currency risk rising - Emerging Markets: Moderate — valuation elevated vs. own history, but still discounted to DM
Disclaimer: This is financial information, not personalised investment advice. Past valuations do not guarantee future returns. Consult a financial advisor before investing.
US Economic Indicators (FRED - authoritative)
| Indicator | Current | Prior | Delta | Reference Date | FRED Series |
|---|---|---|---|---|---|
| CPI YoY % | 3.46% | 4.17% | -0.71pp | 2026-06 | CPIAUCSL |
| Core CPI YoY % | 2.57% | 2.82% | -0.26pp | 2026-06 | CPILFESL |
| Unemployment Rate | 4.2% | 4.3% | -0.1pp | 2026-06 | UNRATE |
| Nonfarm Payrolls | 158,984k | 158,927k | +57k | 2026-06 | PAYEMS |
| 10Y TIPS Real Yield | 2.32% | 2.31% | +0.01pp | 2026-07-10 | DFII10 |
Note: FRED macro data is monthly and typically lags 4-6 weeks; the June 2026 CPI/employment figures above are the most recent available. The web search corroborates a 3.5% CPI YoY print reported same-day, consistent with FRED's 3.46% (small rounding/methodology differences are expected).
Other economic releases today: US PPI (Producer Price Index) and the NY Empire State Manufacturing survey were also released today per web search, though specific figures were not surfaced in the search results — omitted rather than estimated.
Fixed Income & Bond Analysis
Policy Rates
| Central Bank | Rate | Source |
|---|---|---|
| Fed Funds (upper) | 3.75% | FRED DFEDTARU |
| Fed Funds (lower) | 3.50% | FRED DFEDTARL |
| Effective FFR | 3.62% | FRED DFF |
| ECB Deposit Rate | 2.25% | FRED ECBDFR |
| BOJ Policy Rate | 1.00% | web search — hiked 25bps on 2026-06-16 |
| BOE Bank Rate | ~3.73% (SONIA/FRED) | FRED IUDSOIA (2026-07-10) |
Government Bond Yields
| Country | 2Y Yield | 10Y Yield | 30Y Yield | Source |
|---|---|---|---|---|
| USA | 4.21% | 4.56% | 5.06% | FRED (2026-07-10) |
| Germany | 2.64% | 3.12% | 3.61% | ECB YC API (AAA euro area proxy, 2026-07-13) |
| France | — | 3.75% | — | web (2026-07-14) |
| UK | — | 4.89% | — | web (2026-07-13) |
| Japan | — | 2.88% | — | web (~2026-07-09/10) |
| Italy | — | 3.87% | — | web (2026-07-14) |
Yield Curve Spreads (FRED pre-computed): - 10Y-2Y spread: +36 bps (T10Y2Y, 2026-07-13) — modestly positive, historically flat rather than steeply normal (a "healthy" expansion curve is typically 100bps+); no longer inverted - 10Y-3M spread: +73 bps (T10Y3M, 2026-07-13) — positive, consistent with the curve having fully un-inverted from its prior recession-warning shape
OAT-Bund Spread: France 10Y (3.75%) minus the ECB AAA/Bund proxy (3.12%) = 63 bps. This is a moderate, historically contained level for French fiscal risk — elevated relative to the pre-2023 era but not signalling acute stress.
Yield Curve Charts
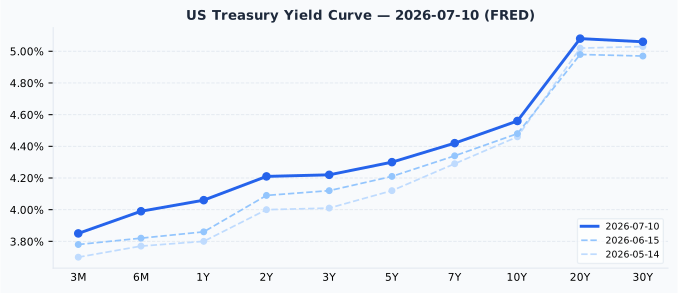
The US curve is modestly upward-sloping across its full length, with the steepest segment beyond 10 years (20Y at 5.08%, 30Y at 5.06% — a slight long-end hump rather than a clean monotonic slope). Versus one month ago (15 Jun), yields have risen in parallel by roughly 7-12 bps across every maturity, with the 2Y-10Y spread narrowing slightly (39bps → 35bps) — a mild bear-flattening as short rates rose a touch faster than the long end.
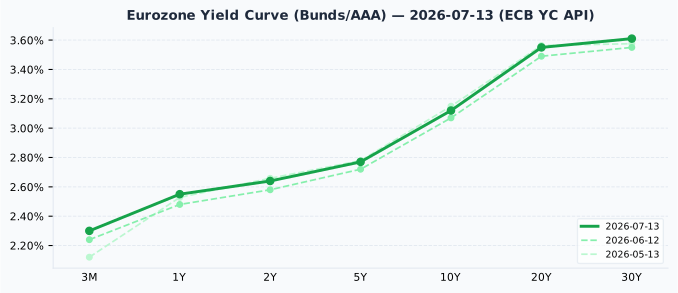
The Eurozone AAA curve is more steeply upward-sloping than its US counterpart, consistent with the ECB's lower policy rate (2.25% deposit facility vs. Fed's 3.50-3.75% target range) leaving more room for term premium to build further out the curve. Versus one month ago (12 Jun), the curve has shifted up by a similarly modest 5-6 bps across maturities, with its overall shape essentially unchanged.
Credit Markets (from FRED — authoritative)
| Market | OAS Spread | Series ID |
|---|---|---|
| US Investment Grade | 78 bps | BAMLC0A0CM |
| US High Yield | 269 bps | BAMLH0A0HYM2 |
| Euro High Yield | 252 bps | BAMLHE00EHYIOAS |
All three spreads sit below their respective "normal" benchmark ranges (US IG: 80-150bps; US HY: 300-500bps) — credit markets are pricing historically tight spreads, signalling investor complacency about default risk rather than stress. This is a mild contrarian caution flag even as equity and macro data look constructive.
Bond Portfolio Implications
The S&P 500's Equity Risk Premium is negative (-0.86%, see Valuations section above) — the 10-Year Treasury currently offers a higher yield than S&P 500 earnings would imply, a historically unfavorable signal for forward US equity returns relative to bonds. By contrast, European equities retain a positive ERP (+2.27% for STOXX 600 vs. Bund), making the relative case for European over US equity exposure somewhat stronger from a valuation standpoint, all else equal.
Duration risk remains material at current yield levels: a 100bps rise in yields would imply roughly an 8-9% price loss on a 10-Year Treasury. With tight credit spreads offering little compensation for taking on additional credit risk, investors seeking income currently face a trade-off between duration risk (longer Treasuries) and a historically thin credit premium (corporate credit) — neither offers an obviously favorable risk/reward skew at today's levels.
Currencies & Commodities
Currencies:
| Pair | Rate | Source |
|---|---|---|
| EUR/USD | 1.1438 | FRED DEXUSEU (2026-07-10) |
| USD Index | 120.50 | FRED DTWEXBGS (2026-07-10) |
| USD/JPY | 162.22 | web search |
| GBP/USD | 1.3384 | web search |
| USD/CHF | 0.8113 | web search |
Commodities (all from yfinance MCP front-month futures):
| Commodity | Price | Day Chg % | Ticker | Source |
|---|---|---|---|---|
| Brent Crude | $84.27 | +1.16% | BZ=F | yfinance |
| WTI Crude | $78.63 | +0.63% | CL=F | yfinance |
| Gold ($/oz) | $4,069.70 | +1.60% | GC=F | yfinance |
| Silver ($/oz) | $59.16 | +2.05% | SI=F | yfinance |
| Copper ($/lb) | $6.37 | +1.42% | HG=F | yfinance |
| Nat Gas ($/MMBtu) | $2.89 | -0.24% | NG=F | yfinance |
Gold is trading 27% below its all-time high of $5,586.20 — notable given gold hit that record within the past 52 weeks before pulling back sharply; this is not "near record highs" language territory despite today's solid +1.6% gain. Silver shows an even larger retracement, trading 51% below its all-time high of $121.30, having also touched that record within the past year. Both metals remain up on the day alongside the broader risk-on tone, but the scale of the pullback from recent records is the more important context for investors than the daily move.
WTI and Brent remain deep in their own historical context — WTI is 47% below its 2008 all-time high of $147.27 and Brent 43% below its $147.43 peak; today's ~1% gains reflect near-term geopolitical risk premium (Strait of Hormuz tensions) rather than a shift in the multi-year trend. Copper, at $6.37, sits just 4% below its all-time high of $6.6525 — one of the more resilient commodities relative to its own historical peak.
Crypto: No notable (>3%) Bitcoin or Ethereum moves surfaced in today's search results — omitted rather than estimated.
Sector & Theme Highlights
Financials led the tape on blowout Q2 earnings from JPMorgan and Goldman Sachs, both posting EPS well above consensus. Technology was bifurcated: CrowdStrike (+9.4%) and NetApp (+6%) rallied while IBM (-25.1%) suffered its worst drop in years on a profit warning, illustrating that the AI/tech rally remains selective rather than broad-based. Healthcare lagged, with Biogen (-8.6%) and Stryker (-6.5%) both under pressure. Energy stayed in focus as crude oil rose on renewed Iran-related shipping and blockade risk in the Strait of Hormuz — a live geopolitical theme likely to keep energy volatility elevated in the days ahead.
Top Stories (Global)
- JPMorgan Q2 EPS of $6.14 beat the $5.59 consensus estimate, with managed revenue of $58B also topping forecasts, kicking off bank earnings season on a strong note.
- Goldman Sachs posted a much larger beat — $20.98 EPS vs. $14.48 expected, revenue of $20.34B vs. $16.13B consensus — sending shares up 7.4%.
- IBM tumbled 25.1% after a quarterly profit warning, the day's single biggest drag on the Dow Jones.
- US CPI for June came in cooler than expected (3.46% YoY per FRED, ~3.5% per web reports), with a 9.7% drop in gasoline prices driving a 0.4% monthly decline — supporting the S&P 500 and Nasdaq rally.
- Oil prices rose after reports that the US is weighing shipping fees and a port blockade against Iran tied to Strait of Hormuz tensions, lifting WTI over 1% to ~$79/bbl.
- CrowdStrike (+9.4%) and NetApp (+6%) were among the day's notable tech gainers, while Biogen (-8.6%) and Stryker (-6.5%) led healthcare decliners.
- The BOJ continues to signal a gradual path toward policy normalization after its June hike to 1.00%, with one board member floating a neutral rate near 2% — a theme likely to keep JPY and Japanese equities in focus over coming weeks.
Looking Ahead
Key events and market closures in the next several trading days (per the holiday calendar, sourced from Nager.Date):
- 17 July: South Korea — Constitution Day (public holiday per holiday calendar; note Korean exchanges have historically remained open on this date since a prior reclassification — confirm locally if trading).
- 20 July: Japan — Marine Day (national holiday; Tokyo Stock Exchange typically closed).
- Bank earnings season continues through the week — more major US financials expected to report.
- BOJ policy trajectory remains a live watch item after the June hike to 1.00%, with commentary suggesting further gradual increases toward a ~2% neutral rate.
- Middle East / Strait of Hormuz developments remain a key swing factor for oil prices and broader risk sentiment.
- 14 July (today): France — Bastille Day (public holiday; Euronext Paris traded normally, confirmed via live yfinance data).