2026 07 30
Global Financial Briefing — Thursday, 30 July 2026
Americas index levels, commodities and day changes reflect the 30 July closing print. Fixed income, FX and macro figures are dated inline.
Market Overview
Global markets staged a sharp risk-on rebound on Thursday, one day after a Fed-induced sell-off. On Wednesday (29 Jul) the Dow dropped over 1,100 points and yields jumped after the FOMC held its target range steady at 3.50–3.75% (FRED DFEDTARL/DFEDTARU) in a hawkish tone. Thursday's reversal was driven almost entirely by mega-cap tech: the Nasdaq 100 closed up 3.36% (yfinance ^NDX) after Microsoft's blowout earnings — cloud/Azure growth at its fastest pace in four years, revenue +17% YoY in constant currency, and EPS of $4.74 versus ~$4.25 consensus — pulled semiconductors and the broader AI trade back from what had been a technical correction a day earlier (Lam Research +14.1% on record quarterly results). The S&P 500 (yfinance ^GSPC) closed up 1.66% and the Dow closed up 1.19%.
Underneath the bounce, fixed income tells a more cautious story. The 10-Year Treasury yield has risen to 4.61% (FRED DGS10, 2026-07-28) from 4.38% a month ago, and the 10Y TIPS real yield sits at 2.41% (FRED DFII10) — a genuinely restrictive real rate. Credit markets, meanwhile, show no stress at all: US High Yield OAS at 287 bps (FRED BAMLH0A0HYM2) and Investment Grade at 81 bps (FRED BAMLC0A0CM) both sit at or below the low end of their historical normal ranges, a sign of credit-market complacency even as the VIX (18.21, FRED VIXCLS) holds in a moderate band. The combination of an equity risk premium that has turned negative for the S&P 500 (see Valuation section) and historically tight credit spreads is a combination worth watching, even on a day when headline equity indices are green across the board.
Europe closed broadly higher (Euro STOXX 600 +0.77%, CAC 40 +0.92%, DAX +0.60%) with FTSE 100 and the Swiss SMI the only laggards, both slightly negative. Asia-Pacific was more mixed: Nikkei 225 +0.71% even as the Bank of Japan's policy rate sits at its highest since 1995 following a June hike to ~1.00%; Hang Seng roughly flat (+0.20%); Shanghai Composite, ASX 200 and Kospi all closed lower. Emerging markets caught the same tech-led bid as Wall Street — the MSCI EM ETF (EEM) closed up 4.13% and South Africa (EZA) up 3.27% — while India's Nifty 50 lagged with a modest +0.28% gain.
Global Indices Snapshot
Americas
Americas data reflects the 30 Jul close.
| Index | Level | Day Chg | Day Chg % | Source |
|---|---|---|---|---|
| S&P 500 | 7,437.63 | +121.48 | +1.66% | yfinance ^GSPC |
| Nasdaq 100 | 28,106.35 | +914.04 | +3.36% | yfinance ^NDX |
| Dow Jones | 52,208.06 | +613.92 | +1.19% | yfinance ^DJI |
| Brazil IBOV | 177,158.86 | +3,273.52 | +1.88% | yfinance ^BVSP |
Europe
European data reflects today's close (30 Jul).
| Index | Level | Day Chg | Day Chg % | Source |
|---|---|---|---|---|
| Euro STOXX 600 | 649.95 | +4.94 | +0.77% | yfinance ^STOXX |
| Euro STOXX 50 | 6,344.40 | +95.56 | +1.53% | yfinance ^STOXX50E |
| CAC 40 | 8,485.64 | +77.37 | +0.92% | yfinance ^FCHI |
| DAX | 25,612.03 | +151.55 | +0.60% | yfinance ^GDAXI |
| FTSE 100 | 10,897.27 | -11.14 | -0.10% | yfinance ^FTSE |
| SMI (Swiss) | 14,392.49 | -93.61 | -0.65% | yfinance ^SSMI |
Asia-Pacific
Asia-Pacific data reflects today's close (30 Jul local time).
| Index | Level | Day Chg | Day Chg % | Source |
|---|---|---|---|---|
| Nikkei 225 | 61,867.43 | +433.24 | +0.71% | yfinance ^N225 |
| Hang Seng | 25,858.88 | +50.96 | +0.20% | yfinance ^HSI |
| Shanghai Comp | 3,804.69 | -23.78 | -0.62% | yfinance 000001.SS |
| ASX 200 | 8,967.70 | -70.90 | -0.78% | yfinance ^AXJO |
| Kospi (Korea) | 5,593.56 | -69.68 | -1.23% | yfinance ^KS11 |
Emerging Markets
| Index | Level | Day Chg % | Source |
|---|---|---|---|
| MSCI EM (EEM) | 63.59 | +4.13% | yfinance EEM |
| India Nifty 50 | 24,317.15 | +0.28% | yfinance ^NSEI |
| South Africa (EZA) | 64.11 | +3.27% | yfinance EZA |
None of the tracked indices are within ~0.5% of their all-time highs today, so no record-high language applies to any index in this snapshot.
Index Valuations & Investment Risk
Valuation Table
| Index | Trailing P/E (live) | Hist avg trailing P/E (†) | Premium/Discount |
|---|---|---|---|
| S&P 500 | 26.62x | ~16-18x | +56.6% |
| Nasdaq 100 | 30.29x | ~25-30x | +10.1% |
| Euro STOXX 600 | 18.79x | ~15-17x | +17.5% |
| CAC 40 | 17.83x | ~14-16x | +18.9% |
| DAX | 18.72x | ~15-17x | +17.0% |
| FTSE 100 | 18.20x | ~13-15x | +30.0% |
| Nikkei 225 | 20.10x | ~20-22x | -4.3% |
| MSCI EM | 16.36x | ~13-15x | +16.9% |
(†) Hist avg trailing P/E: static long-run reference constants.
Trailing P/E (live): yfinance trailingPE on ETF proxies (SPY, QQQ, EXSA.DE, CAC.PA, EXS1.DE, ISF.L, 1321.T, EEM), fetched today.
Premium/discount computed against the historical range midpoint. The S&P 500's +56.6% premium is historically stretched (>40% threshold); FTSE 100's +30.0% is elevated (>20%) — driven largely by a low-P/E historical benchmark rather than an expensive index in absolute terms. Nasdaq 100, STOXX 600, CAC 40, DAX and MSCI EM all sit in the 10-19% range — elevated but not stretched. Nikkei 225 is the only index trading below its historical average.
Investment Risk Assessment for ETF Investors
United States (S&P 500 / Nasdaq ETFs) SPY's trailing P/E of 26.62x is 56.6% above the historical ~16-18x average — historically stretched territory. Earnings yield is (1÷26.62) = 3.76%, against a 10-Year Treasury yield of 4.61% (FRED DGS10) — an Equity Risk Premium of -0.85%. A negative ERP means Treasuries currently yield more than S&P 500 earnings, historically a warning sign for forward equity returns and a signal that bonds are competitive with, or superior to, equities on a pure yield basis. QQQ's P/E of 30.29x is a smaller 10.1% premium to its own higher historical band. The S&P 500 sits 2.6% below its 52-week/all-time high of 7,620.90 and is trading above both its 50-day (7,468.10) and 200-day (7,015.51) moving averages — an intact uptrend but one now testing valuation limits. Concentration risk in mega-cap AI names (today's move driven almost entirely by Microsoft) and elevated real yields (FRED DFII10 at 2.41%) both compound the risk of a valuation-led drawdown if earnings momentum stalls.
Europe (STOXX 600 / CAC 40 / DAX ETFs) EXSA.DE's trailing P/E of 18.79x is a more modest 17.5% premium to its ~15-17x historical range. Earnings yield of (1÷18.79) = 5.32% against the German 10Y Bund yield of 3.18% (ECB YC API, 2026-07-29) gives a Euro Equity Risk Premium of +2.15% — meaningfully more attractive than the negative US ERP. European equities currently screen cheaper than the US on a P/E basis (18.79x vs 26.62x for SPY) and offer a genuine yield cushion over Bunds. Currency risk cuts both ways for non-EUR holders given EUR/USD's recent range (1.1385, FRED DEXUSEU, 2026-07-24); geopolitical and fiscal risk (see OAT-Bund spread below) remain the main offsetting concerns.
Japan (Nikkei / TOPIX ETFs) The Nikkei's proxy P/E (1321.T, 20.10x) is actually 4.3% below its historical ~20-22x range — the only index in this survey trading at a discount to its own history. The BOJ has hiked its policy rate to ~1.00% (effective 17 June 2026, the highest since 1995), with commentary suggesting a path toward a ~2% "neutral" rate over time — a genuine headwind for JPY-hedged equity holders and duration-sensitive JGB portfolios (10Y JGB yield ~2.78%, web search). Unhedged USD-based investors have also been exposed to yen weakness, with USD/JPY near 163.35 today.
Emerging Markets (MSCI EM ETFs) EEM's trailing P/E of 16.36x is a 16.9% premium to its own ~13-15x historical range, but that is still a steep discount to US large-cap multiples. Today's 4.13% EEM rally at the close tracked the US tech bounce closely, underscoring how sensitive EM flows remain to US mega-cap sentiment and the dollar. China's weight in the index remains a structural swing factor; the Shanghai Composite closed today's session down 0.62% and remains 37.9% below its 2007-era all-time high.
Overall Risk Score (qualitative, not financial advice): US large-cap — high valuation risk, low margin of safety (negative ERP, stretched P/E); Europe — moderate, more attractive relative valuation (positive ERP, lower multiples); Japan — moderate, rate-path dependent; Emerging Markets — moderate, valuation discount to DM but high beta to US tech sentiment.
Disclaimer: This is financial information, not personalised investment advice. Past valuations do not guarantee future returns. Consult a financial advisor before investing.
US Economic Indicators (FRED - authoritative)
| Indicator | Current | Prior | Delta | Reference Date | FRED Series |
|---|---|---|---|---|---|
| CPI YoY % | 3.46% | 4.17% | -0.71pp | 2026-06 | CPIAUCSL |
| Core CPI YoY % | 2.57% | 2.82% | -0.26pp | 2026-06 | CPILFESL |
| Unemployment Rate | 4.2% | 4.3% | -0.1pp | 2026-06 | UNRATE |
| Nonfarm Payrolls | 158,984k | 158,927k | +57k | 2026-06 (m/m chg) | PAYEMS |
| 10Y TIPS Real Yield | 2.41% | — | — | 2026-07-28 | DFII10 |
Note: FRED macro data is monthly and lags 4-6 weeks; the June 2026 reference month is the latest available.
Other economic releases today (from web search): the US GDP first release, Personal Income/PCE deflator, and weekly Initial Jobless Claims were all scheduled for release today (8:30am ET) alongside the Weekly Economic Index (11:30am ET). Specific actual-vs-consensus figures were not yet available.
Fixed Income & Bond Analysis
Policy Rates
| Central Bank | Rate | Source |
|---|---|---|
| Fed Funds (upper) | 3.75% | FRED DFEDTARU |
| Fed Funds (lower) | 3.50% | FRED DFEDTARL |
| Effective FFR | 3.63% | FRED DFF |
| ECB Deposit Rate | 2.25% | FRED ECBDFR |
| BOJ Policy Rate | ~1.00% | web search (hiked 25bps effective 17 Jun 2026, first time at this level since 1995) |
| BOE Bank Rate | ~3.73% (SONIA/FRED) | FRED IUDSOIA |
Government Bond Yields
| Country | 2Y Yield | 10Y Yield | 30Y Yield | Source |
|---|---|---|---|---|
| USA | 4.26% | 4.61% | 5.09% | FRED |
| Germany | 2.73% | 3.18% | 3.60% | ECB YC API (2026-07-29) |
| France | (not retrieved) | ~3.92% (stale — early Jul 2026) | (not retrieved) | web (dated) |
| UK | (not found) | 5.04% | (not retrieved) | web |
| Japan | (not retrieved) | 2.78% | (not retrieved) | web |
| Italy | (not retrieved) | ~3.90% (date uncertain — recent) | (not retrieved) | web |
Yield Curve Spreads (FRED pre-computed): - 10Y-2Y spread: +45 bps (2026-07-29) — positive and off its post-Fed-hold widening; not inverted, not yet historically steep (>75bps threshold). - 10Y-3M spread: +84 bps (2026-07-29) — also positive; no recession signal currently, consistent with a normalizing-but-not-steep curve after two years of policy tightening.
OAT-Bund Spread: Using France's most recent available OAT yield (~3.92%, dated early July — flagged as stale) against today's ECB German 10Y (3.18%), the implied spread is roughly 74 bps. A separate web source (Il Sole 24 Ore) cites the Italy-Germany BTP-Bund spread at ~81 bps with Italy's 10Y BTP around 3.90% — notably, French and Italian 10Y yields have converged to within a few basis points of each other in 2026, a reversal of their typical risk-premium ordering. Both France and Italy figures should be treated as approximate given data staleness.
Yield Curve Charts
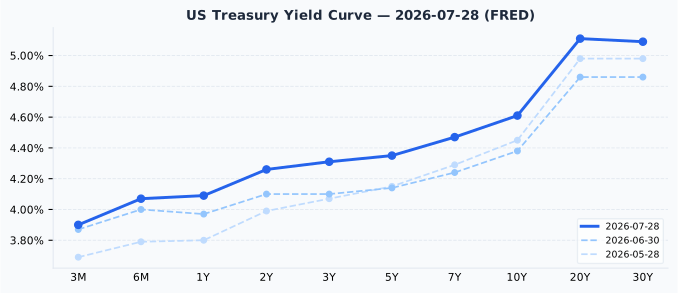
The US curve is upward-sloping across its full length with no inversion, rising steadily from 3.90% at 3-months to 5.11% at 20-years before flattening slightly into the 30-year (5.09%). Versus one month ago (30 Jun), the entire curve has shifted higher by roughly 20-25 bps at the front end and 23-25 bps at 10Y+, consistent with the market re-pricing a more hawkish Fed after this week's hold.
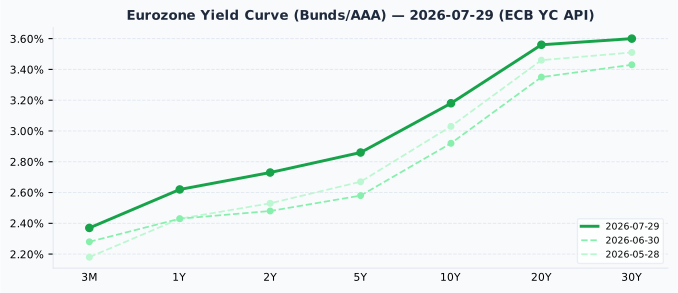
The Eurozone (AAA) curve is also upward-sloping throughout, from 2.37% at 3-months to 3.60% at 30-years, with no inversion. Versus one month ago (30 Jun), the curve has risen roughly 9-26 bps across maturities, led by the belly and long end (10Y +26bps, 20Y +21bps) — a smaller but directionally similar shift to the US curve.
Credit Markets (from FRED — authoritative)
| Market | OAS Spread | Series ID |
|---|---|---|
| US Investment Grade | 81 bps | BAMLC0A0CM |
| US High Yield | 287 bps | BAMLH0A0HYM2 |
| Euro High Yield | 264 bps | BAMLHE00EHYIOAS |
US High Yield spreads at 287 bps sit below the typical 300-500 bps "normal" range, and US Investment Grade at 81 bps is at the tight end of its 80-150 bps normal band — both readings point to a historically tight, complacent credit market rather than any sign of stress, even after this week's equity volatility.
Bond Portfolio Implications
The US Equity Risk Premium is negative (-0.85%, computed above), historically a signal favoring bonds over equities on a risk-adjusted basis, while the Euro ERP remains positive (+2.15%). With the 10Y Treasury at 4.61% and real yields (DFII10) at 2.41%, government bonds now offer a genuine income alternative to equities for the first time in this valuation cycle for US-focused portfolios — though duration risk remains real: a 100 bps rise in yields would still imply roughly an 8-9% price loss on a 10-year bond. Given the current environment of rising nominal yields post-Fed, shorter-duration positioning remains the more defensive choice within fixed income, even as the income argument for bonds strengthens overall.
Currencies & Commodities
Currencies:
| Pair | Rate | Source |
|---|---|---|
| EUR/USD | 1.1385 | FRED DEXUSEU (2026-07-24) |
| USD Index | 120.71 | FRED DTWEXBGS (2026-07-24) |
| USD/JPY | 163.35 | web search (today) |
| GBP/USD | 1.3342 | web search (today) |
| USD/CHF | 0.8061 | web search (latest available, may lag slightly) |
Note: FRED's EUR/USD and broad dollar index observations lag to 24 Jul (weekend/reporting gap); a separately-reported ICE Dollar Index (DXY, a differently-composed measure) was cited today at ~101.87, falling on the Fed's rate hold — this is a distinct index from FRED's DTWEXBGS and the two should not be compared directly.
Commodities (all from yfinance MCP front-month futures):
| Commodity | Price | Day Chg % | Ticker | Source |
|---|---|---|---|---|
| Brent Crude | $89.03 | -1.88% | BZ=F | yfinance |
| WTI Crude | $83.59 | -1.03% | CL=F | yfinance |
| Gold ($/oz) | $4,160.60 | +1.55% | GC=F | yfinance |
| Silver ($/oz) | $59.02 | +1.60% | SI=F | yfinance |
| Copper ($/lb) | $6.4755 | +2.60% | HG=F | yfinance |
| Nat Gas ($/MMBtu) | $2.758 | +1.32% | NG=F | yfinance |
Gold at $4,160.60/oz closed 25.5% below its all-time high of $5,586.20 (which was also this week's 52-week high) — a meaningful pullback from the recent peak, not "near highs" language. Silver at $59.02/oz closed 51.3% below its all-time high of $121.30 (also its 52-week high) — a very large retracement from the recent record. WTI and Brent remain deeply discounted to their 2008-era highs (43.2% and 39.6% below ATH respectively), driven by supply dynamics rather than any recent shock. Copper at $6.48/lb is only 2.7% below its all-time high of $6.6525 — slightly below record levels, the tightest of the commodity group. Natural gas at $2.758/MMBtu is far below its distant historical spike high but sits within its own 52-week range ($2.48-$7.83).
Sector & Theme Highlights
Mega-cap technology and semiconductors are today's clear standout, with Microsoft's cloud beat and a broad AI-trade rebound (Lam Research +14.1%) reversing yesterday's Fed-driven sell-off. M&A activity is active: Intercontinental Exchange's $5.7bn all-cash acquisition of MarketAxess sent MKTX shares up nearly 30% premarket, a reminder that risk appetite for dealmaking remains intact even amid rate uncertainty. Conversely, Meta Platforms slid on disappointing revenue guidance and biotech name Alnylam Pharmaceuticals fell over 21% on a revenue miss and weak full-year guidance — a reminder that today's rally is narrow and stock-specific rather than universally broad-based. Precious metals (gold, silver) continue to see buying interest even after their pullback from record highs, while credit markets show no sign of the volatility playing out in equities.
Top Stories (Global)
- Microsoft (MSFT) surges on a blowout quarter: Azure/cloud growth at its fastest pace in four years, revenue +17% YoY (constant currency), EPS of $4.74 beating ~$4.25 consensus — the single biggest driver of today's tech rally.
- Nasdaq 100 rebounds 3.4% at the close, a day after entering a technical correction, as semiconductor names snap back; Lam Research (LRCX) +14.1% on record quarterly revenue and earnings.
- US Q2 GDP advance estimate came in at +1.5% annualized, with consumer spending, investment and exports partly offset by a decline in government spending; weekly initial jobless claims printed 197K versus 200K expected; June core PCE inflation ran 3.3% YoY, in line with consensus (BEA, web search).
- Fed holds rates steady at 3.50-3.75% (hawkish tone), having triggered Wednesday's >1,100-point Dow decline and a jump in Treasury yields across the curve.
- ICE to acquire MarketAxess in a $5.7bn all-cash deal; MKTX shares jumped nearly 30% in premarket trading.
- Meta Platforms slides on a disappointing quarterly revenue forecast, one of the few large-cap decliners today.
- Alnylam Pharmaceuticals tumbles 21% after missing revenue expectations and cutting full-year guidance.
- BOJ's policy rate sits near 1.00%, its highest since 1995, following a 25bp hike effective 17 June 2026; further hikes toward a ~2% "neutral" rate have been flagged by BOJ officials.
- Jersey Mike's debuts on the NYSE, opening below its $23 IPO price before partially recovering to trade around a 3.5% discount to issue price.
Looking Ahead
Key items over the next 1-5 trading days and beyond:
- Earnings season remains in full swing following Microsoft's report; more mega-cap and semiconductor names are likely on deck in the days ahead.
- BOJ policy path: commentary continues to point toward further hikes from the current ~1.00% rate toward a ~2% neutral level over time — a multi-quarter theme for JPY and JGB positioning, not a single-day catalyst.
- Market closures (Nager.Date holiday calendar): Swiss National Day — Switzerland closed 1 Aug 2026; Mountain Day — Japan closed 11 Aug 2026; Assumption Day — France closed 15 Aug 2026; Liberation Day — South Korea closed 17 Aug 2026; Summer Bank Holiday — UK closed 31 Aug 2026. (India's 2026 holiday calendar was not available.)