2026 07 23
Global Financial Briefing — Thursday, 23 July 2026
Market Overview
Markets are firmly risk-off today, driven by a sharp escalation in the Iran conflict that has sent oil prices surging — Brent crude has pushed above $100/bbl for the first time in months, with WTI up roughly 6.9% and Brent up roughly 7.7% intraday. The oil shock is feeding directly into the rates market: US Treasury yields are at their highest levels of the year, with the 10-Year at 4.63% (FRED DGS10, 2026-07-21) and the 30-Year above 5.1%, as investors price in renewed inflation risk from higher energy costs. Gold, which would normally act as a safe haven in a geopolitical shock, is instead down roughly 2-2.6% today — a sign that rising real yields and inflation-hedging flows into the dollar/energy complex are currently dominating over safe-haven demand.
US equities are leading the developed-market selloff intraday: the S&P 500 is down about 1.4% and the Nasdaq 100 down about 2.0-2.3%, compounded by a separate, idiosyncratic shock from Big Tech earnings — Alphabet fell roughly 6.5% after raising its AI capital-spending forecast, and Tesla dropped roughly 14% on a profit miss despite strong EV deliveries. That combination (oil shock + AI-capex anxiety) is a double-barreled risk-off catalyst rarely seen on the same day. European indices are down in sympathy (STOXX 600 -1.2%, DAX -1.6%, CAC 40 -1.6%), while Asia-Pacific, whose local sessions closed before the worst of the oil/equity news broke, is mostly higher — the Nikkei, Hang Seng, and notably South Korea's Kospi (+4.4%) all closed in positive territory. That regional divergence is a timing effect as much as a sentiment one: Asia's session ended before the full extent of today's Western risk-off move was priced in.
Credit markets have not yet caught up to the equity story: US Investment Grade OAS is 78 bps and US High Yield OAS is 268 bps (both from FRED, as of 2026-07-22 close) — both at the tight end of, or below, their historical normal ranges, suggesting credit investors were not yet pricing meaningful stress heading into today's escalation. That divergence between equity volatility and still-tight credit spreads is worth monitoring; a genuine risk-off regime typically sees credit spreads widen alongside equity drawdowns. The VIX, at 16.64 (FRED VIXCLS, 2026-07-22 close), sits in the low-to-moderate range and — importantly — predates today's session, so it does not yet reflect the intraday equity drop or the oil shock; a same-day VIX reading is not available from FRED given its one-day publication lag.
Global Indices Snapshot
Note: US and Brazil markets are still in regular session (data captured intraday, ~14:27 ET); other regions reflect today's local close.
Americas
| Index | Level | Day Chg | Day Chg % | Source |
|---|---|---|---|---|
| S&P 500 | 7,396.28 | -102.68 | -1.37% | yfinance ^GSPC |
| Nasdaq 100 | 28,403.90 | -594.20 | -2.05% | yfinance ^NDX |
| Dow Jones | 51,626.76 | -591.82 | -1.13% | yfinance ^DJI |
| Brazil IBOV | 176,420.30 | -1,127.27 | -0.64% | yfinance ^BVSP |
Europe
| Index | Level | Day Chg | Day Chg % | Source |
|---|---|---|---|---|
| Euro STOXX 600 | 639.27 | -7.66 | -1.18% | yfinance ^STOXX |
| CAC 40 | 8,299.09 | -138.80 | -1.64% | yfinance ^FCHI |
| DAX | 24,763.12 | -392.29 | -1.56% | yfinance ^GDAXI |
| FTSE 100 | 10,639.17 | -77.80 | -0.73% | yfinance ^FTSE |
| SMI (Swiss) | 14,214.95 | -100.93 | -0.71% | yfinance ^SSMI |
European data reflects today's close (23 Jul).
Asia-Pacific
| Index | Level | Day Chg | Day Chg % | Source |
|---|---|---|---|---|
| Nikkei 225 | 66,422.60 | +307.00 | +0.46% | yfinance ^N225 |
| Hang Seng | 25,210.81 | +318.15 | +1.28% | yfinance ^HSI |
| Shanghai Comp | 3,876.78 | +9.74 | +0.25% | yfinance 000001.SS |
| ASX 200 | 8,839.00 | +16.00 | +0.18% | yfinance ^AXJO |
| Kospi (Korea) | 7,096.89 | +299.19 | +4.40% | yfinance ^KS11 |
Asia-Pacific data reflects today's close (23 Jul). Kospi's outsized gain is notably large relative to regional peers; the specific single-day catalyst was not confirmed in available sources — treat as a data point pending confirmation, not an established narrative.
Emerging Markets
| Index | Level | Day Chg % | Source |
|---|---|---|---|
| MSCI EM (EEM) | 64.45 | -0.83% | yfinance EEM |
| India Nifty 50 | 23,869.60 | -0.53% | yfinance ^NSEI |
| South Africa (EZA) | 60.45 | -4.02% | yfinance EZA |
Index Valuations & Investment Risk
Valuation Table
| Index | Trailing P/E (live) | Hist avg trailing P/E (†) | Premium/discount |
|---|---|---|---|
| S&P 500 | 26.52x | ~16-18x | +56% |
| Nasdaq 100 | 30.66x | ~25-30x | +11% |
| Euro STOXX 600 | 18.47x | ~15-17x | +15% |
| CAC 40 | 17.45x | ~14-16x | +16% |
| DAX | 18.09x | ~15-17x | +13% |
| FTSE 100 | 17.78x | ~13-15x | +27% |
| Nikkei 225 | 21.55x | ~20-22x | +3% |
| MSCI EM | 16.61x | ~13-15x | +19% |
(†) Hist avg trailing P/E: static long-run reference constants.
Trailing P/E (live): sourced from yfinance trailingPE on ETF proxies (SPY, QQQ, EXSA.DE, CAC.PA, EXS1.DE, ISF.L, 1321.T, EEM). Premium/discount computed vs the historical-average midpoint; bolded where >20%.
Historical reference benchmarks (†): - S&P 500 long-run avg trailing P/E: ~16-18x; Shiller CAPE long-run avg: ~17x - Euro STOXX 600 long-run avg: ~15-17x; MSCI EM long-run avg: ~13-15x - >20% premium to historical avg = elevated; >40% = historically stretched
Investment Risk Assessment for ETF Investors
United States (S&P 500 / Nasdaq ETFs)
SPY's trailing P/E of 26.52x sits 56% above the ~16-18x historical range — historically stretched territory. Earnings yield is (1÷26.52) = 3.77%, which against the 10Y Treasury yield of 4.63% (FRED DGS10, 2026-07-21) produces an Equity Risk Premium of -0.86% — negative, meaning bonds currently yield more than the earnings yield on US large-cap equities. That's a classic warning signal for forward equity returns and is compounded today by the fact that yields themselves are rising on the oil/inflation shock (FRED DFII10 real yield 2.37%, implying ~2.26 points of breakeven inflation expectation baked into the 10Y). QQQ's premium is more modest (+11% vs its higher historical band) but concentration risk in a handful of mega-cap AI names remains elevated, as illustrated today by Alphabet's capex-driven 6.5% drop. The S&P 500 (7,396.28) is roughly 3% below its all-time high of 7,620.90 — not a "near highs" situation after today's drop, though it was close before this session. 50-day MA (7,471.88) has now been breached to the downside; 200-day MA (6,998.91) remains well below current levels.
Europe (STOXX 600 / CAC 40 / DAX ETFs)
EXSA.DE trailing P/E of 18.47x is a more moderate 15% above its ~15-17x historical range. Earnings yield of (1÷18.47) = 5.41% against the German 10Y Bund yield of 3.15% (web search, 2026-07-22) gives a Euro Area ERP of roughly +2.26% — a comfortable positive cushion, in contrast to the negative US ERP. European valuations remain the relatively cheaper developed-market option on this metric, though currency risk for non-EUR investors (EUR/USD 1.144, FRED DEXUSEU) and elevated European sovereign spreads (France 10Y ~3.93%, Italy 10Y ~3.90%, both above the German Bund) are live risks, particularly given ongoing French fiscal-risk headlines.
Japan (Nikkei / TOPIX ETFs)
1321.T trailing P/E of 21.55x is only 3% above its historical range — Japanese equities screen as fair value on this metric. The bigger live risk is the Bank of Japan's tightening path: the BOJ hiked its policy rate to 1.00% on 16 June 2026 (first time at that level since 1995), and Japan's 10Y JGB yield has climbed to 2.76% with the 2Y at a 31-year high of 1.49% — both signal markets pricing further hikes, which raises both currency-hedge costs and the discount rate applied to Japanese equities. JPY remains weak (USD/JPY ~163.4) despite the tightening, an unusual combination worth watching.
Emerging Markets (MSCI EM ETFs)
EEM trailing P/E of 16.61x is 19% above its historical range, just under the +20% elevated threshold. EM remains a valuation discount to US large-caps but not to Europe. South Africa (EZA) fell a sharp 4.0% today, notably worse than the broader EM complex — likely tied to the same commodity-price volatility (SA's index is commodity-heavy) rather than a standalone EM story.
Overall Risk Score (qualitative, not financial advice): High valuation risk / low margin of safety for US large-cap ETFs given the negative ERP and 56% P/E premium; Moderate for Europe, Japan, and EM, where valuations are closer to historical norms and (in Europe's case) the earnings yield still clears the local risk-free rate by a healthy margin.
Disclaimer: This is financial information, not personalised investment advice. Past valuations do not guarantee future returns. Consult a financial advisor before investing.
US Economic Indicators (FRED - authoritative)
| Indicator | Current | Prior | Delta | Reference Date | FRED Series |
|---|---|---|---|---|---|
| CPI YoY % | 3.46% | 4.17% | -0.71pp | 2026-06 | CPIAUCSL |
| Core CPI YoY % | 2.57% | 2.82% | -0.26pp | 2026-06 | CPILFESL |
| Unemployment Rate | 4.2% | 4.3% | -0.1pp | 2026-06 | UNRATE |
| Nonfarm Payrolls | 158,984k | 158,927k | +57k | 2026-06 | PAYEMS |
| 10Y TIPS Real Yield | 2.37% | — | — | 2026-07-21 | DFII10 |
Note: FRED macro data is monthly and typically lags 4-6 weeks; the June 2026 reference month is the latest available. Headline CPI YoY eased from May's 4.17% to 3.46% in June, though it remains above the Fed's 2% target — today's oil spike is a fresh upside risk to the next CPI print, not yet reflected in this data.
Other economic releases today (from web search): Thursday, 23 July is a relatively light US data day — weekly initial jobless claims and new home sales are the scheduled releases; no PMI, GDP, or PPI prints are due today. No major surprise data was identified for other economies today.
Fixed Income & Bond Analysis
All US Treasury yields from FRED. European/UK/Japan yields from web search (ECB API unavailable today — see note below).
Policy Rates
| Central Bank | Rate | Source |
|---|---|---|
| Fed Funds (upper) | 3.75% | FRED DFEDTARU |
| Fed Funds (lower) | 3.50% | FRED DFEDTARL |
| Effective FFR | 3.63% | FRED DFF |
| ECB Deposit Rate | 2.25% | FRED ECBDFR |
| BOJ Policy Rate | 1.00% | web search (effective 2026-06-17) |
| BOE Bank Rate | ~3.73% | FRED IUDSOIA (SONIA proxy) |
Government Bond Yields
| Country | 2Y Yield | 10Y Yield | 30Y Yield | Day Chg (10Y) | Source |
|---|---|---|---|---|---|
| USA | 4.26% | 4.63% | 5.13% | +3bps (2026-07-21 vs 07-20) | FRED |
| Germany | ~2.80%* | 3.15% | (not retrieved) | — | web |
| France | (not retrieved) | 3.93%* | (not retrieved) | — | web |
| UK | (not retrieved) | 5.10% | (not retrieved) | — | web |
| Japan | 1.49% | 2.76% | (not retrieved) | — | web |
| Italy | (not retrieved) | 3.90%* | (not retrieved) | — | web |
*Germany 2Y, France 10Y, and Italy 10Y figures are from slightly earlier in July 2026 (exact date not pinned down in search results) — treat as approximate/directional, not precise same-day marks.
⚠️ ECB Yield Curve API note: The ECB's yield curve API (data-api.ecb.europa.eu) was unavailable today. The full Eurozone AAA curve chart is therefore omitted; the German/French/Italian points above come from web search only, and should be treated as directionally indicative rather than precision marks.
Yield Curve Spreads (FRED pre-computed): - 10Y-2Y spread: +36 bps (FRED T10Y2Y, 2026-07-22) — positive and outside the ±25bps "flat" band, but well short of a historically steep curve (>75bps). The curve has normalized from its post-2022 inversion but isn't signaling strong growth optimism either. - 10Y-3M spread: +78 bps (FRED T10Y3M, 2026-07-22) — solidly positive; this spread (the more reliable recession predictor of the two) shows no inversion signal currently.
OAT-Bund Spread: approximately 78 bps (computed from France 10Y ~3.93% minus Germany 10Y 3.15%; dates not perfectly aligned — see caveat above). Italy-Germany spread was reported at 81 bps in early July. Both remain a key European fiscal-risk indicator to watch, especially with French political/fiscal headlines ongoing.
Yield Curve Chart
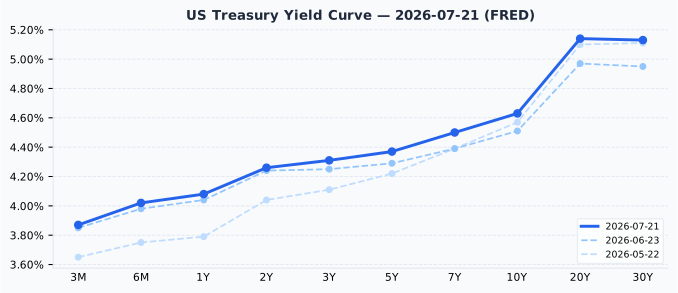
The curve is upward-sloping across its full length with a modest hump at the very long end (20Y slightly above 30Y), consistent with a "normal" but not steep shape. Versus one month ago (23 Jun 2026) and two months ago (22 May 2026), the entire curve has shifted higher — the 10Y is up roughly 12bps from a month ago and 6bps from two months ago, while the front end (3M) has risen more, by about 2bps and 22bps respectively — reflecting both the still-elevated Fed funds rate and today's oil-driven inflation repricing.
Eurozone chart omitted today: the ECB YC API was unavailable (see note above).
Credit Markets (from FRED — authoritative)
| Market | OAS Spread | Series ID |
|---|---|---|
| US Investment Grade | 78 bps | BAMLC0A0CM |
| US High Yield | 268 bps | BAMLH0A0HYM2 |
| Euro High Yield | 248 bps | BAMLHE00EHYIOAS |
Both US IG (78bps, at/below the ~80-150bps normal range) and US HY (268bps, below the ~300-500bps normal range) are historically tight, signaling credit markets have not yet priced meaningful stress — a notable divergence from today's sharp equity selloff. Euro HY (248bps) is similarly tight. This gap between jittery equities and complacent credit is worth monitoring; if the Iran/oil situation escalates further, credit spreads would be the next place to watch for confirmation of genuine risk-off conditions.
Bond Portfolio Implications
With the S&P 500's ERP at -0.86%, Treasuries are currently offering a higher income yield than the earnings yield on US large-cap equities — a signal that has historically preceded periods of below-average forward equity returns, though it is not a precise timing tool. The 10Y real yield (DFII10) of 2.37% is elevated by recent-cycle standards, and today's oil-driven inflation scare is pushing nominal yields higher still. For fixed income investors, duration risk is a live concern: a further 100bps rise in yields would imply roughly an 8-9% price loss on a 10-year Treasury. Given yields are already at their highest levels of the year and could move further if the Iran conflict escalates, shorter-duration positioning currently offers a more favorable risk/reward than reaching for long-duration yield, even though the long end (30Y at 5.13%) looks attractive on an absolute-income basis for buy-and-hold investors.
Currencies & Commodities
Currencies:
| Pair | Rate | Source |
|---|---|---|
| EUR/USD | 1.1440 | FRED DEXUSEU (2026-07-17) |
| USD Index | 120.53 | FRED DTWEXBGS (2026-07-17) |
| USD/JPY | 163.37 | web search (2026-07-23) |
| GBP/USD | 1.3368 | web search (2026-07-23) |
| USD/CHF | 0.8148 | web search (2026-07-23) |
Note: FRED's EUR/USD and USD Index series lag to 2026-07-17 (6 days stale) — their standard publication cadence. USD/JPY, GBP/USD, and USD/CHF are same-day web figures.
Commodities (all from yfinance front-month futures):
| Commodity | Price | Day Chg % | Ticker | Source |
|---|---|---|---|---|
| Brent Crude | $101.29 | +7.68% | BZ=F | yfinance |
| WTI Crude | $92.79 | +6.86% | CL=F | yfinance |
| Gold ($/oz) | $4,045.50 | -2.56% | GC=F | yfinance |
| Silver ($/oz) | $57.74 | -4.24% | SI=F | yfinance |
| Copper ($/lb) | $6.32 | -2.73% | HG=F | yfinance |
| Nat Gas ($/MMBtu) | $2.92 | +0.62% | NG=F | yfinance |
Oil is the story of the day: both WTI and Brent are up roughly 7% intraday on the Iran escalation, with Brent crossing $100/bbl. Both remain well below their respective all-time highs, however — WTI at $92.79 is 37.0% below its ATH of $147.27, and Brent at $101.29 is 31.3% below its ATH of $147.43 — so today's spike, while sharp, is a move within a still-well-below-record range, not a record-threatening one.
Gold, at $4,045.50, is 27.6% below its all-time high of $5,586.20 and fell 2.6% today — an unusual reaction for a geopolitical shock day, suggesting rising real yields and inflation-hedge flows into oil/dollar assets are currently outweighing gold's traditional safe-haven bid. Silver ($57.74) is 52.4% below its ATH of $121.30 and fell 4.2% today, moving in the same direction as gold. Copper ($6.32/lb) is 5.1% below its ATH of $6.65 and down 2.7% today, reflecting demand-side growth concerns rather than the supply-side story driving oil.
Crypto: No notable (>3%) moves identified in available sources today; omitted.
Sector & Theme Highlights
Energy is today's standout sector, tracking the oil price surge, while Technology/AI-adjacent names are under pressure following Alphabet's capex-driven drop and broader concern about the payoff timeline on massive AI infrastructure spending. Consumer/retail took an idiosyncratic hit from Albertsons' earnings miss. The cross-market theme to watch: an oil-driven inflation scare arriving at the same time as AI-capex anxiety is a genuinely unusual combination — it pressures both the "growth" trade (higher discount rates, capex concerns) and the "value/cyclical" trade (inflation risk) simultaneously, which helps explain the breadth of today's equity weakness across both the S&P 500 and Nasdaq.
Top Stories (Global)
- Iran conflict escalation sends oil above $100/bbl (Brent) — the dominant macro catalyst today, pushing Treasury yields to their highest levels of the year and triggering a broad risk-off move in equities.
- Alphabet falls ~6.5% after raising its AI capital-expenditure forecast, reviving investor anxiety about returns on massive AI infrastructure spending.
- Tesla drops ~14% on a profit miss despite reporting strong EV delivery numbers — a reminder that margin compression, not volume, is the current concern for the stock.
- Albertsons shares fall ~22% after Q1 adjusted EPS of $0.42 missed the $0.54 consensus.
- BOJ's June rate hike to 1.00% continues to ripple through JGB markets — the 2Y JGB yield hit a 31-year high of 1.49% as markets price further tightening.
- Gold falls despite geopolitical shock — a notable divergence from the traditional safe-haven playbook, with rising real yields and inflation-hedge flows into oil apparently dominating today's gold price action.
- Credit spreads remain historically tight (US IG 78bps, US HY 268bps) even as equities sell off sharply — a divergence worth watching for signs of catch-up widening if the Iran situation escalates further.
Looking Ahead
Key events in the next 1-5 trading days:
- US data: Weekly initial jobless claims and new home sales are due this week (light calendar otherwise); markets will be watching for any CPI-adjacent commentary given today's oil spike.
- Geopolitical: The Iran conflict and its impact on oil supply is the key swing factor for markets over the coming days — further escalation would likely extend today's risk-off move; any de-escalation or ceasefire signals would be a significant relief catalyst.
- Central banks: BOJ officials have signaled scope for further rate hikes beyond June's move to 1.00%; JGB market pricing suggests investors are already anticipating this.
- Earnings season: Continues in full swing following today's high-profile Alphabet and Tesla reports; more mega-cap earnings are likely in the coming days.
- Market closures (next 5 upcoming, from holiday calendar):
- 1 Aug 2026 — Switzerland: Bundesfeier (Swiss National Day)
- 11 Aug 2026 — Japan: Mountain Day (山の日)
- 15 Aug 2026 — France: Assomption
- 17 Aug 2026 — South Korea: Liberation Day (광복절)
- 31 Aug 2026 — UK: Summer Bank Holiday