2026 09 01
Global Financial Briefing — Tuesday, 1 September 2026
Americas index levels, the US-listed ETF rows (EEM, EZA) and every day change attached to them reflect the 1 September closing print. The US Treasury par and real curves, the curve spreads and the US yield curve chart use Treasury's settled 1 September session. The six commodity rows are the last trade of the 1 September session rather than the exchange settlement, which was not yet available; the basis line under that table says so. Currencies, the VIX, credit spreads, monthly macro releases, policy rates, the euro area bond rows and the ECB yield curve chart are dated inline.
Market Overview
September opened on a single, coherent risk-off impulse: renewed US-Iran hostilities in the Strait of Hormuz, including an overnight attack on a cargo ship, rebuilt an oil risk premium that had been draining away all summer. The move built through the afternoon rather than fading: WTI ended the session 5.74% higher at $90.68 and Brent 5.23% higher at $95.22, roughly half again the gains visible at midday. It propagated straight into the rates market as an inflation shock rather than a growth shock. That distinction matters, because it explains why bonds sold off alongside equities instead of catching a flight-to-quality bid: when the shock is to the price level, the long end has no reason to rally.
The bond leg was the day's real story. Gilts led a global government bond selloff, with the UK 30-year reaching 5.87%, its highest since May 1998, and the 10-year at 5.21%. Part of that is catch-up rather than fresh news: the UK was shut on Monday for the Summer Bank Holiday, so 1 September absorbed two sessions of repricing at once. Treasuries followed in sympathy, and the settled par curve now shows where the move actually landed: the 10-year at 4.79%, up 4 bp on the day, and the 30-year at 5.27%, up only 2 bp. The belly led, with the 3-year and 5-year both up 6 bp and the 2-year up 5 bp, while the 3-month rose a single basis point. That shape is the market pricing policy rather than term premium, which is what an inflation shock should do to a curve. The settled 3-month par yield of 3.92% now sits about 30 bp above the Fed funds midpoint of 3.625%, a spread that only makes sense if hikes are being priced.
Equities took it in the order you would expect, and the selling accelerated into the close rather than stabilising. Tech bore the brunt: the Nasdaq 100 finished down 1.29%, nearly twice the S&P 500's 0.71%, with chip names worst hit, since long-duration equity is the most sensitive to a repricing of discount rates. Europe was uniformly softer, the DAX down 1.10% and the STOXX 600 down 0.56%, with the Swiss SMI the sole gainer at +0.34% on its defensive pharma weighting. Two divergences are worth flagging. Brazil's Ibovespa rose 1.30%, the day's strongest major index, a commodity exporter monetising the very shock that hurt everyone else. And the precious metals fell hard, gold down 2.36% to $4,375.70 and silver down 3.48%, despite the geopolitical escalation. The intraday reading of that was a real-rate story, and the settled data does not support it: the 10-year TIPS yield was unchanged on the day at 2.44%, and the entire 4 bp rise in the nominal 10-year came through the breakeven, which widened from 2.31% to 2.35%. A pure inflation-expectations move is not an obvious reason for gold to fall, so the metals' decline is left unexplained by anything in the rates complex, and this briefing has no same-day dollar or positioning data to test the alternatives against. Worth flagging as an open question rather than smoothing over.
One caveat on measuring the fear in this session: the VIX stood at 14.92 (FRED VIXCLS, 2026-08-31), a low reading consistent with complacency rather than stress, but that is yesterday's close and therefore predates the entire move described above. The same applies to every credit spread quoted later in this briefing. Today's volatility print is not yet available from FRED, so the honest statement is that the risk-off tone is visible in prices but not yet confirmed by any volatility or credit gauge.
Global Indices Snapshot
Americas
| Index | Level | Day Chg | Day Chg % | Source |
|---|---|---|---|---|
| S&P 500 | 7,631.47 | -54.67 | -0.71% | yfinance ^GSPC |
| Nasdaq 100 | 29,077.22 | -379.75 | -1.29% | yfinance ^NDX |
| Dow Jones | 52,766.88 | -419.02 | -0.79% | yfinance ^DJI |
| Brazil IBOV | 179,722.48 | +2,303.70 | +1.30% | yfinance ^BVSP |
Americas data reflects the 1 Sep close. FRED's own SP500 series had not yet published its 1 September observation, so no authoritative cross-check on the S&P level was available.
Europe
| Index | Level | Day Chg | Day Chg % | Source |
|---|---|---|---|---|
| Euro STOXX 600 | 647.46 | -3.64 | -0.56% | yfinance ^STOXX |
| Euro STOXX 50 | 6,368.98 | -51.18 | -0.80% | yfinance ^STOXX50E |
| CAC 40 | 8,301.85 | -32.65 | -0.39% | yfinance ^FCHI |
| DAX | 25,970.11 | -288.00 | -1.10% | yfinance ^GDAXI |
| FTSE 100 | 10,789.28 | -34.98 | -0.32% | yfinance ^FTSE |
| SMI (Swiss) | 14,334.79 | +48.36 | +0.34% | yfinance ^SSMI |
European data reflects today's close (1 Sep).
Asia-Pacific
| Index | Level | Day Chg | Day Chg % | Source |
|---|---|---|---|---|
| Nikkei 225 | 66,215.34 | -96.59 | -0.15% | yfinance ^N225 |
| Hang Seng | 25,329.73 | -237.26 | -0.93% | yfinance ^HSI |
| Shanghai Comp | 3,979.89 | -6.41 | -0.16% | yfinance 000001.SS |
| ASX 200 | 9,066.70 | -9.30 | -0.10% | yfinance ^AXJO |
| Kospi (Korea) | 6,835.80 | +15.78 | +0.23% | yfinance ^KS11 |
Asia-Pacific data reflects today's close (1 Sep). Local time in those markets has already rolled to 2 September, whose session had not opened at the time of capture.
Emerging Markets
| Index | Level | Day Chg % | Source |
|---|---|---|---|
| MSCI EM (EEM) | 66.77 | -0.37% | yfinance EEM |
| India Nifty 50 | 24,055.80 | -0.10% | yfinance ^NSEI |
| South Africa | 69.54 | -1.36% | yfinance EZA |
EEM and EZA are USD-denominated US-listed ETFs and reflect the 1 Sep NYSE close. EEM in particular reversed: it was fractionally positive at midday and finished down 0.37%.
A note on the underlying data: for six indices (CAC 40, DAX, SMI, Shanghai, ASX 200, Nifty 50) yfinance returned a previousClose field still holding the 28 August close rather than the 31 August one, while the day change and percentage were correctly measured against 31 August. A separate check against the 31 August closes confirms they match the implied prior in every case, so the day changes above stand as reported. No index is within 0.5% of its all-time high today, so no record-high language applies anywhere in this briefing.
Index Valuations & Investment Risk
Valuation Table
| Index | Trailing P/E (live) | Hist avg trailing P/E (†) | Premium to hist avg |
|---|---|---|---|
| S&P 500 | 25.69x | ~16-18x | +51.1% |
| Nasdaq 100 | 30.31x | ~25-30x | +10.2% |
| Euro STOXX 600 | 17.86x | ~15-17x | +11.7% |
| CAC 40 | 17.02x | ~14-16x | +13.5% |
| DAX | 18.79x | ~15-17x | +17.5% |
| FTSE 100 | 18.14x | ~13-15x | +29.6% |
| Nikkei 225 | 22.28x | ~20-22x | +6.1% |
| MSCI EM | 17.40x | ~13-15x | +24.3% |
(†) Static long-run reference constants, the only non-live figures in this
briefing. Live trailing P/E from yfinance trailingPE on ETF proxies (SPY, QQQ, EXSA.DE, CAC.PA,
EXS1.DE, ISF.L, 1321.T, EEM). Premium computed against the midpoint of the historical range. These
multiples were checked against the 1 September closes: the largest change was EEM's, at 0.4%, and
no row moved by 1% or more.
Three indices sit more than 20% above their long-run average trailing multiple, and the S&P 500's 51% premium is the standout. The Nasdaq 100's modest 10% premium is an artefact of the comparison, not a sign of cheapness: its historical band is already elevated, so a 30x multiple against a 25-30x reference flatters it relative to the S&P's 25.7x against 16-18x.
Investment Risk Assessment for ETF Investors
United States (S&P 500 / Nasdaq ETFs)
The S&P 500 trades at 25.69x trailing earnings, an earnings yield of 3.89% (1÷25.69). Against the 10-year Treasury at 4.79% (US Treasury par curve, 2026-09-01), the earnings yield gap is -0.90 pp: bonds currently offer more income than equities do. On the real-yield basis, which corrects for the fact that earnings grow with inflation while a coupon does not, the gap is +1.45 pp against DFII10 at 2.44%. That correction is worth 2.35 pp and flips the sign, which is precisely why the nominal version should not be read on its own. The Nasdaq 100 is starker: a 3.30% earnings yield gives a nominal gap of -1.49 pp.
The index closed 2.37% below its all-time high, above both its 50-day (7,567) and 200-day (7,123) moving averages, so the trend is intact. The Nasdaq 100, by contrast, has slipped below its 50-day (29,251) while holding the 200-day (26,945). Concentration risk in the US mega-cap complex remains the dominant single-name exposure, and the session demonstrated the sensitivity that comes with it: a 4 bp move in the nominal 10-year, with no change in the real yield behind it, was enough to take 1.29% off the index.
Europe (STOXX 600 / CAC 40 / DAX ETFs)
The STOXX 600 at 17.86x yields 5.60% (1÷17.86). Against the euro area AAA 10-year at 3.34% (ECB YC API, 2026-08-31), the euro earnings yield gap is +2.26 pp, and on the real basis (euro real 10Y of 1.30%) it is +4.29 pp. Both are substantially wider than the US equivalents.
That comparison needs a caveat. Part of the US-Europe difference is simply the gap between the two regions' inflation and policy paths rather than a difference in risk compensation, which is why the real-yield version is quoted alongside. Even so, the direction survives the correction: European equities offer more current income relative to their own bond market than US equities do relative to theirs, on both nominal and real measures.
The CAC 40 is the weaker technical picture in the region, sitting below its 50-day (8,462) and only 0.9% above its 200-day (8,230), and 5.18% below its all-time high. French fiscal risk remains the live idiosyncratic exposure, with the OAT-Bund spread at roughly 83 bp. Note also that French and Italian 10-year yields have converged to essentially the same level, around 4.17%, a spread near zero that is among the tightest in two decades and says more about French risk repricing upward than Italian risk repricing downward.
On currency: a euro-based investor holding EUR-quoted European funds has no FX effect on the quoted value of the holding, but real FX exposure sits inside the earnings. CAC 40 and STOXX 600 constituents are multinationals with substantial foreign revenue, so the exposure is smaller, slower and partly hedged by foreign cost bases, not absent.
Japan (Nikkei / TOPIX ETFs)
The Nikkei at 22.28x is the closest of any major index to its own historical norm (+6.1%). The live question is policy: the BOJ held at 1.00% on 31 July, the next meeting is 17 to 18 September, and market-implied odds of a 25 bp hike are around 57%. With the yen near 160 to the dollar and the JGB 10-year at 3.00%, an unhedged euro or dollar investor is taking a meaningful currency position alongside the equity one. A hike that strengthens the yen would help unhedged foreign holders and hurt the exporters in the index, so the two exposures partly offset.
Emerging Markets (MSCI EM ETFs)
EEM trades at 17.40x, a 24.3% premium to its long-run band, which materially erodes the traditional "EM trades at a discount to developed markets" argument: it is now more expensive than the STOXX 600, the CAC 40 and the Nikkei on trailing earnings. China's weight remains the dominant factor, and both Chinese proxies are far from their records (Hang Seng 24.4% below, Shanghai 35.0% below), reflecting a decade-long derating rather than today's session. Today's oil shock is a net negative for the energy-importing majority of the EM complex, which is part of why Brazil diverged so sharply upward.
Overall Risk Score: High valuation risk / low margin of safety in the US, moderate in Europe and Japan. The US combination of a 51% premium to historical multiples, a negative nominal earnings yield gap and a real 10-year yield holding at 2.44% leaves little cushion. European and Japanese valuations are closer to fair, with Europe carrying the better income comparison against its own bond market.
Disclaimer: This is financial information, not personalised investment advice. Past valuations do not guarantee future returns. Consult a financial advisor before investing.
US Economic Indicators (FRED - authoritative)
| Indicator | Current | Prior | Delta | Reference Date | FRED Series |
|---|---|---|---|---|---|
| CPI YoY % | 3.30% | 3.46% | -0.16 pp | Jul 2026 | CPIAUCSL |
| Core CPI YoY % | 2.47% | 2.57% | -0.10 pp | Jul 2026 | CPILFESL |
| Unemployment Rate | 4.1% | 4.2% | -0.1 pp | Jul 2026 | UNRATE |
| Nonfarm Payrolls | -23k | +20k | -43k | Jul 2026 (m/m) | PAYEMS |
| 10Y TIPS Real Yield | 2.44% | 2.44% | 0.00 pp | 2026-09-01 | DFII10 |
FRED macro data is monthly and lags 4 to 6 weeks; all four macro rows reference July 2026. Two things stand out. Headline and core CPI were both easing as of July, which is the pre-shock picture and is exactly what today's oil move calls into question. And nonfarm payrolls actually contracted by 23,000 in July after a weak +20,000 in June, a genuinely soft labour print that sits awkwardly against a market now pricing rate hikes. The unemployment rate fell to 4.1% over the same month, so the household and establishment surveys are telling different stories.
The DFII10 current value is from the US Treasury real curve for 2026-09-01; the prior is the same curve for 2026-08-31. The real yield was flat across those two sessions, so the whole of the day's move in the nominal 10-year sits in the breakeven.
Other economic releases today (web search):
| Indicator | Actual | Consensus | Prior | Reaction |
|---|---|---|---|---|
| Eurozone flash HICP YoY (Aug) | 3.3% | 3.3% | 2.9% | In line, but a 0.4 pp jump |
| Eurozone flash core HICP YoY (Aug) | 2.4% | 2.5% | 2.5% | Softer, lowest since June |
| Eurozone Manufacturing PMI (Aug, final) | 52.8 | 52.8 | 52.8 | In line, expansionary |
| Germany Manufacturing PMI (Aug, final) | 54.1 | 54.1 | 54.1 | In line |
| Eurozone unemployment rate | 6.3% | 6.3% | 6.3% | In line |
| US ISM Manufacturing PMI (Aug) | 54.6 | 55.2 | 55.6 | Miss, eighth month of expansion |
The euro area print is the more interesting of the two inflation stories: headline rose to 3.3% on energy while core eased to 2.4%, its lowest since June. That divergence is the ECB's problem in miniature, since an oil-driven headline spike with muted underlying momentum argues for looking through it, while the day's bond move suggests the market is less willing to.
The US ISM manufacturing print landed at 10:00 ET. At 54.6 it undershot the 55.2 consensus and fell a full point from July's 55.6, with new orders down 3.0 points to 53.7 and employment down 1.6 points to 51.2. Manufacturing is still expanding, for an eighth consecutive month, but the momentum is draining out of it. The detail that matters most for the day's theme is the prices index at 71.1, unchanged from July and deeply in expansion: input costs were already running hot before the oil move, which is an uncomfortable starting point for absorbing a supply shock.
Fixed Income & Bond Analysis
Policy Rates
| Central Bank | Rate | Source |
|---|---|---|
| Fed Funds (upper) | 3.75% | FRED DFEDTARU (2026-09-01) |
| Fed Funds (lower) | 3.50% | FRED DFEDTARL (2026-09-01) |
| Effective FFR | 3.63% | FRED DFF (2026-08-28) |
| ECB Deposit Rate | 2.25% | FRED ECBDFR (2026-09-01) |
| BOJ Policy Rate | 1.00% | web search |
| BOE Bank Rate | ~3.73% | FRED IUDSOIA, SONIA proxy (2026-08-27) |
Government Bond Yields
| Country | 2Y Yield | 10Y Yield | 30Y Yield | Day Chg (10Y) | Source |
|---|---|---|---|---|---|
| USA | 4.39% | 4.79% | 5.27% | +4 bp | US Treasury par curve (2026-09-01) |
| Germany | 2.86% | 3.34% | 3.78% | — | ECB YC API AAA curve (2026-08-31) |
| UK | 4.37% | 5.21% | 5.87% | — | web |
| France | — | 4.17% | — | — | web (2026-08-31) |
| Japan | 1.81% | 3.00% | 4.19% | — | web |
| Italy | — | 4.17% | — | — | web (2026-08-31) |
The USA row is settled data throughout, dated 2026-09-01, with the day change computed against the 31 August session (4.79% vs 4.75%). Treasury publishes its curve a business day behind the session the press is writing about, so the 1 September curve only became available late in the evening; the row holds it, which means the settled figures and the Market Overview describe the same session. The German row uses the ECB AAA euro area curve as the Bund proxy, which is what the ECB API publishes, and is dated 31 August.
The UK is the outlier in this table by some distance: a 10-year gilt at 5.21% is 42 bp above the equivalent Treasury and 187 bp above the euro area AAA curve, and the 30-year at 5.87% is the highest since May 1998. Japan's 30-year at 4.19% deserves attention too, since a country that spent three decades at the zero bound now has a long bond yielding more than Germany's.
Yield Curve Spreads (US Treasury par curve, 2026-09-01, recomputed from the levels above):
- 10Y-2Y spread: +40 bp. Positively sloped and normal, neither inverted nor steep. The curve disinverted some time ago and has been rebuilding term premium since. It flattened a basis point on the day, because the 2-year rose 5 bp against the 10-year's 4 bp.
- 10Y-3M spread: +87 bp. Comfortably positive, so the classic recession signal is not firing.
The shape worth noting is not the 2s10s but the long end, and the settled data complicates the story the intraday move suggested. In levels, the term premium is plainly there: at 5.27% apiece, the 20-year and 30-year both sit 48 bp above the 10-year. In changes, though, the long end is where the least is happening. On the day the 30-year rose 2 bp against 6 bp in the 3-year and 5-year, and since the 30 July curve the 2-year is up 16 bp against the 30-year's 6 bp. That is a bear flattening driven by policy expectations, not a term-premium build. The large long-end premium is inherited from earlier in the summer rather than being added to now.
OAT-Bund Spread: approximately 83 bp (French 10-year OAT at 4.17% against the AAA curve at 3.34%). This remains the key French fiscal risk indicator, and the near-total convergence with Italian BTPs, also 4.17%, is a notable repricing of relative sovereign risk within the euro area.
Yield Curve Charts
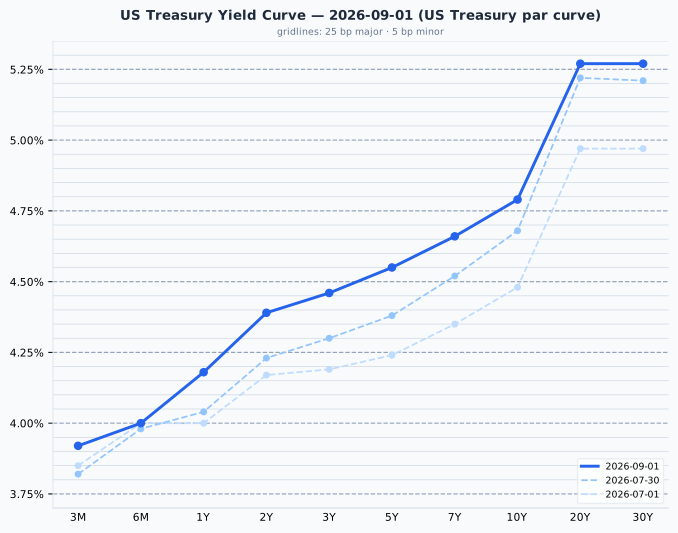
The US curve is positively sloped throughout with a pronounced steepening beyond 10 years, the classic shape of a market that expects policy to normalise but demands compensation for holding duration. Against the 30 July curve, the month's move has been a bear flattening rather than a level shift: the belly is up 14 to 17 bp from the 1-year through the 5-year, the 10-year up 11 bp, and the 20-year and 30-year up only 5 and 6 bp. The chart shows the curve pivoting around its long end, not lifting off it.
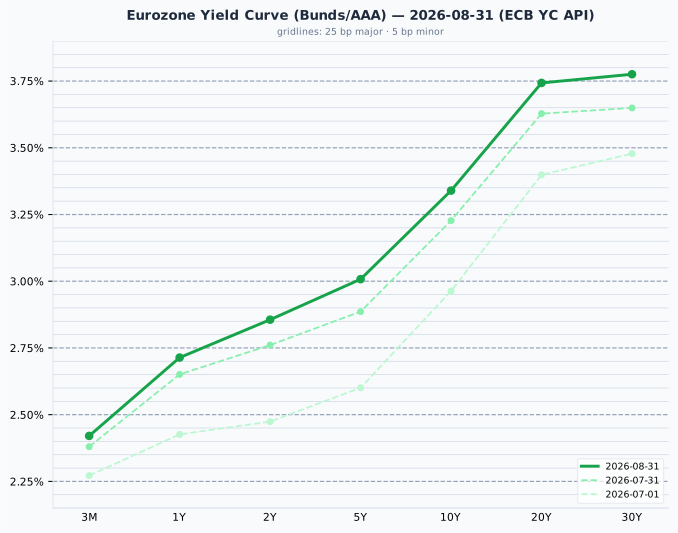
The euro AAA curve is likewise upward sloping across its full range, but materially flatter at the long end than the US, with only 44 bp between the 10-year and the 30-year against 50 bp for Treasuries. Since 31 July the euro curve has risen about 10 to 13 bp at the long end and 4 bp at the 3-month point, a mild bear steepening that mirrors the US move at a lower absolute level.
A sanity note on the front end: the settled 3-month par yield of 3.92% sits about 30 bp above the Fed funds target midpoint of 3.625%. That is wider than the usual tolerance and is not a data anomaly; it is the bill market pricing meaningful odds of a hike.
Credit Markets (FRED, authoritative)
| Market | OAS Spread | Series ID | Observation |
|---|---|---|---|
| US Investment Grade | 80 bps | BAMLC0A0CM | 2026-08-31 |
| US High Yield | 263 bps | BAMLH0A0HYM2 | 2026-08-31 |
| Euro High Yield | 259 bps | BAMLHE00EHYIOAS | 2026-08-31 |
All three sit below their long-run normal ranges. US IG at 80 bp is at the very bottom of the 80-150 bp band, and US high yield at 263 bp is below the 300-500 bp normal range, so both are historically tight rather than merely normal. Credit is not corroborating the risk-off tone visible in equities and rates, which is the usual pattern early in a shock: spread markets are slower to reprice than listed ones. It also means there is very little cushion in credit if the oil shock proves persistent. Note these are 31 August observations and therefore predate today's move.
Real Yields (US and Euro Area)
| Region | Nominal 10Y | Expected inflation | Real 10Y | How the real yield is obtained |
|---|---|---|---|---|
| United States | 4.79% | 2.35% (residual) | 2.44% | Measured. TIPS trade, so the market quotes a real yield directly; expected inflation is the residual, the breakeven |
| Euro area | 3.34% | 2.04% (measured, ECB SPF 2026 Q3) | 1.30% | Constructed. No euro inflation-linked benchmark is published, so a survey expectation is subtracted from the nominal yield |
The two rows are built in opposite directions. The US measures the real yield and infers inflation; the euro area measures inflation and infers the real yield. Only the US figure, DFII10 at 2.44%, is something anyone actually trades, so the euro figure of 1.30% is the softer of the two and should be treated as such. Two mismatches follow from that: the US breakeven carries an inflation risk premium that a survey does not, and the SPF horizon is 5 years against the bond's 10.
Decomposing the 145 bp nominal gap between the two regions gives 31 bp of expected-inflation difference (2.35% versus 2.04%) and 114 bp of real rate difference (2.44% versus 1.30%). This is still overwhelmingly a real rate story, but the day's widening came entirely from the inflation side: the US breakeven rose 4 bp while the real component did not move.
The US-euro real rate gap is not an investment opportunity
The US real yield has exceeded the euro one in every quarter since 2014, and a 114 bp gap today is squarely in line with that history. It is a structural feature, reflecting higher US trend growth, euro area excess savings, Bund scarcity and US fiscal supply, and it is not a trade a euro-based reader can capture. Hedging the currency cancels it almost exactly, because the forward rate is set to remove the interest differential; unhedged, it is a currency bet rather than a bond decision. A real yield is real in its own currency, so 2.44% means 2.44% above US inflation, which is not a real return for someone who spends euros. The gap's twelve-year survival is itself the evidence that it is compensation for risk borne by dollar investors rather than free money.
Bond Portfolio Implications
On the session's closing numbers, US bonds offer more current income than US equities: the S&P 500 earnings yield of 3.89% is 90 bp below the 10-year Treasury at 4.79%. In Europe the ordering is reversed, with the STOXX 600 earnings yield of 5.60% standing 226 bp above the AAA 10-year at 3.34%.
Two caveats belong with those figures whenever they carry weight. First, the comparison ignores growth: a coupon is fixed for a decade while the earnings behind an equity yield grow roughly with inflation, so the nominal gap understates equities by approximately expected inflation. The real-yield version corrects this, and the size of the correction is the interesting part, worth 2.35 pp for the US, which is enough to flip the S&P gap from -0.90 pp to +1.45 pp. Second, an equity holder does not receive the full earnings yield in cash; only the dividend and buyback portion arrives, and the remainder is retained.
This measure describes today's income trade-off using nothing but quoted prices, which is its genuine virtue. It is not a forecast, and nothing about forward equity returns should be read from it. For the forward-looking valuation argument, the earnings yield measured against its own history is the measure that carries predictive content.
Duration risk: a 100 bp rise in yields implies roughly an 8 to 9% price loss on a 10-year bond, and considerably more at the 30-year point. On the settled curve the day's pressure was concentrated in the belly rather than the long end, which cuts the other way for this argument: the 5-year rose 6 bp against the 30-year's 2 bp, so the short-to-intermediate part of the curve was where the repricing actually happened. It still offers most of the yield with a fraction of the volatility, the 5-year at 4.55% capturing 95% of the 10-year's yield with roughly half the duration, but a reader should not treat that as an untouched corner of the market.
Currencies & Commodities
Currencies:
| Pair | Rate | Source |
|---|---|---|
| EUR/USD | 1.1598 | FRED DEXUSEU (2026-08-28) |
| USD Index | 118.75 | FRED DTWEXBGS (2026-08-28) |
| USD/JPY | 159.75 | web search |
| GBP/USD | ~1.355 | web search |
| USD/CHF | 0.8101 | web search |
The GBP/USD figure is approximate: retrieved sources ranged between 1.35 and 1.36 for the session. EUR/USD and the broad dollar index are 28 August observations, the most recent FRED publishes.
Commodities (front-month futures):
| Commodity | Price | Day Chg % | Ticker | Source |
|---|---|---|---|---|
| Brent Crude | $95.22 | +5.23% | BZ=F | yfinance |
| WTI Crude | $90.68 | +5.74% | CL=F | yfinance |
| Gold ($/oz) | $4,375.70 | -2.36% | GC=F | yfinance |
| Silver ($/oz) | $64.66 | -3.48% | SI=F | yfinance |
| Copper ($/lb) | $6.534 | -2.30% | HG=F | yfinance |
| Nat Gas ($/MMBtu) | $2.946 | +0.37% | NG=F | yfinance |
Day changes are last trade (1 Sep, 16:59 ET) vs the prior session's settlement (31 Aug). The 1 September settlements were not yet available, so these are last-trade figures rather than settlement-to-settlement ones. The two differ: press reports of this session put the WTI settlement near $90.22 and Brent near $94.65, below the last trades quoted above, so a figure copied from the wires will not match this table.
Crude is the day's engine, and it gained further ground through the afternoon: WTI closed the session 5.74% higher against 3.68% at midday, Brent 5.23% against 3.05%. Both benchmarks remain well inside their 52-week ranges despite the jump. WTI at $90.68 sits in a 52-week range of $54.98 to $119.48, and Brent at $95.22 between $58.72 and $126.10. Their nominal records both date from July 2008, far too long ago for a distance-to-record figure to carry information about this market. The more useful framing is that the move retraced more than a week's worth of decline in a single session and did so on a supply-security headline, which is the kind of move that reverses fast if the shipping lane stays open.
Gold at $4,375.70 is 21.7% below its all-time high of $5,586.20, set on 29 January 2026, and silver at $64.66 is 46.7% below its all-time high of $121.30, set the same day. Both extended their declines into the close, gold from -1.55% at midday to -2.36% and silver from -1.90% to -3.48%. That is the session's most instructive cross-asset signal, and the settled data makes it harder to explain rather than easier: the 10-year real yield was unchanged at 2.44%, so the usual opportunity-cost account of a metals selloff has nothing to stand on here. What actually happened is that the metals fell during a geopolitical escalation with no adverse move in real rates behind them. Silver's steeper decline is characteristic, since its industrial demand component makes it the higher-beta metal in both directions.
Copper at $6.534 is slightly below its all-time high of $6.75, set on 26 August 2026, so it is the one commodity here trading close to a genuinely recent record, though the close took it from 2.1% to 3.2% below that mark. Natural gas is the one row whose sign reversed: down 1.47% at midday, it finished the session up 0.37% at $2.946, still near the bottom of a 52-week range of $2.483 to $7.827.
Contract housekeeping: the WTI generic points at CLV26.NYM expiring 22 September, natural gas at NGV26.NYM expiring 28 September, and Brent at BZX26.NYM expiring 1 October. None is close enough to roll to distort tomorrow's comparison. Gold, silver and copper are all on December contracts.
Crypto: no moves above the 3% reporting threshold were retrieved for this session.
Sector & Theme Highlights
Energy was the clear global winner, the only sector with a direct positive read from the day's driver, with oil and gas producers and integrated majors benefiting from a 5%-plus move in both crude benchmarks. Defensive sectors held up, visible in the Swiss SMI's positive close on its pharma weighting.
Semiconductors and megacap technology were the worst performers, taking the brunt of the selloff. The usual mechanism, a rise in the real discount rate, is not what did it here: the 10-year real yield closed flat. What moved was the breakeven, and long-duration equity was marked down against a higher nominal rate regardless of its composition. The Nasdaq 100's 1.29% decline against the S&P's 0.71% is the whole story in one comparison.
Three cross-market themes are worth carrying forward. Energy security has re-entered the risk premium after a quiet summer, and the market is treating Hormuz disruption as an inflation event rather than a growth event, which is why bonds sold off with stocks rather than rallying. The settled curve makes that reading stronger, not weaker: the entire move in the US 10-year was breakeven inflation. Term premium remains large in the level of every major sovereign curve, and the UK is furthest along with a 30-year at a 28-year high, but the US session added to policy expectations rather than to term premium, with the belly rising three times as much as the 30-year. Commodity-exporter divergence was clean, with Brazil up 1.30% while every developed market fell, a reminder that the EM complex is not one trade.
Top Stories (Global)
- Renewed US-Iran hostilities in the Strait of Hormuz, including an overnight attack on a cargo ship, drove the entire session. Oil rebuilt a risk premium that had eroded over the summer, WTI closing 5.74% higher and Brent 5.23%, and the move fed straight into inflation expectations rather than growth fears.
- Gilts led a global government bond selloff, with the UK 30-year at 5.87%, its highest since May 1998, and the 10-year at 5.21%. The UK was closed Monday for the Summer Bank Holiday, so part of the move is two sessions of catch-up compressed into one.
- US Treasury yields reached their highest since January 2025, the settled 10-year par yield closing at 4.79% and the 30-year at 5.27%, with the bill market now pricing meaningful odds of a hike rather than a cut. The move was concentrated in the belly, the 3-year and 5-year both up 6 bp against the 30-year's 2 bp.
- Eurozone flash inflation rose to 3.3% while core eased to 2.4%, its lowest since June. The divergence is energy-driven and hands the ECB a familiar look-through problem at an awkward moment.
- Technology and chip stocks bore the brunt of the equity decline, the Nasdaq 100 closing down 1.29% against the S&P 500's 0.71%, nearly twice as much. The usual explanation, a real-rate backup, does not apply on the settled data: the 10-year real yield was flat and the nominal move was entirely breakeven inflation.
- BOJ September hike expectations firmed, with the yen near 160, the JGB 10-year at 3.00% and Deputy Governor Himino signalling that the 17 to 18 September meeting is live. Market-implied odds of a 25 bp move are around 57%.
- Brazil's Ibovespa rallied 1.30%, the day's standout gainer among major indices, as a commodity exporter monetising the shock that pressured everyone else. It gave back roughly a third of its midday gain into the close.
- US ISM Manufacturing missed at 54.6 against a 55.2 consensus and July's 55.6, with new orders down 3.0 points and employment down 1.6. Manufacturing is still expanding for an eighth month, but the prices index held at 71.1, so input costs were already elevated before the oil move landed.
- French and Italian 10-year yields converged to roughly 4.17%, a spread near zero that ranks among the tightest in two decades and reflects French risk repricing upward rather than Italian risk repricing downward.
Looking Ahead
Central banks - BOJ meeting, 17 to 18 September, the single most consequential scheduled event on this horizon. Market-implied odds of a 25 bp hike to 1.25% sit near 57%, and today's move in JGBs and the yen will feed directly into that pricing. - Fed and ECB speakers through the week, whose commentary on whether an oil shock should be looked through will matter more than usual given today's repricing. - Bank of England commentary carries elevated weight after gilts led the global selloff and traders raised their expectations for rate rises.
Economic releases (next 1 to 5 trading days) - US August employment report, Friday 4 September, the most important release on the near horizon given July's contraction of 23,000 payrolls and the softening in the ISM employment component. A second weak print against a market pricing hikes would be a genuine dislocation. - US JOLTS, ADP and durable goods orders, midweek. ISM Manufacturing has now released and is covered above. - US initial jobless claims and ISM Services, Thursday 3 September. - Final services PMIs for the euro area, UK and US, following the manufacturing readings above.
Geopolitical - Strait of Hormuz shipping security is the dominant variable. Around a fifth of global petroleum liquids consumption transits the strait, so the oil price, and through it the inflation and rates complex, is effectively hostage to the next headline.
Market closures - Monday 7 September: United States (Labour Day), Canada (Labour Day), Brazil (Independence Day). Three major markets closed simultaneously, so expect thin liquidity around that session. - No closures in the UK, Germany, France, Japan, Australia, Switzerland, Korea or India in the next five trading days. The next Japanese closures are 21 and 23 September, and Korea's Chuseok holiday runs 24 to 26 September.