2026 10 29
Global Financial Briefing — Thursday, 29 October 2026
Figures reflect the 29 Oct close wherever close data exists. FX quotes and the French, UK, Japanese and Italian bond yields are evening quotes; other figures are dated inline. The US Treasury curve and the euro AAA curve are the 29 Oct closes; the bond table's euro row is the ECB's euro AAA curve.
Market Overview
The European Central Bank kept its deposit rate at 2.50% and its main refinancing rate at 2.65%, as expected; it raised the deposit rate in June to 2.25% and on 10 September to 2.50% (as cited in the 20 Oct briefing). Christine Lagarde said the Governing Council discussed a rise but agreed unanimously to hold, and the statement said high energy prices could both push inflation up and slow activity, while underlying inflation was still fairly stable and wages had not yet responded; it gave no signal on the next move (Trading Economics). Separately, the ECB said Lagarde will leave on 7 February 2027, before her term ends in October 2027, and that the European Council will appoint her successor (investingLive, citing the ECB's statement). German government bond yields fell after the decision: the 2-year by about 6 bp to 3.05% and the 10-year by about 3 bp to 3.36%, its lowest since late August (Trading Economics). European shares rose: the DAX gained 1.31%, the CAC 40 1.05% and the STOXX 600 0.77%, and Switzerland's SMI rose 1.21% to 14,756.86, a record close.
On Wall Street, Alphabet's Class A shares fell 12.64% to $283.82, their worst day on record, after third-quarter results in which its capital spending, mostly on AI data centres, exceeded the cash its operations brought in (Trading Economics; CNBC; The Wall Street Republic). With Alphabet and other large technology shares falling, the Nasdaq 100 fell 1.38% and the S&P 500 0.30%, while most other sectors rose: health care gained 2.40%, helped by Eli Lilly's raised revenue forecast, and real estate, consumer staples and utilities more than 1.5% each (Select Sector SPDR funds). After the close, Amazon fell about 7% in extended trading when its revenue and earnings missed forecasts despite the fastest growth in its cloud business in almost five years, and Intel about 16.5% on a weak fourth-quarter forecast (Benzinga; Forbes; Seeking Alpha). The US economy grew at an annualised 3.4% in the third quarter, above the 3.2% forecast and the fastest in about a year, led by business investment in computers and other equipment for AI; the Fed's preferred core inflation measure, the core PCE price index, rose to 3.1% a year in September from 3.0%, as expected (Trading Economics). Treasury yields fell with European ones: the 10-year settled at 4.98%, 7 bp lower on the day, and the 5-year at 4.78%, also 7 bp lower (US Treasury par curve, 29 Oct).
In Asia, Samsung Electronics reported a record operating profit of 107.4 trillion won for the third quarter, yet its shares fell about 4.1% after it put off decisions on further share buybacks until January, and Korea's Kospi fell 1.24% (Samsung Electronics; Korea JoongAng Daily; MoneyToday). The Hang Seng fell 0.59%, led by technology shares, on doubts about the returns on heavy AI spending, while Tokyo's Nikkei 225 gained 1.10%, its third consecutive rise after 1.73% on 27 October and 1.08% on 28 October, as the chip-testing equipment maker Advantest rose about 6% after raising its annual forecast (Trading Economics). Oil gave back part of Wednesday's gain, the December WTI contract settling 0.76% lower at $102.00. The Bank of Japan announces its decision tomorrow, 30 October, and is expected to hold its rate at 1.25% (MUFG Research).
Global Indices Snapshot
Americas
| Index | Level | Day Chg | Day Chg % | Source |
|---|---|---|---|---|
| S&P 500 | 7,720.39 | −23.59 | −0.30% | yfinance ^GSPC |
| Nasdaq 100 | 29,402.51 | −410.65 | −1.38% | yfinance ^NDX |
| Dow Jones | 52,342.56 | −132.54 | −0.25% | yfinance ^DJI |
| Brazil IBOV | 169,186.42 | −1,819.67 | −1.06% | yfinance ^BVSP |
Americas data reflects the 29 Oct close. Day changes are against the 28 Oct close.
The S&P 500 closed 0.29% above its 50-day average, 5.66% above its 200-day and 1.58% below its 52-week high of 7,844.52. The Nasdaq 100 closed 1.38% below its 50-day average and 6.25% below its 52-week high of 31,361.37: Alphabet fell 12.64%, Amazon 4.25% and Microsoft 0.16%, while Meta rose 1.96% (Yahoo Finance). After the close Amazon reported revenue of $201.9 billion and earnings of $1.89 a share, both below forecasts, while its cloud business, AWS, grew 39% to $46 billion; it still expects to spend about $220 billion on capital investment this year, mostly on AI, and its shares fell about 7% in extended trading (Benzinga; Forbes). Intel's third-quarter revenue rose 21% to $16.5 billion and its adjusted earnings beat forecasts, but it guided fourth-quarter revenue to $15 to $16 billion, below the roughly $17 billion analysts expected, and its shares fell about 16.5% in extended trading after a 3.62% fall in the session (Intel; Benzinga; Seeking Alpha). The Dow fell 0.25%; among its members Caterpillar fell 9.25% after forecasting only moderate sales growth in the fourth quarter, while Merck rose 3.83% after raising its guidance (Trading Economics; Yahoo Finance). Smaller companies did better than the large ones: the Russell 2000 rose 1.01% to 2,859.22 (Yahoo Finance), its highest since September (Trading Economics), and the equal-weighted S&P 500 fund gained 1.20% (The Wall Street Republic). Brazil's Ibovespa fell 1.06%, its fourth fall in four sessions since President Lula's re-election on 25 October, and is 10.06% below its 50-day average.
Europe
| Index | Level | Day Chg | Day Chg % | Source |
|---|---|---|---|---|
| Euro STOXX 600 | 649.11 | +4.97 | +0.77% | yfinance ^STOXX |
| CAC 40 | 7,970.00 | +83.04 | +1.05% | yfinance ^FCHI |
| DAX | 26,039.68 | +335.66 | +1.31% | yfinance ^GDAXI |
| FTSE 100 | 10,722.07 | +27.57 | +0.26% | yfinance ^FTSE |
| SMI (Swiss) | 14,756.86 | +175.76 | +1.21% | yfinance ^SSMI |
European data reflects today's close (29 Oct).
The SMI's close of 14,756.86 is above its previous record close of 14,633.70 on 10 August (Yahoo Finance price history). The DAX rose 1.31% and is 1.78% above its 50-day average and 2.18% below its 52-week high of 26,618.74. The CAC 40 gained 1.05% to 7,970.00, with Renault up almost 4% after third-quarter sales held up on strong demand for its electric cars, and TotalEnergies, whose profit beat forecasts on higher oil prices, up 0.9%, in line with the index; STMicroelectronics fell 1.2% with technology shares elsewhere (Trading Economics). The CAC 40 is still 1.32% below its 50-day average and 2.86% below its 200-day, the only major European index below both. The STOXX 600 is 2.16% below its 52-week high of 663.41. The FTSE 100 rose 0.26%.
Asia-Pacific
| Index | Level | Day Chg | Day Chg % | Source |
|---|---|---|---|---|
| Nikkei 225 | 64,659.47 | +705.28 | +1.10% | yfinance ^N225 |
| Hang Seng | 22,958.65 | −136.18 | −0.59% | yfinance ^HSI |
| Shanghai Comp | 3,651.43 | −30.04 | −0.82% | yfinance 000001.SS |
| ASX 200 | 8,891.80 | +44.50 | +0.50% | yfinance ^AXJO |
| Kospi (Korea) | 5,937.66 | −74.78 | −1.24% | yfinance ^KS11 |
Asia-Pacific data reflects today's close (29 Oct).
The Kospi rose as high as 6,100.11 before closing 1.24% lower at 5,937.66 (MoneyToday). Samsung Electronics fell about 4.1% to 232,000 won: it said it expects total shareholder returns of 90 to 110 trillion won for 2026 and declared about 30 trillion won in dividends, but left the size of further buybacks to January (Samsung Electronics; Korea JoongAng Daily). LG Energy Solution fell about 8.6% after LG Chem, its largest shareholder, decided to sell part of its stake, while SK hynix rose about 2.6% (Korea JoongAng Daily). The index is 9.45% below its 50-day average. In Hong Kong the chipmaker SMIC fell 6.2%, Lenovo 7.1% and Tencent 2.8%, while PetroChina's 21.6% rise in third-quarter profit supported energy shares (Trading Economics); the Hang Seng is 1.96% above its 52-week low of 22,518.00. The Shanghai Composite fell 0.82% and is 2.16% above its 52-week low of 3,574.27. In Tokyo, besides Advantest, Tokyo Electron rose about 2.4% and the banks Mizuho and Mitsubishi UFJ 3.3% and 2.6% ahead of the Bank of Japan's decision (Trading Economics); the Nikkei is 1.89% below its 50-day average. Australia's ASX 200 rose 0.50%.
Emerging Markets
| Index | Level | Day Chg % | Source |
|---|---|---|---|
| MSCI EM (EEM) | 62.72 | −1.26% | yfinance EEM |
| India Nifty 50 | 22,936.75 | +1.05% | yfinance ^NSEI |
| South Africa | 64.09 | −0.42% | yfinance EZA |
MSCI EM (EEM) and South Africa (EZA) are the 29 Oct New York closes; the Nifty is today's close.
EEM trades in New York after Asia has closed, so its 1.26% fall is New York's valuation of emerging markets during a session of falling technology shares. This time it points the same way as most local closes: Korea fell 1.24%, Shanghai 0.82% and Hong Kong 0.59%, while India's Nifty rose 1.05%; Taiwan's Taiex was down 1.9% early in the session (Yahoo Finance). With the euro up 0.10% against the dollar, the fall is about 1.36% for a euro investor. EEM is 5.29% below its 50-day average. South Africa's fund fell 0.42% and is 6.58% below its 200-day average.
Index Valuations & Investment Risk
Valuation Table
| Index | Trailing P/E (live) | 50-day avg | 100-day avg | 200-day avg |
|---|---|---|---|---|
| S&P 500 | 24.4x | 24.9x | 25.7x | — |
| Nasdaq 100 | 27.4x | 29.4x | 30.6x | — |
| Euro STOXX 600 | 18.0x | 17.7x | 18.1x | — |
| CAC 40 | 16.8x | 16.6x | 17.1x | — |
| DAX | 18.4x | 18.2x | 18.4x | — |
| FTSE 100 | 16.6x | 16.5x | 17.2x | — |
| Nikkei 225 | 16.9x | 20.5x | 21.6x | — |
| MSCI EM | 13.4x | 14.8x | 16.0x | — |
Averages of the daily trailing P/E readings recorded since 1 May 2026 (n = 121; 117 for the Nikkei proxy); shown for reference only. Trailing P/E is Yahoo Finance's trailing P/E for the ETF proxies SPY, QQQ, EXSA.DE, CAC.PA, EXS1.DE, ISF.L, 1321.T and EEM, priced off each market's 29 Oct close.
Investment Risk Assessment for ETF Investors
United States (S&P 500 / Nasdaq ETFs)
The S&P 500's trailing P/E of 24.4x gives an earnings yield of 4.09% (1÷24.43). Against the settled 10-year Treasury yield of 4.98% (US Treasury par curve, 29 Oct) the earnings yield gap is −0.89 pp: a 10-year government bond pays more income than the index's earnings come to per dollar invested. Against the real 10-year yield of 2.63% (US Treasury real curve, 29 Oct) the gap is +1.46 pp; the 2.35 pp between the two is the correction for company earnings growing with inflation while a bond coupon is fixed. Only the part of earnings paid out as dividends and buybacks reaches a holder as cash. The Nasdaq 100 at 27.4x has an earnings yield of 3.65%, 1.33 pp below the 10-year Treasury. The S&P 500 sits 0.29% above its 50-day average and 1.58% below its 52-week high. Today showed how much the index depends on investors' confidence in AI spending: Alphabet lost 12.64% after reporting that its spending exceeded its operating cash flow, pulling the Nasdaq 100 down 1.38%, while nine of the eleven US sector funds rose; after the close Amazon and Intel fell sharply in extended trading on their results. Stronger growth and core PCE inflation of 3.1% support the case for the December rate rise that futures priced at about 85% after Wednesday's Fed meeting (Axios, citing CME FedWatch, as cited in the 28 Oct briefing).
Europe (STOXX 600 / CAC 40 / DAX ETFs)
The STOXX 600 at 18.0x gives an earnings yield of 5.57% (1÷17.95); against the euro AAA 10-year yield of 3.37% (ECB YC API, 29 Oct) the euro earnings yield gap is +2.20 pp, and today's 10-year Bund quote of 3.36% (Trading Economics) gives +2.21 pp. Against the euro-area real 10-year yield of 1.34% (see Real Yields below) it is +4.23 pp. The S&P 500 trades at a 36.1% P/E premium to the STOXX 600 (24.4x against 18.0x). Part of the difference between the US and euro gaps reflects different inflation and policy paths rather than different compensation for risk, which is why the real-yield versions are shown alongside.
France remains the region's main risk. The CAC 40 at 16.8x has an earnings yield of 5.96% (1÷16.77), 1.05 pp above the French 10-year yield of 4.91%; the DAX at 18.4x yields 5.42%, 2.06 pp over the Bund, and the FTSE 100 at 16.6x yields 6.02%, 0.72 pp above the 10-year gilt at 5.30%. French 10-year yields fell about 3 bp, in line with German ones, leaving the spread over the Bund at 155 bp. The National Assembly votes on the revenue part of the 2027 budget on 3 November (as cited in the 27 Oct briefing). The ECB's hold and Lagarde's departure date add a second question for euro investors: who leads the bank from February 2027, with the European Council to choose. A euro investor in euro-quoted funds has no exchange-rate effect on the quoted value, but the constituents earn much of their profit abroad, so their earnings in euros still move with the currency.
Japan (Nikkei / TOPIX ETFs)
The Nikkei proxy's P/E is 16.9x (earnings yield 5.92%), 3.08 pp above the 10-year Japanese government bond at 2.84% (Trading Economics). The Bank of Japan decides on 30 October and is expected to hold its rate at 1.25%, with MUFG Research expecting a further rise in December (MUFG Research). The yen weakened 0.07% against the dollar to 157.88 and about 0.2% against the euro, so a euro investor in an unhedged Japan fund kept about 0.9% of the index's 1.10% gain.
Emerging Markets (MSCI EM ETFs)
EEM trades at 13.4x, the cheapest index in the table and a 44.9% discount to the S&P 500. Its weight in a few Asian memory-chip makers cut both ways this week: SK hynix's results lifted the Kospi 6.63% on 28 October, and today Samsung's record profit still left its shares about 4.1% lower because investors wanted firmer buyback plans. A Fed rise in December, now supported by 3.4% growth and 3.1% core inflation, would tend to draw money out of emerging markets and raise the cost of their dollar debts, whatever the investor's home currency. Brazil's main index has fallen in each of the four sessions since the 25 October election.
Overall Risk Score: - United States: High valuation risk / low margin of safety. A negative nominal earnings yield gap, a 10-year yield near 5%, a likely December rate rise, and a market whose largest companies are being judged on whether AI spending pays. - Europe: Moderate. Positive earnings yield gaps on both measures and a P/E well below the US; French 10-year yields of 4.91%, 155 bp over Germany, with the budget not yet passed. - Japan: Moderate. A P/E of 16.9x, with a Bank of Japan decision on 30 October. - Emerging Markets: Attractive relative valuation, with returns concentrated in Korean chip makers and Brazil still repricing its election result.
US Economic Indicators (FRED - authoritative)
| Indicator | Current | Prior | Delta | Reference Date | FRED Series |
|---|---|---|---|---|---|
| CPI YoY % | 3.72% | 3.35% | +0.36 pp | Sep 2026 (prior Aug) | CPIAUCSL |
| Core CPI YoY % | 2.57% | 2.45% | +0.12 pp | Sep 2026 (prior Aug) | CPILFESL |
| Unemployment Rate | 4.2% | 4.1% | +0.10 pp | Sep 2026 (prior Aug) | UNRATE |
| Nonfarm Payrolls | +29k | +133k | −104k | Sep 2026 (prior Aug), monthly chg | PAYEMS |
| 10Y TIPS Real Yield | 2.63% | 2.67% | −4 bp | 29 Oct 2026 (prior 28 Oct) | DFII10 (US Treasury real curve) |
Today's data filled in the picture behind these monthly figures. Growth was strong in the third quarter, but the slowdown in hiring shown by September's 29,000 payroll gain has not reached layoffs: first-time jobless claims fell to 194,000 in the week to 24 October.
Other economic releases today (web search)
| Release | Actual | Consensus | Prior | Note |
|---|---|---|---|---|
| ECB policy decision | deposit 2.50% (hold) | hold | 2.50% | main refinancing rate 2.65%; a rise was discussed, the hold was unanimous (Trading Economics) |
| US GDP, Q3 advance, annualised | 3.4% | 3.2% | 2.2% (Q2) | business investment added 3.27 pp, consumer spending 2.52 pp; net trade subtracted (Trading Economics) |
| US core PCE prices, Sep, y/y | 3.1% | 3.1% | 3.0% | +0.3% m/m, as expected (Trading Economics) |
| US PCE prices, Sep, y/y | 3.6% | 3.6% | 3.4% | +0.5% m/m (Trading Economics) |
| US personal income / spending, Sep, m/m | +0.2% / +0.5% | +0.3% / +0.6% | +0.3% / +0.9% | spending after inflation flat (Trading Economics) |
| US initial jobless claims, week to 24 Oct | 194k | 199k | 195k | (Trading Economics) |
| Euro area economic sentiment, Oct | 96.9 | 97.5 | 97.5 | firms' selling price expectations rose to 24.8 from 20.8 (Trading Economics) |
| Italy unemployment, Sep | 6.3% | 6.2% | 6.2% | (Trading Economics) |
The US growth figure beat forecasts because businesses spent heavily on computers and other equipment, the investment behind AI data centres, while consumer spending also rose; imports grew sharply and exports fell, subtracting from growth (Trading Economics). The core PCE index, which excludes food and energy, rose 3.1% in the year to September, the fastest since May; Trading Economics links the rise to energy costs spreading into other prices. In September alone, household spending rose 0.5% before inflation and not at all after it. In the euro area, the European Commission's survey showed confidence slipping in October while the balance of firms expecting to raise their prices rose to 24.8 from 20.8, the kind of spread of energy costs into other prices the ECB said it has not yet seen clearly (Trading Economics).
Fixed Income & Bond Analysis
Policy Rates
| Central Bank | Rate | Source |
|---|---|---|
| Fed Funds (upper) | 4.00% | FRED DFEDTARU (29 Oct 2026) |
| Fed Funds (lower) | 3.75% | FRED DFEDTARL (29 Oct 2026) |
| Effective FFR | 3.88% | FRED DFF (28 Oct 2026) |
| ECB Deposit Rate | 2.50% | FRED ECBDFR (29 Oct 2026); held today |
| BOJ Policy Rate | 1.25% | web search (MUFG Research, 26 Oct: hold at 1.25% expected on 30 Oct) |
| BOE Bank Rate | 3.73% | FRED IUDSOIA (SONIA proxy, 28 Oct 2026) |
The ECB held its deposit rate at 2.50% today, where its 10 September rise put it. The Fed held its range at 3.75–4.00% on 28 October, where its 15–16 September rise put it (as cited in the 20 Oct briefing). The BOJ raised its rate to 1.25% on 18 September (as cited in the 21 Oct briefing) and announces its decision tomorrow. The Bank of England held Bank Rate at 3.75% on 17 September (as cited in the 21 Oct briefing) and meets next on 5 November.
Government Bond Yields
| Country | 2Y Yield | 10Y Yield | 30Y Yield | Day Chg (10Y) | Source |
|---|---|---|---|---|---|
| USA | 4.61% | 4.98% | 5.32% | −7 bp | US Treasury par curve (29 Oct 2026) |
| Euro area AAA (ECB) | 3.01% | 3.37% | 3.61% | −2 bp | ECB YC API (29 Oct 2026) |
| France | — | 4.91% | — | −3 bp | web (Trading Economics, 29 Oct 2026 intraday) |
| UK | — | 5.30% | — | −5 bp | web (Trading Economics, 29 Oct 2026 intraday) |
| Japan | — | 2.84% | — | +1 bp | web (Trading Economics, 29 Oct 2026 intraday) |
| Italy | — | 4.49% | — | −3 bp | web (Trading Economics, 29 Oct 2026 intraday) |
The USA day change is against the 28 Oct 2026 curve from the same feed; the Euro area AAA row is the ECB's AAA euro-area curve, with its day change against the 28 Oct 2026 curve. The other rows are 29 Oct quotes, with day changes as Trading Economics reports them, rounded; only their 10-year yields are shown. German Bund quotes from the same source are in the text below.
Yield Curve Spreads (US Treasury par curve, 29 Oct 2026): - 10Y-2Y spread: +37 bp, positive, 12 bp outside the ±25 bp flat band and under the 75 bp steep threshold, −1 bp against 28 Oct. - 10Y-3M spread: +80 bp, positive, no recession signal, −7 bp against 28 Oct.
OAT-Bund Spread: 155 bp (10-year OAT 4.91% against Bund 3.36%, Trading Economics, 29 Oct 2026 intraday), against 156 bp on Wednesday's quotes.
On 29 October US yields fell at every maturity from six months out, most between three and ten years: the 7-year fell 8 bp to 4.87%, the 5-year and 10-year 7 bp each to 4.78% and 4.98%, the 2-year 6 bp to 4.61% and the 30-year 5 bp to 5.32%, while the 3-month bill was unchanged at 4.18%. The 2-to-10 slope narrowed 1 bp to 37 bp, after widening 9 bp on 28 October, the day of the Fed's decision.
In Germany, short-dated yields fell most after the ECB's hold: the 2-year fell about 6 bp to 3.05%, the 5-year about 5 bp to 3.16% and the 10-year about 3 bp to 3.36%, its lowest since late August, while the 30-year edged up about 1 bp to 3.70% (Trading Economics). France's 10-year fell about 3 bp to 4.91%, and Italy's 10-year, at 4.49%, is 113 bp over Germany; Italy sold 10-year bonds at an average yield of 4.49%, down from 4.58% at its previous auction of that maturity (Trading Economics). The UK 10-year gilt fell about 5 bp to 5.30%. Japan's 10-year rose about 1 bp to 2.84% the day before the Bank of Japan's decision.
Yield Curve Charts
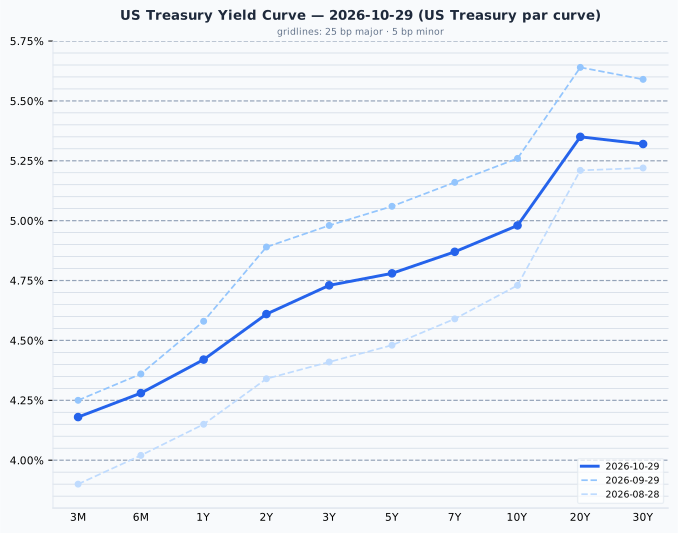
US Treasury par curve, 29 Oct 2026: 3M 4.18%, 6M 4.28%, 1Y 4.42%, 2Y 4.61%, 3Y 4.73%, 5Y 4.78%, 7Y 4.87%, 10Y 4.98%, 20Y 5.35%, 30Y 5.32%; 2-to-10 slope +37 bp. Prior curves: 29 Sep and 28 Aug 2026. The 3-month bill at 4.18% is 30.5 bp above the Fed Funds midpoint of 3.875%.
The US curve rises from 4.18% at three months to 5.35% at 20 years, with the 30-year 3 bp below the 20-year. Against 29 September the curve from two years out is 25 to 29 bp lower (the 2-year by 28 bp, the 10-year by 28 bp, the 30-year by 27 bp), so the 2-to-10 slope is unchanged at 37 bp; the 3-month bill's 30.5 bp gap over the Fed Funds midpoint is consistent with the December rise futures price, since a bill bought on 29 October matures in late January, after the Fed's December meeting.
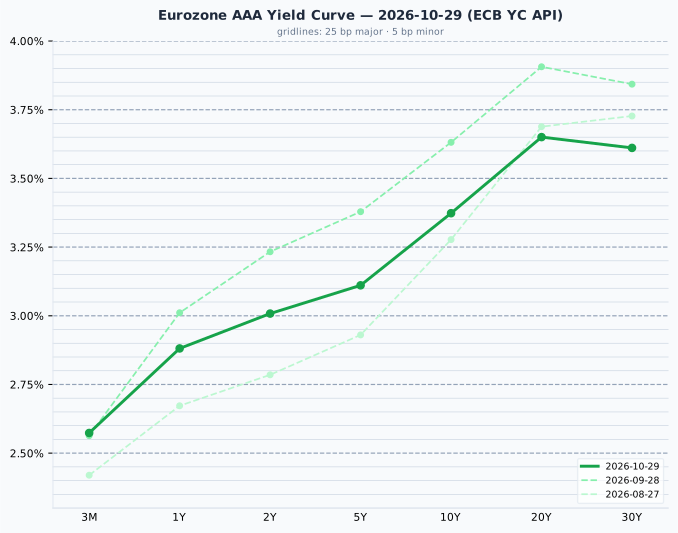
Euro area AAA government curve, 29 Oct 2026 (ECB YC API): 3M 2.57%, 1Y 2.88%, 2Y 3.01%, 5Y 3.11%, 10Y 3.37%, 20Y 3.65%, 30Y 3.61%; 2-to-10 slope +37 bp. Prior curves: 28 Sep and 27 Aug 2026. Day change against the 28 Oct 2026 curve: 3M +2 bp, 1Y −3 bp, 2Y −5 bp, 5Y −4 bp, 10Y −2 bp, 20Y 0 bp, 30Y +0.5 bp.
The euro AAA curve rises from 2.57% at three months to 3.65% at 20 years, with the 30-year 4 bp below the 20-year. After the ECB's hold the curve fell most at two to five years, so its 2-to-10 slope widened about 3 bp on the day, to 37 bp. Against 28 September it is 23 bp lower at two years and 26 bp lower at ten, so the slope has narrowed from 40 bp to 37 bp.
Credit Markets (from FRED - authoritative)
| Market | OAS | Obs. date | vs prior obs | Series ID |
|---|---|---|---|---|
| US Investment Grade | 86 bp | 28 Oct 2026 | −2 bp | BAMLC0A0CM |
| US High Yield | 314 bp | 28 Oct 2026 | −4 bp | BAMLH0A0HYM2 |
| Euro High Yield | 349 bp | 28 Oct 2026 | −13 bp | BAMLHE00EHYIOAS |
Change is 28 Oct 2026 vs 27 Oct 2026. Credit spreads are the 28 October close; today's session is not in them yet.
The extra yield on lower-rated US company bonds over Treasuries narrowed 4 bp to 314 bp on 28 October, the day of the Fed's decision, near the bottom of the normal 300–500 bp range; investment-grade spreads, at 86 bp, are near the bottom of their 80–150 bp range. The euro lower-rated spread narrowed 13 bp to 349 bp the same day. The VIX, the index of expected volatility in the S&P 500, closed at 16.91 on 28 October (FRED VIXCLS), a moderate reading, down from 17.52 on 27 October.
Real Yields (US and Euro Area)
| Region | Nominal 10Y | Expected inflation | Real 10Y | How the real yield is obtained |
|---|---|---|---|---|
| United States | 4.98% (US Treasury par curve, 29 Oct 2026) | 2.35% (residual: nominal − real) | 2.63% (US Treasury real curve, 29 Oct 2026) | Measured. TIPS trade, so the market quotes a real yield directly; expected inflation is the residual (the breakeven) |
| Euro area | 3.37% (ECB YC API, 29 Oct 2026) | 2.04% (ECB SPF, 2026 Q3, measured) | 1.34% (residual: nominal − expected) | Constructed. No euro inflation-linked benchmark is published, so a survey expectation is subtracted from the nominal yield |
Only the US real yield is a market price; the euro figure is derived from a survey and is the softer of the two. Two mismatches apply when comparing them: the US breakeven includes a premium investors demand for inflation risk, which a survey does not, and the survey looks five years ahead against the bond's ten. Both legs are dated 29 October. The 161 bp gap between US and euro nominal 10-year yields splits into 31 bp of expected-inflation difference (2.35% against 2.04%) and 129 bp of real-rate difference (2.63% against 1.34%), figures rounded, so the gap is almost entirely real. The US real yield fell 4 bp on 29 October to 2.63%.
Why the US real-yield advantage is not a return a euro investor can capture
The US real yield has exceeded the euro one in every quarter since 2014, by 1.52 pp on average, and the 129 bp on these figures is under that mean. It is a structural feature (US trend growth, euro-area savings, the scarcity of German government bonds, heavy US government borrowing), not a return a euro-based reader can capture: hedging the currency removes it, because the forward exchange rate is set from the same interest differential, and holding Treasuries unhedged is a bet on the dollar rather than a bond decision. A real yield is real in its own currency; a US real yield of 2.63% is that much above US inflation, which is not a real return for someone who spends euros. The gap is stated here as a description of relative policy stance and growth expectations, and no portfolio conclusion is drawn from it.
Bond Portfolio Implications
A 10 bp rise in yields is an ordinary day's move. At the 29 Oct 2026 par yields it costs:
| Maturity | Yield | Modified duration | Loss for a 10 bp rise | Months of coupon lost |
|---|---|---|---|---|
| 2-year | 4.61% | 1.89 | 0.19% | 0.5 |
| 10-year | 4.98% | 7.80 | 0.78% | 1.9 |
| 30-year | 5.32% | 14.91 | 1.47% | 3.3 |
Months of coupon lost is the loss divided by one month of coupon (yield ÷ 12) on a par bond. Computed from the US Treasury par curve, 29 October.
The 7 bp fall at the 10-year on 29 October returned a holder about 0.55%, or 1.3 months of coupon, more than undoing the 0.47% lost on the 6 bp rise of 28 October.
The 30-year Treasury pays 0.71 pp more than the 2-year for nearly eight times as much price movement per 10 bp. With growth at 3.4%, core inflation at 3.1% and futures expecting a December Fed rise, short maturities keep most of the income with far less exposure to a further rise in yields.
Currencies & Commodities
Currencies (Yahoo Finance live quotes)
| Pair | Rate | Day chg % | Source |
|---|---|---|---|
| EUR/USD | 1.1168 | +0.10% | yfinance (18:02 CET) |
| USD Index (DXY, ICE) | 102.05 | −0.15% | yfinance (17:53 CET) |
| USD/JPY | 157.88 | +0.07% | yfinance (18:03 CET) |
| GBP/USD | 1.3372 | +0.34% | yfinance (18:02 CET) |
| USD/CHF | 0.8260 | −0.20% | yfinance (18:03 CET) |
FX quotes as of 17:53–18:03 CET; day change vs the previous 17:00 ET close.
The dollar eased: the ICE dollar index slipped 0.15% to 102.05, and the euro edged up 0.10% to $1.1168, little changed by an expected ECB decision. The pound gained 0.34% to $1.3372, the largest move in the table, and the Swiss franc 0.20% to 0.8260 per dollar. The yen was nearly unchanged at 157.88 per dollar ahead of the Bank of Japan's decision.
Commodities (Yahoo Finance front-month futures)
| Commodity | Price | Day Chg % | Ticker | Source |
|---|---|---|---|---|
| Brent Crude ($/bbl) | 110.80 | −0.75% | BZ=F | yfinance (BZF27, Jan) |
| WTI Crude ($/bbl) | 102.00 | −0.76% | CL=F | yfinance (CLZ26, Dec) |
| Gold ($/oz) | 4,031.40 | −0.50% | GC=F | yfinance (GCZ26, Dec) |
| Silver ($/oz) | 52.38 | −2.40% | SI=F | yfinance (SIZ26, Dec) |
| Copper ($/lb) | 6.6025 | −1.03% | HG=F | yfinance (HGZ26, Dec) |
| Nat Gas ($/MMBtu) | 2.952 | −2.64% | NG=F | yfinance (NGZ26, Dec) |
Day changes are settlement-to-settlement: 29 Oct 2026 settlement vs 28 Oct 2026 settlement.
Every row shows the same contract as Wednesday's table, so the levels are comparable. Oil gave back part of Wednesday's rise: the January Brent contract (BZF27) settled at $110.80, 0.75% below Wednesday's settlement of $111.64, and the December WTI contract (CLZ26) at $102.00, 0.76% below its $102.78 settlement. ADVFN attributed the fall to renewed diplomatic efforts over Iran (ADVFN). January Brent is 12.13% below the 52-week high of $126.10 set by an earlier contract (range $58.72 to $126.10), and December WTI 14.63% below its $119.48 high (range $54.98 to $119.48). The December WTI contract expires on 20 November, so it is not yet near its roll.
Gold fell 0.50% to $4,031.40, 27.83% below its all-time high of $5,586.20 set on 29 January 2026; silver fell 2.40% to $52.38, 56.82% below its all-time high of $121.30 set the same day. Copper fell 1.03% to $6.6025, slightly below its all-time high of $6.83 set on 22 September, 3.33% below it. Natural gas fell 2.64% to $2.952, in the lower part of its 52-week range of $2.483 to $7.827. US storage rose by 80 billion cubic feet in the week to 23 October, against 75 billion forecast (Trading Economics).
Sector & Theme Highlights
US sector funds (Select Sector SPDRs, 29 Oct close): health care (XLV) led, up 2.40%, followed by real estate (XLRE, +2.21%), consumer staples (XLP, +1.54%), utilities (XLU, +1.53%), financials (XLF, +1.44%), materials (XLB, +1.29%), industrials (XLI, +0.97%), consumer discretionary (XLY, +0.75%) and energy (XLE, +0.38%). Communication services (XLC), which holds Alphabet and Meta, was the weakest, down 1.87%, followed by technology (XLK, −1.18%). Real estate and utilities, whose borrowing-heavy businesses and steady dividends compete with bond income, rose on a day the 10-year yield fell 7 bp, the reverse of Wednesday, when they fell as it rose 6 bp.
- AI spending under scrutiny: Alphabet's 12.64% fall after spending more than its operations brought in, Amazon's fall of about 7% after hours despite 39% cloud growth, Samsung's 4.1% fall despite a record profit, and declines in SMIC and Lenovo in Hong Kong show investors pressing for returns on AI investment; companies selling the equipment did better, with Advantest up about 6% after raising its forecast (Trading Economics; Korea JoongAng Daily; Benzinga).
- Rotation within US shares: money moved from the largest technology companies into health care, real estate, consumer staples, utilities, financials and smaller companies, with the Russell 2000 up 1.01% to its highest since September (Trading Economics; Yahoo Finance).
- Central banks and energy: the ECB held but discussed a rise, with energy prices as the risk it named; Eli Lilly's 6.63% rise on a higher revenue forecast and Caterpillar's 9.25% fall on a cautious fourth-quarter outlook show results driving individual shares more than rates (Trading Economics).
- European company results: Renault rose almost 4% on third-quarter results; TotalEnergies, whose profit also beat forecasts, rose 0.9%, in line with the CAC 40 (Trading Economics).
Top Stories (Global)
- The ECB holds, and Lagarde sets her departure. The deposit rate stays at 2.50%; a rise was discussed but the decision to hold was unanimous, with energy prices named as the main inflation risk (Trading Economics). The ECB said Christine Lagarde will leave on 7 February 2027, before her term ends in October 2027, and the European Council will appoint her successor (investingLive, citing the ECB). German 2-year yields fell about 6 bp to 3.05%.
- Alphabet's worst day on record. The Class A shares fell 12.64% to $283.82 after third-quarter spending exceeded operating cash flow, and the Nasdaq 100 fell 1.38% (Trading Economics; CNBC; The Wall Street Republic).
- Amazon and Intel fall after hours. Amazon's revenue and earnings missed forecasts and it kept its plan to spend about $220 billion this year, mostly on AI, even as its cloud business grew 39%; its shares fell about 7% in extended trading. Intel fell about 16.5% after forecasting fourth-quarter revenue of $15 to $16 billion, below expectations (Benzinga; Forbes; Seeking Alpha).
- US growth at 3.4%. Third-quarter GDP grew at an annualised 3.4%, above the 3.2% forecast, on AI-related business investment; core PCE inflation rose to 3.1% in September, as expected, and jobless claims fell to 194,000 (Trading Economics).
- Samsung's record profit disappoints. Operating profit reached 107.4 trillion won, almost all from chips, but shares fell about 4.1% after the company left further buyback decisions to January; the Kospi fell 1.24% after Wednesday's 6.63% rise (Samsung Electronics; Korea JoongAng Daily).
- European shares rise, the SMI at a record. The DAX gained 1.31% and the CAC 40 1.05%, and the SMI closed at a record 14,756.86.
- Results move US shares. Eli Lilly rose 6.63% after raising its revenue forecast, Merck 3.83% on higher guidance, while Caterpillar fell 9.25% on a cautious outlook (Trading Economics; Yahoo Finance).
- Oil eases. December WTI settled 0.76% lower at $102.00 after Wednesday's 2.88% rise.
Looking Ahead
- Friday 30 October: the Bank of Japan's decision and its quarterly outlook report, with a hold at 1.25% expected (MUFG Research); the first estimate of euro-area third-quarter GDP, expected at 0.2% after 0.6% in the second quarter, and Germany's October flash inflation (FXStreet; Saxo, as cited in the 28 Oct briefing); Tokyo's October inflation and Japan's September industrial production and retail sales, before the Bank of Japan's decision (Trading Economics).
- Further out: Apple reports on 2 November (as cited in the 27 Oct briefing); US midterm elections on 3 November, the same day as the French National Assembly's vote on the 2027 budget's revenue measures; the euro-area flash inflation estimate for October on 4 November; the Bank of England meets on 5 November; Anthropic could begin marketing its listing as soon as the week of 9 November (Bloomberg, via Yahoo Finance, as cited in the 27 Oct briefing); the Bank of Canada's next decision on 9 December; Christine Lagarde leaves the ECB on 7 February 2027.
Market closures - France 1 Nov 2026 (All Saints' Day), a Sunday, so no trading day is lost. - Brazil 2 Nov 2026 (All Souls' Day). - Japan 3 Nov 2026 (Culture Day).
Data sources: US Treasury par and real curves (29 Oct 2026) and FRED (policy rates, VIX, credit spreads, macro); ECB YC API (AAA curve, 29 Oct 2026) and ECB SPF (2026 Q3); equity indices, ETF P/E proxies, commodity futures, US sector funds and individual stock prices at the 29 Oct close, and FX quoted at 17:53–18:03 CET, via Yahoo Finance; European, UK and Japanese bond yields, economic releases and news via web search (Trading Economics, CNBC, investingLive, Samsung Electronics, Korea JoongAng Daily, MoneyToday, Yahoo Finance, MUFG Research, ADVFN, FXStreet, Saxo, Axios, The Wall Street Republic, Benzinga, Forbes, Seeking Alpha, Intel).