2026 07 08
Global Financial Briefing — Wednesday, July 8, 2026
Retrospective briefing — data as of July 8, 2026. Valuation table omitted (trailing P/E not available for past dates).
Market Overview
A geopolitical shock dominated the session. President Trump told the NATO summit in Turkey that the ceasefire with Iran was "over," and the US resumed strikes, sending crude oil sharply higher — WTI +4.37% to $73.52/bbl and Brent +5.21% to $78.02/bbl (yfinance BZ=F; wire reports cited a slightly different Brent settle of $78.19, +5.43%, a normal variance in front-month futures reporting). The resulting risk-off move hit equities broadly: the Dow fell 1.09% to 52,348.39 and Europe was hit hardest among developed markets — the DAX -2.23%, CAC 40 -2.18%, FTSE 100 -1.66%, STOXX 600 -1.61%. The S&P 500 was more muted at -0.28% to 7,482.71, and the Nasdaq 100 actually rose 0.27%, cushioned by chip/AI strength (Nvidia +3.7%, Broadcom +4.8% on Apple's >$30bn multi-year custom-silicon deal) — a clear divergence between mega-cap tech resilience and broader risk aversion.
Asia-Pacific bore the brunt of the sell-off: South Korea's Kospi collapsed 5.35% to 7,246.79, the worst move of any major index today, while Japan's Nikkei 225 fell 2.11% and India's Nifty 50 dropped 2.12%. Hong Kong's Hang Seng was the notable outlier, rallying 2.99% against the regional grain. Bond markets reacted in real time even where US data lagged: UK 10-year gilt yields jumped to 4.95% — the highest since June — as traders priced in BOE rate-hike bets tied to the oil spike, and Japan's 10-year JGB yield pushed to a roughly 30-year high near 2.865% on inflation and fiscal-health concerns.
Data-lag note: Several FRED daily market series (US Treasury yields, VIX, credit spreads, DFF) had not yet posted for July 8 and are shown dated July 7 — one business day before the Iran/oil shock. Treat the VIX (16.13) and credit-spread readings below as pre-shock levels; they do not yet reflect today's volatility. Equity indices, commodities, and FX figures below (from yfinance and web search) do reflect the July 8 close/session.
Global Indices Snapshot
All markets in the regions below were open on July 8, 2026 (no holiday closures per the holiday calendar); all levels reflect the July 8 close.
Americas
| Index | Level | Day Chg | Day Chg % | Source |
|---|---|---|---|---|
| S&P 500 | 7,482.71 | -21.14 | -0.28% | yfinance ^GSPC |
| Nasdaq 100 | 29,252.56 | +79.54 | +0.27% | yfinance ^NDX |
| Dow Jones | 52,348.39 | -576.76 | -1.09% | yfinance ^DJI |
| Brazil IBOV | 170,654.00 | -1,367.00 | -0.79% | yfinance ^BVSP |
Europe
| Index | Level | Day Chg | Day Chg % | Source |
|---|---|---|---|---|
| Euro STOXX 600 | 635.91 | -10.38 | -1.61% | yfinance ^STOXX |
| Euro STOXX 50 | 6,204.91 | -114.95 | -1.82% | yfinance ^STOXX50E |
| CAC 40 | 8,252.66 | -183.58 | -2.18% | yfinance ^FCHI |
| DAX | 24,897.45 | -567.80 | -2.23% | yfinance ^GDAXI |
| FTSE 100 | 10,489.00 | -176.90 | -1.66% | yfinance ^FTSE |
| SMI (Swiss) | 14,174.35 | -186.10 | -1.30% | yfinance ^SSMI |
Asia-Pacific
| Index | Level | Day Chg | Day Chg % | Source |
|---|---|---|---|---|
| Nikkei 225 | 66,819.05 | -1,437.91 | -2.11% | yfinance ^N225 |
| Hang Seng | 24,199.46 | +702.57 | +2.99% | yfinance ^HSI |
| Shanghai Comp | 3,970.88 | -19.36 | -0.49% | yfinance 000001.SS |
| ASX 200 | 8,785.10 | -18.80 | -0.21% | yfinance ^AXJO |
| Kospi (Korea) | 7,246.79 | -409.52 | -5.35% | yfinance ^KS11 |
Emerging Markets
| Index | Level | Day Chg % | Source |
|---|---|---|---|
| MSCI EM (EEM) | 66.23 | +0.78% | yfinance EEM |
| India Nifty 50 | 23,882.05 | -2.12% | yfinance ^NSEI |
| South Africa (EZA) | 62.69 | -1.42% | yfinance EZA |
Index Levels & Risk Context (P/E table omitted)
Live trailing P/E is not retrievable for past dates (yfinance .info fields only reflect the current moment), so the valuation table and the Equity Risk Premium calculation below are omitted. What is available from the price history:
- S&P 500: 7,482.71 is -1.8% below its all-time high of 7,620.90, and sits above both its 50-day (7,417.00) and 200-day (6,956.33) moving averages — the index remains in an established uptrend despite today's pullback.
- Nasdaq 100: 29,252.56 is -4.9% below its ATH of 30,762.20, similarly above its 50-day (29,285.28, essentially at it) and 200-day (26,168.37) averages.
- Dow Jones: 52,348.39 is -1.8% below its ATH of 53,289.30.
- DFII10 (10Y TIPS real yield): 2.30% (FRED, 2026-07-07) — historically high in absolute terms (versus near-zero/negative real yields through much of the 2010s–early 2020s), meaning long-duration Treasuries currently offer a meaningfully positive real return, a genuine competitor to equities even without a computed ERP.
Disclaimer: This is financial information, not personalised investment advice. Past valuations do not guarantee future returns. Consult a financial advisor before investing.
US Economic Indicators (FRED — authoritative)
| Indicator | Current | Prior | Delta | Reference Date | FRED Series |
|---|---|---|---|---|---|
| CPI YoY % | 4.17% | — | — | 2026-05 (April CPI, released May) | CPIAUCSL |
| Core CPI YoY % | 2.82% | — | — | 2026-05 (April CPI, released May) | CPILFESL |
| Unemployment Rate | 4.2% | 4.3% | -0.1pp | 2026-06 (May report) | UNRATE |
| Nonfarm Payrolls | 158,984k | 158,927k | +57k | 2026-06 (May report) | PAYEMS |
| 10Y TIPS Real Yield | 2.30% | — | — | 2026-07-07 | DFII10 |
Note: CPI/Core CPI were fetched as pre-computed year-over-year % change (FRED units=pc1), so no separate prior-period YoY figure is shown.
Fixed Income & Bond Analysis
All US Treasury yields from FRED (dated 2026-07-07, one day lagged — see data-lag note above). European/UK/Japan yields from the ECB YC API and web search.
Policy Rates
| Central Bank | Rate | Source |
|---|---|---|
| Fed Funds (upper) | 3.75% | FRED DFEDTARU |
| Fed Funds (lower) | 3.50% | FRED DFEDTARL |
| Effective FFR | 3.63% | FRED DFF (2026-07-07) |
| ECB Deposit Rate | 2.25% | FRED ECBDFR (2026-07-08) |
| BOJ Policy Rate | 1.00% | web search (hiked to 1.00% on 2026-06-16, highest since 1995) |
| BOE Bank Rate | ~3.73% | FRED IUDSOIA/SONIA proxy (2026-07-06, 2-day lag) |
Government Bond Yields
| Country | 2Y Yield | 10Y Yield | 30Y Yield | Source |
|---|---|---|---|---|
| USA | 4.19% | 4.55% | 5.05% | FRED (2026-07-07) |
| Euro Area AAA (ECB) | 2.53% | 3.06% | 3.56% | ECB YC API (2026-07-07, nearest prior business day) |
| UK | ~4.35% (derived) | 4.95% | (not retrieved) | web search |
| Japan | (not retrieved) | 2.865% | (not retrieved) | web search |
| France (OAT) | (not retrieved) | (not retrieved) | (not retrieved) | skipped — ECB API covered the euro AAA curve |
| Italy (BTP) | (not retrieved) | (not retrieved) | (not retrieved) | skipped — ECB API covered the euro AAA curve |
Yield Curve Spreads (FRED, 2026-07-07): - 10Y-2Y spread: +35 bps — positive and outside the flat band (±25 bps), but well short of a historically steep curve (~75 bps+); no inversion, no recession signal. - 10Y-3M spread: +69 bps — positive, consistent with the 2Y spread; no inversion warning.
OAT-Bund spread not available today: the euro-area AAA curve stands in for the region, and it carries no France or Italy specific instrument for the spread calculation.
Yield Curve Charts
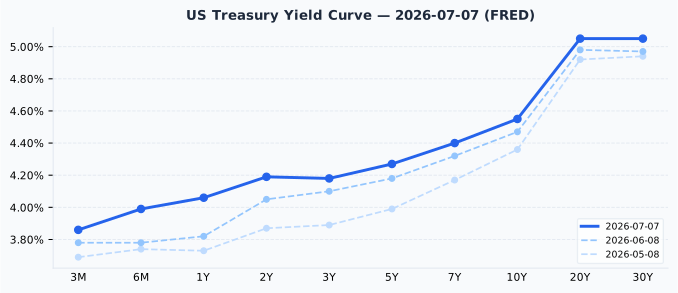
The US curve is upward-sloping across the full 3M–30Y span with no inversion, consistent with the positive 10Y-2Y and 10Y-3M spreads above. Versus one month prior (2026-06-08), the 2-year yield rose more (+14 bps, to 4.19%) than the 10-year (+8 bps, to 4.55%), so the curve flattened modestly (2s10s narrowed from ~42 bps to ~36 bps) over the past month.
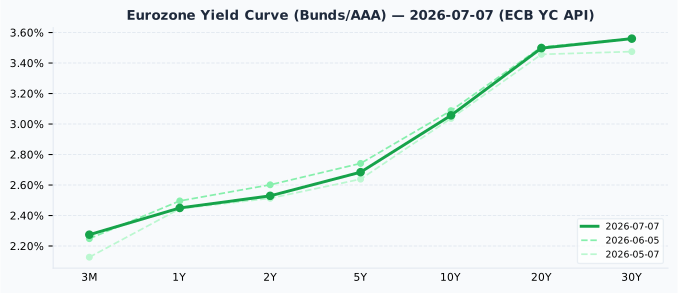
The euro-area AAA curve is also upward-sloping with no inversion. Versus one month prior (2026-06-05), the 2-year fell more (-7 bps, to 2.53%) than the 10-year (-3 bps, to 3.06%), so the curve steepened slightly at the front end over the past month — a modest easing-expectations signal relative to the long end.
Credit Markets (from FRED — authoritative, dated 2026-07-07)
| Market | OAS Spread | Series ID |
|---|---|---|
| US Investment Grade | 76 bps | BAMLC0A0CM |
| US High Yield | 267 bps | BAMLH0A0HYM2 |
| Euro High Yield | 258 bps | BAMLHE00EHYIOAS |
Both US IG (76 bps, below the typical 80-150 bps normal range) and US HY (267 bps, below the typical 300-500 bps normal range) are historically tight — but note these readings are dated July 7, the day before the Iran/oil shock, so they reflect pre-event complacency rather than the market's actual reaction to today's news. Spreads may reprice wider once July 8 data posts.
Bond Portfolio Implications
With trailing P/E unavailable, the Equity Risk Premium (earnings yield − DGS10) cannot be computed. What can be said: the 10Y TIPS real yield of 2.30% is historically elevated, so long-duration Treasuries are offering investors a genuinely positive inflation-adjusted return — a meaningful opportunity cost against holding equities, independent of the ERP calculation. Duration risk remains material: a 100 bp rise in yields would imply roughly an 8-9% price loss on a 10-year bond.
Currencies & Commodities
Currencies:
| Pair | Rate | Source |
|---|---|---|
| EUR/USD | 1.1448 (2026-07-02, stale) | FRED DEXUSEU |
| USD Index | 120.69 (2026-07-02, stale) | FRED DTWEXBGS |
| USD/JPY | 161.34 | web search |
| GBP/USD | 1.3385 | web search |
| USD/CHF | 0.8076 | web search |
EUR/USD and the broad USD index are the most recent FRED observations available (2026-07-02) — six days stale relative to the July 8 target date; FRED's DEXUSEU/DTWEXBGS series post with a longer lag than the daily Treasury series. USD/JPY sat near a roughly four-decade weak level for the yen with no observed BOJ intervention.
Commodities (all from yfinance front-month futures):
| Commodity | Price | Day Chg % | Ticker | Source |
|---|---|---|---|---|
| Brent Crude | $78.02/bbl | +5.21% | BZ=F | yfinance |
| WTI Crude | $73.52/bbl | +4.37% | CL=F | yfinance |
| Gold ($/oz) | $4,070.90 | -1.79% | GC=F | yfinance |
| Silver ($/oz) | $58.164 | -4.54% | SI=F | yfinance |
| Copper ($/lb) | $6.0545 | -1.90% | HG=F | yfinance |
| Nat Gas ($/MMBtu) | $3.212 | -1.62% | NG=F | yfinance |
Gold and silver both fell despite the geopolitical flare-up — an unusual muted/negative "safe haven" response, likely reflecting real-yield dynamics rather than a genuine risk appetite for the metals. Gold at $4,070.90 is 27.1% below its all-time high of $5,586.20 (also its 52-week high, meaning the ATH was set within the past year). Silver at $58.164 is 52.0% below its all-time high of $121.30. Copper at $6.0545 is 9.0% below its ATH of $6.6525 — a moderate, not "near-high," gap. WTI and Brent both remain far below their historical peaks (roughly -50% and -47% below ATH respectively) despite today's sharp spike; the oil ATHs date to a much earlier period and are not indicative of current market conditions. Natural gas at $3.212 is deeply below its $15.78 ATH (-80%), a legacy peak from an earlier extreme spike with limited relevance today.
Sector & Theme Highlights
AI/semiconductors vs. geopolitical risk-off was today's defining cross-market tension. Nvidia (+3.7%) and Broadcom (+4.8%) rallied on Apple's reported >$30bn multi-year custom-silicon commitment, helping the Nasdaq 100 post a positive day even as the broader market sold off — a reminder that idiosyncratic AI-driven demand is currently strong enough to offset a geopolitical shock at the mega-cap level. Energy was the session's other clear theme: the renewed US-Iran conflict drove a >4-5% single-day spike in both crude benchmarks, which likely supported energy-sector equities even as broader indices fell (no sector-level equity data is available here to confirm the magnitude). Rates markets outside the US moved faster than US data could confirm: UK gilts and Japanese JGBs both sold off on the same oil-driven inflation/rate-hike logic, showing the shock propagating through global fixed income in real time.
Top Stories (Global)
- Trump told the NATO summit in Turkey that the ceasefire with Iran is "over"; the US resumed strikes, and oil surged — the day's dominant macro driver. (Yahoo Finance)
- US equities were mixed: Dow -1.09% to 52,348.39, S&P 500 -0.28% to 7,482.71, Nasdaq Composite +0.2% — energy/geopolitical drag on the Dow offset by AI-chip strength lifting the Nasdaq. (CNBC)
- WTI crude +4.37% to $73.52/bbl and Brent +5.2-5.4% to ~$78/bbl on renewed US-Iran hostilities — the sharpest single-day commodity move of the day. (Yahoo Finance)
- Asia-Pacific broadly lower: Kospi -5.35% (worst major-index move of the day), Nikkei 225 -2.11%, ASX 200 -0.21%; Hang Seng defied the trend, +2.99%. (Yahoo Finance)
- Nvidia +3.7% and Broadcom +4.8% after Apple committed to a multi-year custom-component deal reportedly worth over $30bn. (Yahoo Finance)
- UK 10-year gilt yield rose to 4.95% — highest since June 2026 — as traders priced in BOE rate-hike risk tied to the oil spike. (web search)
- Japan's 10-year JGB yield pushed to a roughly 30-year high near 2.865% on inflation and fiscal-health concerns. (web search)
- FOMC minutes were released on July 8, with markets parsing them for signals on the Fed's forward rate path (specific content not covered here). (web search)
Sources: - Stock Market Today, July 8: Stocks Slide and Dow Drops 1.5% as Middle East Tensions Spike - Stock market today: Live updates - Stock market today: Nasdaq rises, Dow and S&P 500 retreat as oil prices climb on renewed US-Iran tensions - Bank of Japan hikes rates to 1%, highest since 1995
Looking Ahead
- No market closures found in the next 5 calendar days (July 9-13, 2026) across the tracked countries (US, GB, DE, FR, JP, AU, CH, CA, KR, BR — India holiday data unavailable).
- The next upcoming closure just beyond that window is Bastille Day in France (Tuesday, July 14, 2026).
- FOMC minutes were released July 8; watch for follow-through commentary from Fed officials in the coming days.
- Ongoing to monitor: any further escalation or de-escalation in the US-Iran conflict, which is currently the dominant driver of oil prices and global risk sentiment.