2026 07 09
Global Financial Briefing — Thursday, 9 July 2026
Market Overview
Risk appetite is holding up better than the headlines suggest. Overnight, the US launched fresh airstrikes on Iran and Tehran retaliated against Gulf states, yet US equities closed higher (S&P 500 +0.81%, Nasdaq 100 +1.62%, Dow +0.27%), suggesting markets treated the escalation as contained rather than a broad-based shock. Oil, which spiked 4-5% on Wednesday on the initial conflict headlines, is giving some of that back today (WTI -1.69%, Brent -1.41%), consistent with a "spike-then-fade" pattern rather than a sustained supply shock.
The VIX sits at 16.90 (FRED VIXCLS, 2026-07-08) — a moderate reading, not a complacent one, but well short of the 20-30 range that would signal elevated stress — reinforcing that equity markets are treating the Iran escalation as a contained, not systemic, risk for now.
European equities closed broadly higher today (STOXX 600 +0.77%, CAC 40 +0.90%, DAX +0.83%, SMI +0.29%), with FTSE 100 the lone laggard (-0.16%). Underneath the calm equity tape, European fixed income is sending a more nuanced signal: German Bund yields dipped on safe-haven demand tied to the Middle East, even as French OAT yields pushed to 3.75% — the highest since May — widening the OAT-Bund spread to roughly 84 bps, a fresh reminder that French fiscal/political risk remains a live theme independent of the geopolitical backdrop.
Asia-Pacific was mixed: Nikkei 225 (+1.38%) and Shanghai Composite (+1.66%) led gains, while Hang Seng (-0.70%) and ASX 200 (-0.26%) lagged. Japan continues to be a standout fixed-income story — the 10-year JGB yield has climbed to 2.82%, its highest since 1997, as the BOJ presses on with policy normalization after hiking to 1% in June, with one former BOJ official suggesting rates could ultimately move above 2%. Combined with a weaker yen (USD/JPY ~162.4), this keeps Japanese rate and currency risk firmly on the radar for global allocators.
Global Indices Snapshot
Americas
Americas data reflects today's close (9 Jul).
| Index | Level | Day Chg | Day Chg % | Source |
|---|---|---|---|---|
| S&P 500 | 7,543.64 | +60.93 | +0.81% | yfinance ^GSPC |
| Nasdaq 100 | 29,727.10 | +474.54 | +1.62% | yfinance ^NDX |
| Dow Jones | 52,487.41 | +139.02 | +0.27% | yfinance ^DJI |
| Brazil IBOV | 172,742.00 | +2,088.00 | +1.22% | yfinance ^BVSP |
Cross-check: FRED SP500 last close was 7,482.71 (2026-07-08).
Europe
European data reflects today's close (9 Jul).
| Index | Level | Day Chg | Day Chg % | Source |
|---|---|---|---|---|
| Euro STOXX 600 | 640.81 | +4.90 | +0.77% | yfinance ^STOXX |
| CAC 40 | 8,326.68 | +74.02 | +0.90% | yfinance ^FCHI |
| DAX | 25,104.12 | +206.67 | +0.83% | yfinance ^GDAXI |
| FTSE 100 | 10,472.08 | -16.96 | -0.16% | yfinance ^FTSE |
| SMI (Swiss) | 14,215.30 | +40.95 | +0.29% | yfinance ^SSMI |
Asia-Pacific
Asia-Pacific data reflects today's close (9 Jul).
| Index | Level | Day Chg | Day Chg % | Source |
|---|---|---|---|---|
| Nikkei 225 | 67,743.85 | +924.80 | +1.38% | yfinance ^N225 |
| Hang Seng | 24,030.18 | -169.28 | -0.70% | yfinance ^HSI |
| Shanghai Comp | 4,036.59 | +65.71 | +1.66% | yfinance 000001.SS |
| ASX 200 | 8,762.50 | -22.60 | -0.26% | yfinance ^AXJO |
| Kospi (Korea) | 7,291.91 | +45.12 | +0.62% | yfinance ^KS11 |
Emerging Markets
| Index | Level | Day Chg % | Source |
|---|---|---|---|
| MSCI EM (EEM) | 66.78 | +0.83% | yfinance EEM |
| India Nifty 50 | 23,962.80 | +0.34% | yfinance ^NSEI |
| South Africa | 63.28 | +0.94% | yfinance EZA |
None of the tracked indices are within 0.5% of their all-time high today; the closest is the S&P 500, roughly 1.0% below its record of 7,620.90.
Index Valuations & Investment Risk
Valuation Table
| Index | Trailing P/E (live) | Hist avg trailing P/E (†) | Premium/discount |
|---|---|---|---|
| S&P 500 | 26.98x | ~16-18x | +58.7% |
| Nasdaq 100 | 32.02x | ~25-30x | +16.4% |
| Euro STOXX 600 | 18.31x | ~15-17x | +14.4% |
| CAC 40 | 17.42x | ~14-16x | +16.1% |
| DAX | 18.33x | ~15-17x | +14.6% |
| FTSE 100 | 17.69x | ~13-15x | +26.4% |
| Nikkei 225 | 22.82x | ~20-22x | +8.7% |
| MSCI EM | 17.23x | ~13-15x | +23.1% |
(†) Hist avg trailing P/E: static long-run reference constants. Live figures sourced from yfinance trailingPE on ETF proxies (SPY, QQQ, EXSA.DE, CAC.PA, EXS1.DE, ISF.L, 1321.T, EEM). Premium/discount computed vs the historical range midpoint; bold = more than 20% above historical average.
The S&P 500's ~59% premium to its long-run average trailing P/E is the standout figure in this table — historically stretched by any reasonable definition, though multiples this high have persisted for extended periods when earnings growth (especially from AI-linked megacaps) has kept pace.
Investment Risk Assessment for ETF Investors
United States (S&P 500 / Nasdaq ETFs) SPY's trailing P/E of 26.98x gives an earnings yield of (1÷26.98) = 3.71%. Against the 10-year Treasury yield of 4.55% (FRED DGS10, 2026-07-07), the S&P 500's Equity Risk Premium is -0.84% — negative, meaning Treasuries currently out-yield the average S&P 500 earnings stream. This is a genuine caution signal, not a green light: historically, a negative or sub-1% ERP has preceded below-average forward equity returns. The S&P 500 sits roughly 1.0% below its all-time high and is trading above both its 50-day (7,424.4) and 200-day (6,960.7) moving averages, confirming an intact uptrend even as valuation looks rich. The 10Y TIPS real yield of 2.30% (FRED DFII10) reinforces the point — a historically high real risk-free rate is a headwind for further multiple expansion, and concentration in a handful of AI-linked megacaps remains the single largest idiosyncratic risk to the index.
Europe (STOXX 600 / CAC 40 / DAX ETFs) EXSA.DE's trailing P/E of 18.31x gives an earnings yield of (1÷18.31) = 5.46%. Against the German 10-year Bund yield of 3.06% (web search, 2026-07-09), the Euro ERP is +2.40% — comfortably positive, and a meaningful gap versus the US figure. On a relative basis, US equities trade at roughly a 47% P/E premium to European equities (26.98x vs 18.31x), among the widest such gaps in recent years. For non-EUR investors, currency risk cuts both ways: EUR/USD at 1.1448 (FRED DEXUSEU, 2026-07-02) has been relatively stable, but French political/fiscal risk (OAT-Bund spread at ~84 bps, near its widest since last October) is a euro-area-specific tail risk worth monitoring, particularly for CAC 40-heavy exposure.
Japan (Nikkei / TOPIX ETFs) The Nikkei's trailing P/E of 22.82x is only modestly above its historical range, but the more important story is on the rates side: the BOJ raised its policy rate to 1% on 16 June 2026 (highest since 1995) and one former BOJ official has floated a path above 2%. JGB 10-year yields at 2.82% (highest since 1997) and a weaker yen (USD/JPY ~162.4) mean currency-hedged vs unhedged Nikkei exposure is now a materially different bet than it was a year ago — unhedged USD-based investors have been implicitly short the yen through this normalization cycle.
Emerging Markets (MSCI EM ETFs) EEM's trailing P/E of 17.23x is actually above its historical range (+23.1%), a reversal of the traditional EM valuation discount to developed markets. China (via Shanghai Composite, +1.66% today) and India (Nifty 50, +0.34%) remain the largest swing factors within the index; South Africa (EZA, +0.94%) continues to trade well below its 52-week high.
Overall Risk Score (qualitative, not financial advice): High valuation risk / low margin of safety in the US, driven by a near-60% P/E premium to history and a negative equity risk premium. Europe screens more attractively on both metrics (moderate premium, positive ERP), though French fiscal risk is a real offsetting factor. Japan and EM require currency and rate-path awareness more than pure valuation caution.
Disclaimer: This is financial information, not personalised investment advice. Past valuations do not guarantee future returns. Consult a financial advisor before investing.
US Economic Indicators (FRED - authoritative)
| Indicator | Current | Prior | Delta | Reference Date | FRED Series |
|---|---|---|---|---|---|
| CPI YoY % | 4.17% | — | — | May 2026 | CPIAUCSL |
| Core CPI YoY % | 2.82% | — | — | May 2026 | CPILFESL |
| Unemployment Rate | 4.2% | 4.3% | -0.1pp | June 2026 | UNRATE |
| Nonfarm Payrolls | 158,984k | 158,927k | +57k | June 2026 | PAYEMS |
| 10Y TIPS Real Yield | 2.30% | — | — | July 2026 | DFII10 |
Headline CPI YoY at 4.17% is well above the Fed's 2% target and has been trending up over the past several prints (2.39% in Jan → 4.17% in May), a meaningfully more inflationary backdrop than a year ago. Core CPI at 2.82% is stickier but rising more gradually. The labor market continues to soften only modestly — unemployment ticked down to 4.2% and payrolls added 57k jobs in June, consistent with a gradual-cooling rather than a sharp-deterioration narrative.
Other economic releases today: US June existing home sales are scheduled for release today; specific actual/consensus figures were not yet available.
Fixed Income & Bond Analysis
Policy Rates
| Central Bank | Rate | Source |
|---|---|---|
| Fed Funds (upper) | 3.75% | FRED DFEDTARU |
| Fed Funds (lower) | 3.50% | FRED DFEDTARL |
| Effective FFR | 3.63% | FRED DFF |
| ECB Deposit Rate | 2.25% | FRED ECBDFR |
| BOJ Policy Rate | 1.00% | web search (hiked 2026-06-16, highest since 1995) |
| BOE Bank Rate | 3.73% | FRED IUDSOIA (SONIA proxy) |
Government Bond Yields
| Country | 2Y Yield | 10Y Yield | 30Y Yield | Source |
|---|---|---|---|---|
| USA | 4.19% | 4.55% | 5.05% | FRED (2026-07-07) |
| Germany | 2.68% | 3.06% | (not retrieved) | web |
| France | (not retrieved) | 3.75% | (not retrieved) | web |
| UK | (not retrieved) | 4.95% | (not retrieved) | web |
| Japan | (not retrieved) | 2.82% | (not retrieved) | web |
| Italy | (not retrieved) | 3.87% (2026-07-08) | (not retrieved) | web |
Yield Curve Spreads (FRED pre-computed): - 10Y-2Y spread: +35 bps (FRED T10Y2Y, 2026-07-08) — positive and no longer inverted, but well short of the ~75bps that would characterize a genuinely "steep" curve. Best read as a normalizing curve, not yet signalling either recession fear or strong reflation. - 10Y-3M spread: +69 bps (FRED T10Y3M, 2026-07-08) — also positive; the classic recession-predictor spread is no longer flashing a warning, a meaningful shift from the inversions seen earlier in this cycle.
OAT-Bund Spread: ~84 bps (French 10Y OAT minus German 10Y Bund) — near its widest since last October, and the single clearest market-based read on French fiscal/political risk right now.
Yield Curve Chart
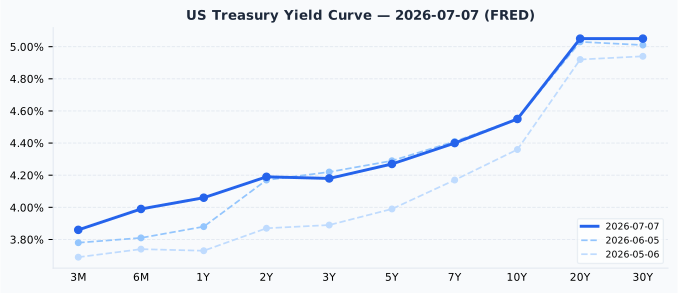
The US curve is upward-sloping and modestly positive across its length (front-end near 3.9%, long-end near 5.05%), consistent with a market pricing a "higher for longer" Fed rather than imminent cuts. Versus a month ago (2026-06-05), short-end yields (3M-1Y) have risen 8-18 bps while the long end (20Y-30Y) is little changed, a mild bear-flattening of the front end that is consistent with reduced near-term rate-cut expectations rather than a growth scare.
Note: the ECB AAA yield curve API was unavailable today and the fallback web search returned only two German Bund maturities (2Y, 10Y) rather than the full curve, so the Eurozone yield curve chart is omitted rather than interpolated across the missing points.
Credit Markets (from FRED — authoritative)
| Market | OAS Spread | Series ID |
|---|---|---|
| US Investment Grade | 76 bps | BAMLC0A0CM |
| US High Yield | 267 bps | BAMLH0A0HYM2 |
| Euro High Yield | 258 bps | BAMLHE00EHYIOAS |
All three spreads sit below their respective long-run "normal" bands (IG: 80-150bps; HY: 300-500bps), which reads as historically tight credit conditions — the market is pricing very little default/credit risk premium right now. Tight spreads like these typically reflect strong risk appetite and ample liquidity; they are not a stress signal today, but they do mean credit offers little compensation for a growth or geopolitical shock, and would be among the first places to watch for repricing if the Iran conflict escalates further.
Bond Portfolio Implications
With the S&P 500 ERP at -0.84% and the 10Y TIPS real yield at 2.30%, high-quality bonds are arguably more attractively priced than US large-cap equities on a pure income basis for the first time in a while — a genuine shift from the last several years' TINA ("there is no alternative") dynamic. Duration risk remains real: a 100bp rise in yields would imply roughly an 8-9% price decline on a 10-year Treasury. Given tight credit spreads offer little extra yield for extra risk, a barbell of short-duration Treasuries (capturing the ~3.9-4.2% front end) plus selective long-duration exposure (for convexity if growth disappoints) looks more balanced than a large high-yield credit overweight right now.
Currencies & Commodities
Currencies:
| Pair | Rate | Source |
|---|---|---|
| EUR/USD | 1.1448 (2026-07-02) | FRED DEXUSEU |
| USD Index | 120.69 (2026-07-02) | FRED DTWEXBGS |
| USD/JPY | 162.37 | web search (2026-07-09) |
| GBP/USD | ~1.339 (2026-07-06, stale) | web search |
| USD/CHF | (not found - omitted) | web search |
Commodities (all from yfinance front-month futures):
| Commodity | Price | Day Chg % | Ticker | Source |
|---|---|---|---|---|
| Brent Crude | $76.92 | -1.41% | BZ=F | yfinance |
| WTI Crude | $72.28 | -1.69% | CL=F | yfinance |
| Gold ($/oz) | $4,137.50 | +1.35% | GC=F | yfinance |
| Silver ($/oz) | $60.78 | +3.82% | SI=F | yfinance |
| Copper ($/lb) | $6.27 | +2.60% | HG=F | yfinance |
| Nat Gas ($/MMBtu) | $3.03 | -5.64% | NG=F | yfinance |
Gold at $4,137.50 is 25.9% below its all-time high of $5,586.20 — a meaningful gap, not "near record" territory despite today's 1.35% gain. Silver at $60.78 is 49.9% below its all-time high of $121.30. WTI and Brent are both giving back a portion of Wednesday's Iran-driven spike (roughly 45-51% below their 2008-era all-time highs, for context, though that comparison is of limited relevance given the different market structure at the time). Natural gas's -5.6% move is the sharpest of the group, unwinding recent geopolitical risk premium as fears of a broader supply disruption ease.
Crypto: No moves exceeding the 3% notability threshold were surfaced in today's search; omitted.
Sector & Theme Highlights
Energy and Health Care led US sector performance today, consistent with the Iran-conflict/oil-price theme (Energy Select Sector SPDR +2.8% on Wednesday) and a defensive rotation (Health Care +1.5%). AI-linked megacaps continue to be the marginal driver of Nasdaq strength, a now well-worn theme but one still doing the heavy lifting for index-level returns. In fixed income, the two dominant cross-market threads are (1) BOJ policy normalization pushing JGB yields to three-decade highs, and (2) French fiscal/political risk keeping the OAT-Bund spread elevated — both are idiosyncratic, country-specific stories rather than a shared global driver, which is itself informative about how fragmented rates markets currently are.
Top Stories (Global)
- US launched fresh airstrikes on Iran overnight; Tehran retaliated against Gulf states, keeping geopolitical risk elevated even as equities largely shrugged it off intraday.
- Oil prices are unwinding a large portion of Wednesday's 4-5% Iran-driven spike, with WTI and Brent both down today — a "fade" pattern rather than a sustained supply-shock repricing.
- German Bund yields dipped on safe-haven flows tied to Middle East tensions, even as French OAT yields rose to a post-May high, widening the OAT-Bund spread to ~84 bps.
- Japan's 10-year JGB yield hit its highest level since 1997 as the BOJ continues policy normalization following its June rate hike to 1%; a former BOJ official suggested the policy rate could eventually clear 2%.
- UK 10-year Gilt yields rose to their highest since June 2026, at 4.95%.
- PepsiCo (PEP) earnings and US existing home sales data are both due today, alongside the ongoing Q2 earnings season backdrop.
- S&P 500 trailing P/E (26.98x, via SPY) now sits roughly 59% above its long-run historical average, alongside a negative US equity risk premium — the valuation backdrop remains the key structural risk for US equity investors independent of today's news flow.
Looking Ahead
- Market closures: France observes Bastille Day (Fête nationale) on Tuesday, 14 July 2026 — Euronext Paris will be closed. No other closures across US, UK, Germany, Japan, Australia, Switzerland, Canada, Korea, or Brazil are scheduled in the next 5 calendar days (India holiday data was unavailable).
- Earnings: PepsiCo (PEP) reports today; broader Q2 earnings season continues to ramp up over the coming days.
- Economic data: US existing home sales (June) due today.
- Central banks: Watch for any follow-through commentary from BOJ officials on the pace of further rate hikes, given yesterday's remarks about a potential move above 2% policy rate.
- Geopolitical: The US-Iran conflict is the dominant event risk to monitor — further escalation (or a de-escalation/ceasefire signal) would likely be the single biggest near-term swing factor for oil prices and risk sentiment globally.