2026 07 06
Global Financial Briefing — Monday, 6 July 2026
Market Overview
Global markets are broadly risk-on to start the week, though the tone diverges sharply by geography and by index construction. US large caps are firmly higher intraday — the Dow up 0.02% to 52,912.01 (still 0.3% below its 52-week high of 53,052.70), the S&P 500 up 0.66% to 7,532.88 (1.2% below its 52-week high of 7,620.90), and the Nasdaq 100 up a stronger 1.42% to 29,746.13 (3.3% below its 52-week high of 30,762.20). FRED's SP500 close from 2 July, 7,483.24, confirms the multi-day uptrend, though none of the three indices is currently at a fresh 52-week high. The catalyst is a sharply weaker-than-expected June US jobs report — nonfarm payrolls rose just 57,000 (FRED PAYEMS, 2026-06-01) against a ~117,000 consensus — which markets are reading as reducing the odds of further near-term Fed tightening even as headline CPI has reaccelerated to 4.17% YoY (FRED CPIAUCSL, 2026-05-01). That combination (soft jobs, still-hot inflation) is an unusual one for equities to rally into, and it shows up in the VIX sitting at a moderate 15.81 (FRED VIXCLS, 2026-07-03) rather than a complacent sub-13 reading.
Europe closed modestly lower across the board on the day (STOXX 600 -0.35%, CAC 40 -0.33%, FTSE 100 -0.26%, SMI -0.85%), with the DAX the lone gainer (+0.15%) — a fairly muted, directionless session compared to the US. Asia-Pacific was mixed: Hang Seng (+1.14%) and India's Nifty 50 (+0.66%) led gains, while the Nikkei 225 was roughly flat (-0.01%) and Kospi lagged (-0.46%). Japan continues to digest the Bank of Japan's historic rate hike to 1.00% on 16 June — the highest level since 1995 — with more hikes flagged toward a ~2% neutral rate.
The bigger structural story is valuation and rates. US equities are trading at a trailing P/E of 26.9x for the S&P 500 (SPY proxy) and 33.2x for the Nasdaq 100 (QQQ proxy) — both well above long-run historical averages — while the 10-Year Treasury yield sits at 4.48% (FRED DGS10, 2026-07-01). That combination pushes the S&P 500's equity risk premium into negative territory (see Bond Portfolio Implications below), a genuine caution signal even as credit markets remain remarkably calm: US high-yield spreads at 275 bps and investment-grade at 75 bps are both historically tight, signalling continued risk-on complacency in credit even as equity valuations stretch.
Global Indices Snapshot
Americas
All markets open. Americas figures below are from the open session on 6 July, not the closing print.
| Index | Level | Day Chg | Day Chg % | Source |
|---|---|---|---|---|
| S&P 500 | 7,532.88 | +49.64 | +0.66% | yfinance ^GSPC |
| Nasdaq 100 | 29,746.13 | +416.92 | +1.42% | yfinance ^NDX |
| Dow Jones | 52,912.01 | +11.94 | +0.02% | yfinance ^DJI |
| Brazil IBOV | 172,112.40 | -1,957.86 | -1.12% | yfinance ^BVSP |
Dow Jones is 0.3% below its 52-week high (53,052.70); none of the three US indices above is at a fresh 52-week high today. FRED SP500 close for 2026-07-02 was 7,483.24, consistent with the current intraday level.
Europe
| Index | Level | Day Chg | Day Chg % | Source |
|---|---|---|---|---|
| Euro STOXX 600 | 650.50 | -2.27 | -0.35% | yfinance ^STOXX |
| Euro STOXX 50 | 6,398.01 | -14.67 | -0.23% | yfinance ^STOXX50E |
| CAC 40 | 8,479.87 | -28.20 | -0.33% | yfinance ^FCHI |
| DAX | 25,817.89 | +38.58 | +0.15% | yfinance ^GDAXI |
| FTSE 100 | 10,651.77 | -27.26 | -0.26% | yfinance ^FTSE |
| SMI (Swiss) | 14,302.26 | -121.98 | -0.85% | yfinance ^SSMI |
European data reflects today's close (6 Jul).
Asia-Pacific
| Index | Level | Day Chg | Day Chg % | Source |
|---|---|---|---|---|
| Nikkei 225 | 69,737.69 | -6.38 | -0.01% | yfinance ^N225 |
| Hang Seng | 23,616.32 | +266.29 | +1.14% | yfinance ^HSI |
| Shanghai Comp | 4,041.24 | -2.41 | -0.06% | yfinance 000001.SS |
| ASX 200 | 8,831.00 | -13.40 | -0.15% | yfinance ^AXJO |
| Kospi (Korea) | 8,051.33 | -37.01 | -0.46% | yfinance ^KS11 |
Asia-Pacific data reflects today's close (6 Jul).
Emerging Markets
| Index | Level | Day Chg % | Source |
|---|---|---|---|
| MSCI EM (EEM) | 67.65 | +2.96% | yfinance EEM |
| India Nifty 50 | 24,430.35 | +0.66% | yfinance ^NSEI |
| South Africa (EZA) | 64.67 | +1.05% | yfinance EZA |
MSCI EM's +2.96% (EEM ETF) is a notably strong single-day move relative to the underlying index constituents' local-market performance — likely reflects USD weakness/rebalancing flows on the ETF wrapper; worth confirming against local index levels before treating as a pure EM equity signal.
Index Valuations & Investment Risk
Valuation Table
| Index | Trailing P/E (live) | Hist avg trailing P/E (†) | Premium/discount |
|---|---|---|---|
| S&P 500 | 26.88x | ~16-18x | +58% (stretched) |
| Nasdaq 100 | 33.22x | ~25-30x | +21% |
| Euro STOXX 600 | 18.56x | ~15-17x | +16% |
| CAC 40 | 17.74x | ~14-16x | +18% |
| DAX | 18.85x | ~15-17x | +18% |
| FTSE 100 | 17.97x | ~13-15x | +28% (elevated) |
| Nikkei 225 | 23.70x | ~20-22x | +13% |
| MSCI EM | 17.91x | ~13-15x | +28% (elevated) |
(†) Hist avg trailing P/E: static long-run reference constants.
Trailing P/E (live): sourced from yfinance trailingPE on ETF proxies (SPY, QQQ, EXSA.DE, CAC.PA, EXS1.DE, ISF.L, 1321.T, EEM), fetched 2026-07-06.
Historical reference benchmarks (†): S&P 500 long-run avg ~16-18x; Euro STOXX 600 ~15-17x; MSCI EM ~13-15x. >20% premium = elevated; >40% = historically stretched.
Investment Risk Assessment for ETF Investors
United States (S&P 500 / Nasdaq ETFs) SPY's trailing P/E of 26.9x is 58% above its ~16-18x historical average — the most stretched reading in this valuation set, and it is not a one-off: it is corroborated by a negative equity risk premium (see below). Earnings yield on SPY is (1÷26.879) = 3.72%, versus the 10Y Treasury at 4.48% (FRED DGS10), producing an ERP of -0.76% — bonds currently yield more than the earnings yield on US large caps, a historically rare and cautionary setup. QQQ's 33.2x trailing P/E is a smaller 21% premium to its own (higher) historical band, reflecting continued AI-driven concentration in mega-cap tech. The S&P 500 is trading near its 52-week high (7,620.90) and above both its 50-day (7,394.74) and 200-day (6,942.91) moving averages — a firmly bullish trend structure, but one increasingly reliant on rate-cut hopes given how rich the multiple already is. FRED's 10Y TIPS real yield (DFII10) at 2.25% is itself elevated versus the post-2020 norm, which compounds the valuation pressure by raising the discount rate applied to future earnings.
Europe (STOXX 600 / CAC 40 / DAX ETFs) European equities screen far more reasonably: EXSA.DE's 18.6x trailing P/E is only 16% above its historical band, and the earnings yield of (1÷18.562) = 5.39% comfortably clears the German 10Y (Bund/AAA proxy) yield of 3.01% (ECB YC API, 2026-07-03), producing a positive Euro ERP of +2.38% — a materially more attractive equity-vs-bond trade-off than in the US. FTSE 100's 28% premium is the outlier in Europe, elevated by historical standards. Currency risk is the key consideration for non-EUR/non-GBP investors: EUR/USD sits at 1.1403 (FRED DEXUSEU, 2026-06-26). Geopolitical and fiscal risk in France (not quantified here; see note below) remains a watch item.
Japan (Nikkei / TOPIX ETFs) The Nikkei's 23.7x trailing P/E (1321.T proxy) is a modest 13% premium to its historical band — the least stretched of the major developed markets. The bigger story is monetary policy: the BOJ's hike to 1.00% (16 June 2026, highest since 1995) with a further path toward ~2% neutral is a genuine regime change after decades of near-zero rates. This raises the JPY-hedging cost calculus for foreign holders and increases financing-cost pressure on domestic Japanese corporates that had grown used to near-free capital.
Emerging Markets (MSCI EM ETFs) EEM's 17.9x trailing P/E is a 28% premium to its historical ~13-15x band — elevated, and notably no longer screening as a valuation discount to developed markets the way EM historically has. Today's outsized +2.96% ETF move (vs. more modest India Nifty +0.66%) warrants a sanity check before being read as a broad EM re-rating signal.
Overall Risk Score (qualitative, not financial advice): US — high valuation risk / low margin of safety (negative ERP, 58% premium to historical average). Europe — moderate, more attractive relative valuation (positive ERP, smaller premiums). Japan — moderate, valuation reasonable but policy-normalization risk rising. EM — moderate-to-high, valuation premium has eroded the traditional EM discount argument.
Disclaimer: This is financial information, not personalised investment advice. Past valuations do not guarantee future returns. Consult a financial advisor before investing.
US Economic Indicators (FRED - authoritative)
| Indicator | Current | Prior | Delta | Reference Date | FRED Series |
|---|---|---|---|---|---|
| CPI YoY % | 4.17% | 3.78% | +0.39pp | 2026-05 | CPIAUCSL |
| Core CPI YoY % | 2.82% | 2.74% | +0.08pp | 2026-05 | CPILFESL |
| Unemployment Rate | 4.2% | 4.3% | -0.1pp | 2026-06 | UNRATE |
| Nonfarm Payrolls | 158,984k | 158,927k | +57k | 2026-06 | PAYEMS |
| 10Y TIPS Real Yield | 2.25% | 2.20% | +0.05pp | 2026-07-01 | DFII10 |
Note: headline CPI YoY has reaccelerated for four consecutive months (2.39% → 2.43% → 3.29% → 3.78% → 4.17%), a meaningful inflation trend reversal that sits uncomfortably alongside a nonfarm payrolls print (+57k) that missed consensus (~117k) by a wide margin — a stagflation-adjacent combination that markets currently appear to be reading as "soft jobs data reduces hike risk" rather than "inflation is a growing problem."
Other economic releases today: no additional same-day PMI/GDP/PPI releases were confirmed via web search for 6 July 2026 specifically; the June NFP miss (above) was the dominant recent macro surprise and continues to be discussed as this week's key data point.
Fixed Income & Bond Analysis
Policy Rates
| Central Bank | Rate | Source |
|---|---|---|
| Fed Funds (upper) | 3.75% | FRED DFEDTARU |
| Fed Funds (lower) | 3.50% | FRED DFEDTARL |
| Effective FFR | 3.63% | FRED DFF |
| ECB Deposit Rate | 2.25% | FRED ECBDFR |
| BOJ Policy Rate | 1.00% | web search (hiked 2026-06-16, highest since 1995) |
| BOE Bank Rate | ~3.73% (SONIA/FRED) | FRED IUDSOIA |
Government Bond Yields
| Country | 2Y Yield | 10Y Yield | 30Y Yield | Source |
|---|---|---|---|---|
| USA | 4.17% | 4.48% | 4.97% | FRED (2026-07-01) |
| Germany (AAA proxy) | 2.47% | 3.01% | 3.52% | ECB YC API (2026-07-03) |
| France | (not retrieved — search skipped per source-priority rule since ECB API succeeded) | |||
| UK | 4.13% | 4.79% | — | web (2Y: 2026-07-06; 10Y: 2026-07-03) |
| Japan | — | 2.78% | — | web (2026-07-03) |
| Italy | (not retrieved — search skipped per source-priority rule since ECB API succeeded) |
Note: no separate French OAT or Italian BTP figures today. The euro area AAA curve above is the source for the region, so there is no OAT-Bund spread figure.
Yield Curve Spreads (FRED pre-computed): - 10Y-2Y spread: +35 bps (FRED T10Y2Y, 2026-07-02) — positively sloped and no longer inverted, but still well below the ~100+ bps considered "normal/steep" by pre-2008 historical standards. The curve has flattened modestly over the past month (was ~42 bps a month ago). - 10Y-3M spread: +67 bps (FRED T10Y3M, 2026-07-02) — positive, so this classic recession predictor is not currently flashing a warning.
OAT-Bund Spread: not available today (see note above).
Yield Curve Charts
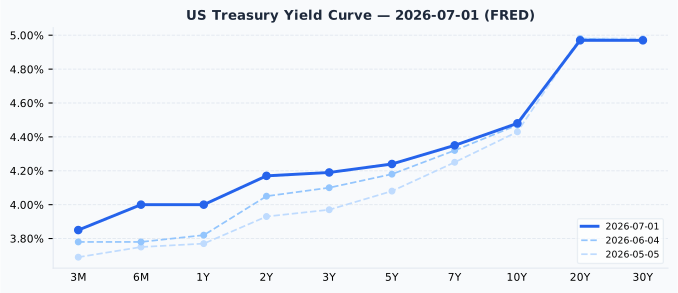
The US curve is upward-sloping from 3M (3.85%) out to 30Y (4.97%), essentially flat between the 20Y and 30Y points — a normal but not steep shape. Versus a month ago (2026-06-04), short-to-belly yields (3M, 2Y) rose faster (+7 to +12 bps) than the long end (10Y +1 bp, 30Y unchanged), consistent with the modest 2s10s flattening noted above.
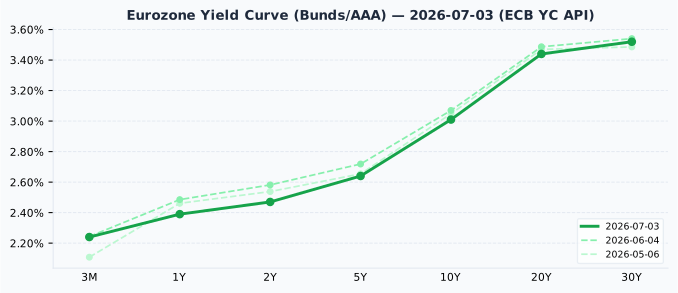
The Eurozone (AAA/Bund proxy) curve is also normally upward-sloping, from 3M (2.24%) to 30Y (3.52%). Versus a month ago, the front end fell more than the long end (2Y -11 bps vs 10Y -6 bps), so the curve has steepened modestly (2s10s spread widened from ~49 bps to ~54 bps) — a mild divergence from the US curve's flattening.
Credit Markets (from FRED — authoritative)
| Market | OAS Spread | Series ID |
|---|---|---|
| US Investment Grade | 75 bps | BAMLC0A0CM |
| US High Yield | 275 bps | BAMLH0A0HYM2 |
| Euro High Yield | 271 bps | BAMLHE00EHYIOAS |
All three spreads sit below their respective normal ranges (US IG normal 80-150 bps; US HY normal 300-500 bps) — credit markets are pricing historically tight, complacent conditions, a contrast with the more cautious signal coming from the negative US equity risk premium.
Bond Portfolio Implications
- S&P 500 ERP = (1÷26.879) − 4.48% = -0.76%. Negative ERP means the 10Y Treasury currently yields more than S&P 500 earnings — historically a warning signal for forward equity returns and an argument for bonds on a risk-adjusted basis.
- Euro ERP = (1÷18.562) − 3.01% = +2.38%. Positive and healthy — European equities remain attractively priced relative to their own risk-free rate, unlike the US.
- Duration risk: with 10Y yields at 4.48%, a further 100 bp rise would imply roughly an 8-9% price loss on a 10-year Treasury — a real risk if inflation's four-month reacceleration (to 4.17% YoY) forces the Fed to reconsider its easing bias implied by today's equity rally.
- Given negative US ERP but tight credit spreads, the more actionable signal for USD fixed income investors right now is a preference for shorter duration and a tilt toward non-US developed-market equities (positive ERP) over further US equity/bond substitution at current valuations.
Currencies & Commodities
Currencies:
| Pair | Rate | Source |
|---|---|---|
| EUR/USD | 1.1403 | FRED DEXUSEU (2026-06-26) |
| USD Index | 120.89 | FRED DTWEXBGS (2026-06-26) |
| USD/JPY | 161.34 | web search |
| GBP/USD | 1.3261 | web search (derived from USD/GBP 0.75408) |
| USD/CHF | 0.8027 | web search |
FRED FX series lag several days behind today; USD/JPY, GBP/USD, and USD/CHF are more current web-sourced spot approximations. USD/JPY at 161.34 places the yen near multi-decade weak levels even after the BOJ's June hike to 1.00% — a reminder that rate differentials, not just the BOJ's own policy level, continue to drive JPY.
Commodities (all from yfinance MCP front-month futures):
| Commodity | Price | Day Chg % | Ticker | Source |
|---|---|---|---|---|
| Brent Crude | $71.88 | +0.11% | BZ=F | yfinance |
| WTI Crude | $68.38 | -0.45% | CL=F | yfinance |
| Gold ($/oz) | $4,161.90 | +0.88% | GC=F | yfinance |
| Silver ($/oz) | $62.16 | +1.79% | SI=F | yfinance |
| Copper ($/lb) | $6.23 | +1.01% | HG=F | yfinance |
| Nat Gas ($/MMBtu) | $3.23 | +1.00% | NG=F | yfinance |
Gold at $4,161.90 is 25.5% below its all-time high of $5,586.20 (also the 52-week high) — a meaningful pullback, not "near highs" language. Silver at $62.16 is 48.8% below its all-time high of $121.30 — an even sharper retracement from its peak. Copper at $6.23/lb is a more modest 6.3% below its ATH of $6.6525. WTI and Brent remain far below their 2008-era all-time highs (-53.6% and -51.2% respectively) — a gap so large it carries little day-to-day relevance and mainly reflects how structurally different the current oil market is from the 2008 supercycle peak.
Crypto: no confirmed >3% moves today; omitted.
Sector & Theme Highlights
US sector performance is showing a clear AI-fatigue rotation: Communication Services and Financials led gains (reported +2.4% and +2.2% in recent sessions per web search), while Information Technology, Utilities, and Industrials lagged (-2.6%, -1.3%, -1.0%). Individual AI-adjacent semiconductor names — Micron, AMD, and Intel — were reported down 4-5.5% in recent sessions, even as the cap-weighted Nasdaq 100 index itself is higher today, underscoring how concentrated mega-cap strength (rather than broad tech participation) is currently driving index-level gains. Cross-market theme: Japan's monetary policy normalization (BOJ at 1.00%, more hikes flagged toward ~2%) is a genuine structural shift after three decades of near-zero rates, with knock-on implications for JPY carry trades and global liquidity.
Note: some of the sector/stock-move figures above were sourced from web search results spanning several recent trading days rather than confirmed as occurring specifically today (6 July) — treat the sector rotation theme as directionally current rather than a same-day print.
Top Stories (Global)
- US jobs data miss reshapes rate expectations: June nonfarm payrolls rose just 57,000 vs. ~117,000 consensus (FRED PAYEMS / Dept. of Labor), a large downside surprise that markets read as reducing the odds of further near-term Fed tightening.
- US large caps broadly higher (Dow +0.02%, S&P 500 +0.66%, Nasdaq 100 +1.42% intraday) while the broader tech complex shows internal divergence — cap-weighted Nasdaq 100 gains mask reported weakness in AI-semiconductor names (Micron, AMD, Intel). Note: a web-sourced headline described a "record-high" Dow close of 52,900.07 in a recent session, but that figure is itself below the yfinance-confirmed 52-week high of 53,052.70 — treat the "record" framing in that headline with caution.
- BOJ continues historic policy normalization: having hiked to 1.00% on 16 June 2026 (highest since 1995), board commentary points to further hikes toward a ~2% neutral rate over coming months.
- Dell surged (+7.7% in a recent session) after a high-profile product promotion event, an idiosyncratic single-stock mover rather than a sector-wide signal.
- SpaceX set to join the Nasdaq-100 index before trading opens 7 July — a notable index-reconstitution event with associated passive-fund rebalancing flows.
- US inflation trend reversal: headline CPI YoY has risen for four straight months to 4.17% (May 2026), a divergence from the market's current rate-cut-friendly read of the jobs data that bears watching.
- Credit markets remain historically tight (US HY 275 bps, US IG 75 bps) even as equity valuations (especially US) stretch further — a split signal between credit and equity risk-pricing worth monitoring.
Looking Ahead
Key events in the next 1-5 trading days: - BOJ policy path: further commentary expected on the pace toward the ~2% neutral rate following June's hike to 1.00%. - US inflation/jobs data watch: given June's NFP miss alongside four months of CPI reacceleration, upcoming data releases will be scrutinized closely for signs of stagflationary pressure. - SpaceX Nasdaq-100 inclusion: effective before trading opens 7 July 2026, with associated index-fund rebalancing flows. - Market closures (next 5 calendar dates, from holiday calendar): - 14 July — France: Bastille Day (Fête Nationale) - 17 July — South Korea: Constitution Day - 20 July — Japan: Marine Day - 1 August — Switzerland: Swiss National Day - 11 August — Japan: Mountain Day
No US, UK, Germany, Australia, Canada, or Brazil market holidays fall within the next 5 calendar closure dates tracked. India holiday data was not available and could not be checked.