2026 09 30
Global Financial Briefing — Wednesday, 30 September 2026
Figures reflect the 30 Sep close wherever close data exists. FX quotes and the French, German, UK, Japanese and Italian bond yields are late-afternoon quotes; other figures are dated inline. The US Treasury curve is the 30 Sep close; the euro AAA curve is the 29 Sep curve, the latest the ECB had published.
Market Overview
US inflation came in lower than expected and long-term Treasury yields rose anyway. The Fed's preferred inflation measure, the personal consumption expenditures (PCE) price index, rose 3.4% in the year to August against 3.7% forecast, and core PCE, which leaves out food and energy, rose 3.0% against 3.3% (CNBC, Seoul Economic Daily). Part of the shortfall is a change of method: the Bureau of Economic Analysis now measures spending on software, investment management and legal services differently, which lowered core inflation by about 0.2 pp and was applied to five years of history. Futures traders cut the chance of a Fed rise at the October meeting to 47.1% after the release, from 70.3% on 29 September (CME FedWatch, via KuCoin and TheStreet). Short-term yields fell with those odds, the 3-month Treasury down 5 bp to 4.20%, but the long end kept climbing: the 10-year Treasury closed at 5.29%, up 3 bp, and the 30-year at 5.64%, up 5 bp (US Treasury par curve, 30 Sep), the 30-year at its highest since June 2002 (TheStreet via Yahoo Finance).
Oil rose after Tuesday's fall. The December Brent contract (BZZ26) settled at $98.03, up 1.94% on Tuesday's settlement, and November WTI (CLX26) at $90.42, up 1.16%. Iran's government spokesperson said Tehran had received a US response to its proposal for reopening the Strait of Hormuz, without saying what it contained, and President Trump said Iran was failing badly (Trading Economics, Fortune). US shares spent most of the last trading day of the quarter higher but turned lower in the final minutes (Investrade): the S&P 500 closed 0.25% lower and the Dow 0.86% lower, while the Nasdaq 100 held a 0.23% gain on technology, the only sector fund to rise (+0.64%). Over the third quarter the S&P 500 gained 2.0% and the Dow lost 2.7%, after a September in which the Dow fell 4.3% (Investrade). Private employers added 90,000 jobs in September on ADP's count, above the 68,000 expected, and second-quarter GDP growth was revised up to 2.2% annualised from 1.5% (TheStreet via Yahoo Finance, Quartz).
Europe fell and France did worst, as it did on 29 September. The CAC 40 closed 0.89% lower at 7,964.51, below 8,000 for the first time since 20 May (BFM Bourse), and the STOXX 600 fell 0.50%. September inflation came in above forecasts in Germany, France and Spain, driven by energy: Germany 3.3% (3.1% expected), France 3.4% on the harmonised measure (3.1% expected) and Spain 5.0% (4.9% expected) (investinglive, Boursorama, FXStreet). German yields nevertheless fell, the 2-year by about 8 bp to 3.20%, after the ECB's Peter Kazimir said the central bank has time to keep its policy flexible (Trading Economics). French yields did not follow, so the gap between French and German 10-year borrowing costs stayed at 120 bp or more, the widest since 2012. In Asia the Nikkei rose 1.94% after falling on 28 and 29 September, and the ASX 200 gained 0.92%; the Hang Seng rose 0.37% and the Kospi fell 0.48%.
Global Indices Snapshot
Americas
| Index | Level | Day Chg | Day Chg % | Source |
|---|---|---|---|---|
| S&P 500 | 7,651.54 | −19.30 | −0.25% | yfinance ^GSPC |
| Nasdaq 100 | 30,408.50 | +69.17 | +0.23% | yfinance ^NDX |
| Dow Jones | 50,906.05 | −443.87 | −0.86% | yfinance ^DJI |
| Brazil IBOV | 186,340.45 | +2,512.86 | +1.37% | yfinance ^BVSP |
Americas data reflects the 30 Sep close. The S&P 500 is 2.11% below its 52-week high and 0.08% above its 50-day average (7,645); the Nasdaq 100 is 1.15% below its record of 30,762.20. The Dow is 3.54% below its 50-day average (52,773). The Ibovespa is 4.67% above its 50-day average (178,033).
Europe
| Index | Level | Day Chg | Day Chg % | Source |
|---|---|---|---|---|
| Euro STOXX 600 | 634.89 | −3.19 | −0.50% | yfinance ^STOXX |
| CAC 40 | 7,964.51 | −71.36 | −0.89% | yfinance ^FCHI |
| DAX | 25,199.19 | −200.02 | −0.79% | yfinance ^GDAXI |
| FTSE 100 | 10,606.00 | −30.71 | −0.29% | yfinance ^FTSE |
| SMI (Swiss) | 13,830.34 | −81.85 | −0.59% | yfinance ^SSMI |
European data reflects today's close (30 Sep). All five indices are below their 50-day averages: the FTSE by 1.54%, the STOXX 600 by 2.04%, the DAX by 2.44%, the SMI by 2.94% and the CAC 40 by 4.87%. The CAC is also 3.36% below its 200-day average (8,241); the others remain above theirs. The Euro STOXX 50 closed 0.81% lower at 6,269.02. In Paris, Axa was the weakest CAC stock at mid-session (−2.4%) and Pernod Ricard the strongest (+1.6%) (BFM Bourse).
Asia-Pacific
| Index | Level | Day Chg | Day Chg % | Source |
|---|---|---|---|---|
| Nikkei 225 | 66,753.72 | +1,272.45 | +1.94% | yfinance ^N225 |
| Hang Seng | 24,613.27 | +89.70 | +0.37% | yfinance ^HSI |
| Shanghai Comp | 3,842.19 | +11.74 | +0.31% | yfinance 000001.SS |
| ASX 200 | 8,789.30 | +80.00 | +0.92% | yfinance ^AXJO |
| Kospi (Korea) | 6,838.04 | −32.77 | −0.48% | yfinance ^KS11 |
Asia-Pacific data reflects today's close (30 Sep).
Emerging Markets
| Index | Level | Day Chg % | Source |
|---|---|---|---|
| MSCI EM (EEM) | 66.79 | −0.91% | yfinance EEM |
| India Nifty 50 | 22,620.45 | −0.42% | yfinance ^NSEI |
| South Africa | 63.98 | −1.34% | yfinance EZA |
The Nifty reflects today's close (30 Sep); EEM and EZA are the 30 Sep New York closes. EEM fell 0.91% although its largest local markets had closed mixed before New York opened (Hong Kong +0.37%, Shanghai +0.31%, Korea −0.48%, India −0.42%). A US-listed fund keeps trading after those markets shut, so its price also carries what happens during New York hours; Asia's next session will show whether the fall holds.
Index Valuations & Investment Risk
Valuation Table
| Index | Trailing P/E (live) | 50-day avg | 100-day avg | 200-day avg |
|---|---|---|---|---|
| S&P 500 | 24.6x | 25.7x | 26.4x | — |
| Nasdaq 100 | 30.2x | 30.3x | 31.9x | — |
| Euro STOXX 600 | 17.5x | 18.1x | 18.2x | — |
| CAC 40 | 16.2x | 17.2x | 17.4x | — |
| DAX | 17.8x | 18.6x | 18.5x | — |
| FTSE 100 | 15.1x | 17.3x | 17.6x | — |
| Nikkei 225 | 22.3x | 21.7x | 22.8x | — |
| MSCI EM | 14.2x | 16.0x | 16.9x | — |
Averages of the daily trailing P/E readings recorded since 1 May 2026 (n = 100); shown for reference only.
Investment Risk Assessment for ETF Investors
United States (S&P 500 / Nasdaq ETFs)
The S&P 500's trailing P/E of 24.6x gives an earnings yield of 4.06% (1÷24.64). Against the 10-year Treasury at 5.29% (US Treasury par curve, 30 Sep), the earnings yield gap is −1.23 pp: a 10-year government bond pays more in income today than the index's earnings amount to per dollar invested. Against the real 10-year yield of 2.93% (US Treasury real curve, 30 Sep) the gap is +1.13 pp; the 2.36 pp difference between the two is the correction for company earnings growing with inflation while a bond coupon is fixed. Only the part of earnings paid out as dividends and buybacks reaches a holder as cash. The index is 2.11% below its 52-week high and 6.07% above its 200-day average (7,213), so its price has adjusted little to 10-year yields above 5.2%. The Nasdaq 100 at 30.2x has an earnings yield of 3.32%, 1.97 pp below the 10-year Treasury, and is 1.15% below its record. Today's softer inflation lowered the odds of an October Fed rise, which helps shares whose value rests on profits far in the future, but the 30-year yield at its highest since 2002 works the other way: it raises the rate at which those distant profits are discounted.
Europe (STOXX 600 / CAC 40 / DAX ETFs)
The STOXX 600 at 17.5x gives an earnings yield of 5.72% (1÷17.49); against the 10-year Bund at 3.58% (Trading Economics, 30 Sep) the euro earnings yield gap is +2.14 pp, and against the euro-area real 10-year yield of 1.57% (see Real Yields below) it is +4.15 pp. The S&P 500 trades at a 41% P/E premium to the STOXX 600 (24.6x against 17.5x). Part of the difference between the US and euro gaps reflects different inflation and policy paths rather than different compensation for risk, which is why the real-yield versions are shown alongside. The CAC 40 at 16.2x is the cheapest of the three major euro indices and the weakest: 4.87% below its 50-day and 3.36% below its 200-day average. The bond market shows why: France pays 120 bp or more over Germany to borrow for ten years, more than Italy does (4.84% against 4.62%), and Trading Economics links it to a large primary deficit and a fragmented parliament. Today's inflation figures add a second pressure for all euro shares: energy-driven inflation above 3% in Germany and France keeps a further ECB rise possible even as ECB officials sound patient. A euro investor in euro-quoted funds has no exchange-rate effect on the quoted value, but the constituents earn much of their profit abroad, so the euro's moves against the dollar still reach their earnings.
Japan (Nikkei / TOPIX ETFs)
The Nikkei ETF proxy trades at 22.3x, and the index rose 1.94% today. Reuters' monthly survey of Japanese manufacturers rose to +21 in September from +18, its highest since December 2021, led by electronics makers on chip demand (investinglive); the Bank of Japan's own quarterly Tankan survey is due on 1 October. The Bank of Japan raised its policy rate to 1.25% on 18 September, its second rise this year after the 16 June move to 1.00%, and the 10-year JGB yield is 3.07% (Trading Economics, 30 Sep). The yen was little changed at 157.17 per dollar. For a euro investor an unhedged Japan fund carries the yen's moves in full, so the choice between hedged and unhedged matters as much as the view on Japanese shares.
Emerging Markets (MSCI EM ETFs)
EEM trades at 14.2x, the cheapest of the eight indices in the table. It fell 0.91% in New York while its local markets had closed mixed, so the move is New York's view of emerging markets rather than what those markets did today. Higher US long-term yields hurt emerging markets mainly through their economies: companies and governments with dollar debt pay more, foreign money tends to leave, and local central banks come under pressure to raise their own rates, whatever currency the investor spends. For a euro holder the currency conversion matters less, since the euro and emerging-market currencies tend to move against the dollar together.
Overall Risk Score: - United States: High valuation risk / low margin of safety. A negative nominal earnings yield gap, an index about 2% from its 52-week high, and long-term yields at 19- to 24-year highs. - Europe: Moderate. Positive earnings yield gaps on both measures, but inflation back above 3% in Germany and France and French borrowing costs at their widest over Germany since 2012. - Japan: Moderate. A P/E of 22.3x, between Europe's and the US's; the BOJ and the yen are the main risks. - Emerging Markets: Attractive relative valuation, with higher US long-term yields and the unresolved Hormuz talks as the near-term headwinds.
US Economic Indicators (FRED - authoritative)
| Indicator | Current | Prior | Delta | Reference Date | FRED Series |
|---|---|---|---|---|---|
| CPI YoY % | 3.35% | 3.30% | +0.05 pp | Aug 2026 (prior Jul) | CPIAUCSL |
| Core CPI YoY % | 2.45% | 2.47% | −0.02 pp | Aug 2026 (prior Jul) | CPILFESL |
| Unemployment Rate | 4.1% | 4.1% | 0.0 pp | Aug 2026 (prior Jul) | UNRATE |
| Nonfarm Payrolls | +162k | +21k | +141k | Aug 2026 (prior Jul), monthly chg | PAYEMS |
| 10Y TIPS Real Yield | 2.93% | 2.91% | +2 bp | 30 Sep 2026 (prior 29 Sep) | DFII10 (US Treasury real curve) |
Headline consumer price inflation at 3.35% runs almost a point above core at 2.45%, the gap opened by energy prices. Today's PCE figures show the same gap on the Fed's preferred measure: 3.4% headline against 3.0% core. September's employment report is due on Friday 2 October.
Other economic releases today (CNBC, Seoul Economic Daily, TheStreet via Yahoo Finance, Quartz, investinglive, Boursorama, FXStreet):
| Release | Actual | Consensus | Prior |
|---|---|---|---|
| US PCE price index (Aug), year on year | 3.4% | 3.7% | — |
| US core PCE (Aug), year on year | 3.0% | 3.3% | — |
| US GDP, Q2 third estimate (annualised) | 2.2% | — | 1.5% |
| US ADP private employment (Sep) | +90k | +68k | +36k |
| Germany CPI flash (Sep), year on year | 3.3% | 3.1% | 2.9% |
| France HICP flash (Sep), year on year | 3.4% | 3.1% | 2.6% |
| Spain HICP flash (Sep), year on year | 5.0% | 4.9% | 4.6% |
The PCE prior is left blank because the new method was applied to past months as well, so July's published figure is no longer the comparison. The GDP prior is the second estimate of the same quarter; the ADP prior is August as revised today.
US inflation undershot forecasts and euro-area inflation overshot them. Month on month, US PCE prices rose 0.3% and core 0.2%. In Germany, energy prices were up 14.9% on a year earlier against 10.5% in August, while core inflation held at 2.4%; in France energy rose 21.2% and fresh food 9.9% (investinglive, Boursorama).
Fixed Income & Bond Analysis
US Treasury yields in the tables come from the US Treasury's own daily feed and are the 30 September close. European, UK and Japanese yields are from Trading Economics, 30 September, afternoon quotes.
Policy Rates
| Central Bank | Rate | Source |
|---|---|---|
| Fed Funds (upper) | 4.00% | FRED DFEDTARU (30 Sep) |
| Fed Funds (lower) | 3.75% | FRED DFEDTARL (30 Sep) |
| Effective FFR | 3.88% | FRED DFF (29 Sep) |
| ECB Deposit Rate | 2.50% | FRED ECBDFR (30 Sep) |
| BOJ Policy Rate | 1.25% | Bank of Japan (raised 18 Sep 2026) |
| BOE Bank Rate | ~3.73% | SONIA/FRED IUDSOIA (28 Sep) |
The Fed raised its target range to 3.75–4.00% on 16 September, its first hike since 2023. After today's PCE data futures put a 47.1% chance on a further rise at the October meeting and a 90% chance of at least one by December (CME FedWatch, via KuCoin). The ECB deposit rate has been 2.50% since 10 September, its second hike this year after 17 June's move to 2.25%; today Kazimir said the ECB has time to keep its policy flexible (Trading Economics). UK markets put about an 80% chance on 30 September on a Bank of England rise in November, although policymaker Alan Taylor played down the need to raise rates in response to energy prices (Trading Economics).
Government Bond Yields
| Country | 2Y Yield | 10Y Yield | 30Y Yield | Day Chg (10Y) | Source |
|---|---|---|---|---|---|
| USA | 4.88% | 5.29% | 5.64% | +3 bp | US Treasury par curve (30 Sep) |
| Germany | 3.20% | 3.58% | 3.93% | −3 bp | web (Trading Economics, 30 Sep) |
| France | — | 4.84% | — | +3 bp | web (Trading Economics, 30 Sep) |
| UK | 4.76% | 5.42% | 5.95% | +3 bp | web (Trading Economics, 30 Sep) |
| Japan | — | 3.07% | — | −2 bp | web (Trading Economics, 30 Sep) |
| Italy | — | 4.62% | — | −1 bp | web (Trading Economics, 30 Sep) |
US day change is 30 Sep vs 29 Sep. The European, UK and Japanese rows are 30 Sep afternoon quotes.
Yield Curve Spreads (US Treasury par curve, 30 Sep): - 10Y-2Y spread: +41 bp. Positive and moderately sloped, neither inverted nor steep: investors ask a modest extra yield to lend for ten years rather than two. - 10Y-3M spread: +109 bp. Firmly positive, not a recession signal. The 3-month bill at 4.20% is about 33 bp above the Fed funds midpoint of 3.875%, consistent with markets expecting at least one more Fed rise.
The curve steepened on 30 September. The 10Y-2Y spread widened from 37 bp to 41 bp as the 10-year rose 3 bp and the 2-year fell 1 bp. At the two ends, the 3-month yield fell 5 bp and the 30-year rose 5 bp. Lower odds of a near-term Fed rise pulled short yields down; the long end rose regardless.
OAT-Bund Spread: Trading Economics' afternoon quotes, the French 10-year at 4.84% against the Bund at 3.58%, put the spread at 126 bp, 7 bp wider than on 29 September. Morning and mid-session quotes put it lower: 121 bp at 09:19 Paris time (OAT 4.772%, Bund 3.564%, Le Grand Continent), and about 120 bp at mid-session with the OAT easing slightly to 4.78% (BFM Bourse). The sources agree on the level, about 120 bp or more and the widest since 2012, but not on today's direction, so the 7 bp widening should be read with caution. The French 10-year yields more than the Italian (4.62%), which fell 1 bp.
Yield Curve Charts
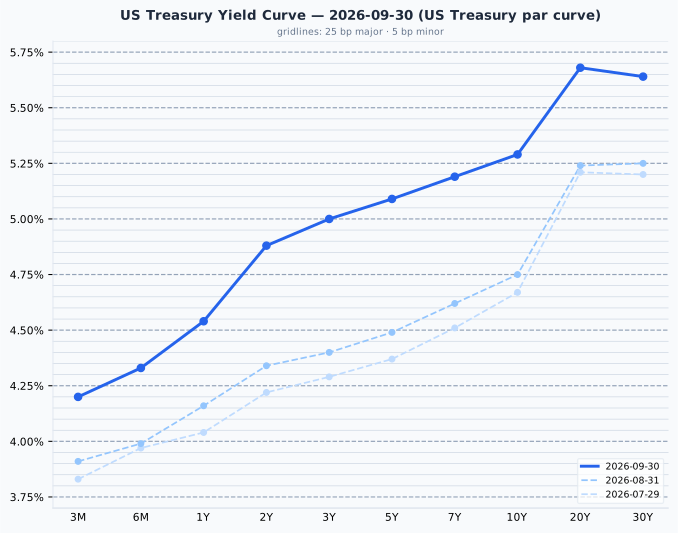
The US curve on 30 September rises from 4.20% at 3 months to 5.68% at 20 years, dipping slightly to 5.64% at 30 years. Since 31 August it has risen most at maturities from 2 to 10 years (2-year from 4.34% to 4.88%, 10-year from 4.75% to 5.29%) and less at both ends (3-month from 3.91% to 4.20%, 30-year from 5.25% to 5.64%), the pattern of a market pricing further Fed rises.
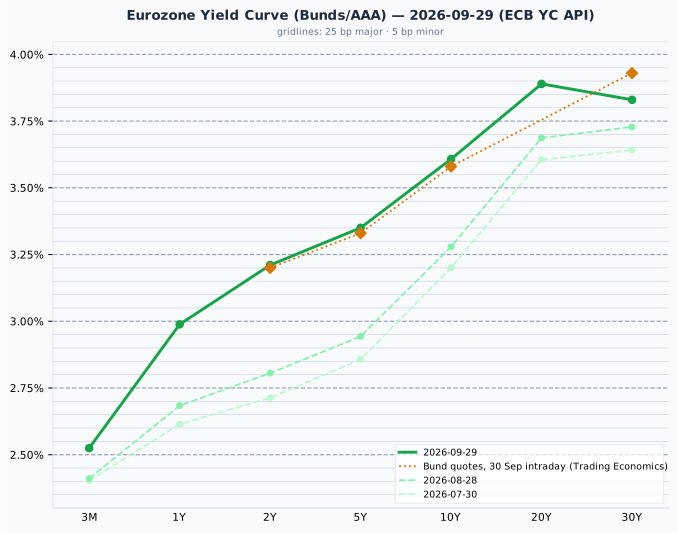
The euro AAA curve on 29 September slopes upward from 2.52% at 3 months to 3.89% at 20 years, dipping to 3.83% at 30 years. Since 28 August it has risen 40 bp at the 2-year (2.81% to 3.21%) and 33 bp at the 10-year (3.28% to 3.61%), led by the 2- to 5-year maturities after the ECB's 10 September hike. Today's Bund quotes (amber) are within 3 bp of the plotted curve out to 10 years; the largest gap is 10 bp at 30 years (3.93% against 3.83%). The curve is the ECB's fitted AAA euro-area curve and the quotes are individual German bonds, which normally sit a few bp apart at the long end (the same gap was 11 bp on 29 September), so this is a difference in construction rather than a move today.
Credit Markets (from FRED, authoritative)
| Market | OAS | Obs. date | vs prior obs | Series ID |
|---|---|---|---|---|
| US Investment Grade | 84 bp | 29 Sep | +1 bp | BAMLC0A0CM |
| US High Yield | 308 bp | 29 Sep | +6 bp | BAMLH0A0HYM2 |
| Euro High Yield | 294 bp | 29 Sep | +5 bp | BAMLHE00EHYIOAS |
Change is 29 Sep vs 28 Sep.
Credit spreads are the 29 September close; today's session is not in them yet. The extra yield lenders demand from riskier US companies widened 6 bp to 308 bp on 29 September, inside the 300–500 bp range that is normal for it and near its bottom edge. Euro high yield widened 5 bp to 294 bp. Investment grade at 84 bp is at the low end of its 80–150 bp normal range. The VIX was 16.04 on 29 September (FRED VIXCLS), a moderate reading.
Real Yields (US and Euro Area)
| Region | Nominal 10Y | Expected inflation | Real 10Y | How the real yield is obtained |
|---|---|---|---|---|
| United States | 5.29% (30 Sep) | 2.36% (nominal − real, residual) | 2.93% (30 Sep) | Measured. Inflation-protected Treasuries (TIPS) trade, so the market quotes a real yield directly; expected inflation is the residual |
| Euro area | 3.61% (ECB AAA, 29 Sep) | 2.04% (ECB SPF, 2026 Q3, measured) | 1.57% (nominal − expected, residual) | Constructed. No euro inflation-linked benchmark is published, so a survey expectation is subtracted from the nominal yield |
Only the US real yield is a market price; the euro figure is derived from a survey and is the softer of the two. The US figure also contains a premium investors demand for bearing inflation risk, which a survey does not, and the survey looks five years ahead against the bond's ten. With the US leg dated 30 September and the euro leg 29 September, the 168 bp gap between US and euro nominal 10-year yields splits into about 32 bp of expected-inflation difference (2.36% against 2.04%) and about 136 bp of real-rate difference (2.93% against 1.57%): nearly all of it is a difference in real rates. The US real yield rose 2 bp on 30 September, from 2.91% on 29 September, against a 3 bp rise in the nominal yield, so expected inflation edged up 1 bp.
Why the US real-yield advantage is not a return a euro investor can capture
A real yield is real in its own currency: 2.93% is 2.93% above US inflation, not euro-area inflation. Hedging a Treasury back into euros removes the interest-rate difference through the forward exchange rate, so the hedged return ends up close to the euro bond's; left unhedged, the extra yield becomes a bet on the dollar rather than a bond decision. The gap reflects the two economies' different growth and policy settings, which is why it has persisted in every quarter since 2014.
Bond Portfolio Implications
- S&P 500 earnings yield gap: 4.06% (1÷24.64) − 5.29% = −1.23 pp nominal; +1.13 pp against the 2.93% real yield.
- Euro earnings yield gap: 5.72% (1÷17.49) − 3.58% (Bund) = +2.14 pp nominal; +4.15 pp against the 1.57% euro real yield.
These compare the income on offer today: a US investor can lock in 5.29% for ten years in Treasuries, against an earnings yield of about 4% on the S&P 500 that grows with profits but is only partly paid out. They say nothing about which asset will return more over the coming years.
A 10 bp rise in yields is an ordinary day's move. At the 30 September settled par yields it costs:
| Maturity | Yield | Modified duration | Loss for a 10 bp rise | Months of coupon lost |
|---|---|---|---|---|
| 2-year | 4.88% | 1.88 | 0.19% | 0.5 |
| 10-year | 5.29% | 7.69 | 0.77% | 1.7 |
| 30-year | 5.64% | 14.39 | 1.42% | 3.0 |
Par-bond figures at the 30 Sep settled yields.
The 3 bp rise at the 10-year on 30 September cost a holder about 0.23%, about half a month's coupon, and the 5 bp rise in the 30-year about 0.72%, a month and a half of coupon, while the 3-month yield fell. The 2-year pays 4.88% with less than a quarter of the 10-year's price sensitivity, so short maturities still offer most of the income for far less exposure while long yields rise even on good inflation news.
Currencies & Commodities
Currencies
| Pair | Rate | Day chg % | Source |
|---|---|---|---|
| EUR/USD | 1.1353 | +0.06% | yfinance (17:50 CEST) |
| USD Index (DXY, ICE) | 101.29 | −0.08% | yfinance (17:40 CEST) |
| USD/JPY | 157.17 | −0.06% | yfinance (17:50 CEST) |
| GBP/USD | 1.3274 | +0.34% | yfinance (17:50 CEST) |
| USD/CHF | 0.8347 | +0.20% | yfinance (17:50 CEST) |
FX quotes as of 17:40–17:50 CEST; day change vs the previous 17:00 ET close.
The dollar was little changed even though the PCE figures lowered the odds of an October Fed rise: the ICE dollar index fell 0.08% and the euro rose 0.06% to 1.1353. The pound gained most (+0.34%). The Swiss franc weakened 0.20% against the dollar, and the yen was little changed at 157.17.
Commodities
| Commodity | Price | Day Chg % | Ticker | Source |
|---|---|---|---|---|
| Brent Crude | 98.03 | +1.94% | BZ=F | yfinance |
| WTI Crude | 90.42 | +1.16% | CL=F | yfinance |
| Gold ($/oz) | 4,186.70 | +0.17% | GC=F | yfinance |
| Silver ($/oz) | 60.57 | −0.96% | SI=F | yfinance |
| Copper ($/lb) | 6.622 | +0.27% | HG=F | yfinance |
| Nat Gas ($/MMBtu) | 3.026 | +0.50% | NG=F | yfinance |
Day changes are settlement-to-settlement: 30 Sep settlement vs 29 Sep settlement.
The table shows the December Brent contract (BZZ26), November WTI (CLX26), December gold, silver and copper, and November natural gas, the same contracts as on 29 September; none expires in the next three days. Over September the December Brent contract rose 10.9%, from its 31 August settlement of $88.37 (Yahoo Finance). The gap between Brent and WTI widened to $7.61 at Wednesday's settlements from $6.78 on Tuesday. Front-month Brent and WTI prices remain far below their 52-week highs (Brent $126.10, WTI $119.48) and well above their 52-week lows ($58.72 and $54.98).
Gold at $4,186.70 is 25.1% below its all-time high of $5,586.20 (29 January 2026) and 8.9% above its 52-week low of $3,842.80. Silver at $60.57 is 50.1% below its all-time high of $121.30, set the same day. Copper at $6.62 is slightly below its all-time high of $6.83, set on 22 September, 3.1% away. Natural gas at $3.03 sits in the lower part of its 52-week range ($2.48 to $7.83).
Crypto: no notable move; Bitcoin was near $83,770, up 0.9% (TheStreet via Yahoo Finance).
Sector & Theme Highlights
US sector funds (Select Sector SPDRs, 30 Sep close): technology (XLK) +0.64% was the only gain, and energy (XLE) −0.06% was flat. Consumer discretionary (XLY) −0.28%, communication services (XLC) −0.45%, utilities (XLU) −0.68%, materials (XLB) −0.81%, real estate (XLRE) −1.04%, financials (XLF) −1.13%, industrials (XLI) −1.27%, health care (XLV) −1.35% and consumer staples (XLP) −1.53% fell.
- Technology alone: the technology fund's 0.64% gain kept the Nasdaq 100 up 0.23% while the S&P 500 fell; real estate and utilities, whose steady payouts compete with bond yields, fell alongside consumer staples and health care on a day the 30-year yield rose 5 bp.
- Oil up, energy shares flat: crude settled 1.2–1.9% higher but the energy fund ended flat (−0.06%); on 29 September both had fallen together.
- Energy inflation in Europe: energy prices up 14.9% on a year earlier in Germany and 21.2% in France pushed headline inflation above 3% in both, while German core inflation held at 2.4%.
- French fiscal risk: the CAC 40 fell below 8,000 for the first time since May, trailing the STOXX 600 by 0.4 points, with French 10-year borrowing costs 120 bp or more above Germany's.
- Japanese manufacturing: the Reuters Tankan's electronics component jumped to +39 from +24 on semiconductor and data-centre demand (investinglive), in line with the Nikkei's 1.94% gain.
Top Stories (Global)
- US inflation below forecasts, long yields up regardless. August PCE inflation was 3.4% (3.7% expected) and core 3.0% (3.3% expected), helped by a change in how the government measures some services; October Fed-hike odds fell to 47.1% after the release, from 70.3% on 29 September, yet the 30-year Treasury closed at 5.64%, its highest since June 2002 (CNBC, TheStreet via Yahoo Finance, KuCoin).
- Euro-area inflation above forecasts on energy. Germany 3.3%, France 3.4% (harmonised) and Spain 5.0% in September; German core steady at 2.4%. Bund yields fell nonetheless after the ECB's Kazimir said the bank has time to keep policy flexible (investinglive, Boursorama, Trading Economics).
- Iran says it has a US reply on Hormuz. Tehran received the US response to its proposal for reopening the strait but did not disclose it; Iran's rial hit a record low of 2.5 million per dollar on 29 September (Fortune). Brent settled 1.9% higher.
- CAC 40 below 8,000 for the first time since 20 May, with the French-German 10-year spread at 120 bp or more, the widest since 2012 (BFM Bourse, Le Grand Continent).
- US growth revised up, hiring steady: second-quarter GDP growth was revised to 2.2% from 1.5%, and ADP counted 90,000 new private jobs in September against 68,000 expected (Quartz, TheStreet via Yahoo Finance).
- Japanese manufacturers most confident since December 2021 on Reuters' monthly survey (+21); the BOJ's quarterly Tankan follows on 1 October (investinglive, Nippon.com).
Looking Ahead
- Thursday 1 October: the Bank of Japan's quarterly Tankan survey, where forecasters expect the large-manufacturer index to rise 4 points to +26 (Nippon.com); US ISM manufacturing index and weekly jobless claims (The Right Trader).
- Friday 2 October: US September employment report, the last major labour data before the October Fed meeting, where futures priced a 47% chance of a rise after the PCE release on 30 September; flash euro-area inflation for September (FXStreet), which today's German, French and Spanish figures suggest will rise.
- Middle East: what the US reply to Iran's Hormuz proposal contains, and whether talks resume; oil and, through it, European inflation depend on it.
- France: budget negotiations and the OAT-Bund spread, now at its widest since 2012.
- Japan: the next BOJ meeting is on 28 October; the yen near 157 per dollar keeps the question of intervention open.
Market closures - Wednesday 30 September: Canada, National Day for Truth and Reconciliation (public holiday). - Saturday 3 October: Germany, German Unity Day (falls on a weekend; no trading-day closure). - Monday 5 October: South Korea, National Foundation Day.
Indian market closures are not listed.